Open Tasks Screen
Open Tasks chart shows the amount of unfinished work in your project and how that changes as your work progresses. See how much work is assigned to each team member, or associated with a specific label. See how your backlog develops over time.

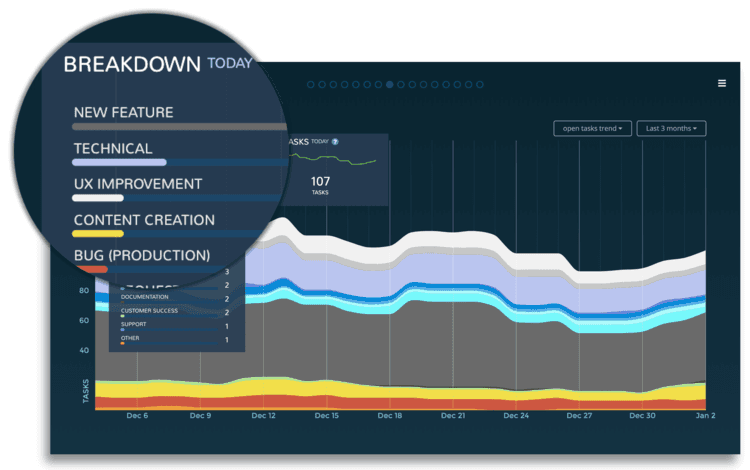
SEE HOW MANY TASKS ARE CURRENTLY OPEN
The top left overlay shows the number of tasks (or story points) per label. You can click-through to see the list of tasks behind the numbers.
You can have all or a subset of your tasks included. You change the grouping from the quick menu to show e.g. number of tasks per assignee.
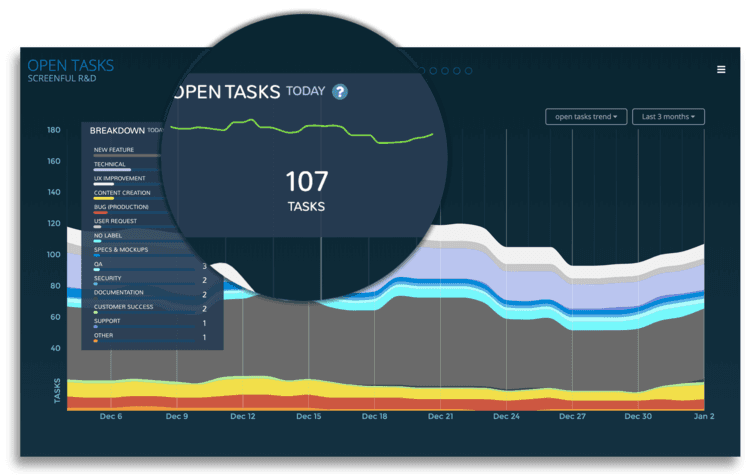
SEE THE TREND OF OPEN TASKS
The overlay on the right shows the open tasks trend. Your open tasks consists of tasks that are not started yet and the tasks that are currently in progress.
You can use the state filter to select which states are included.
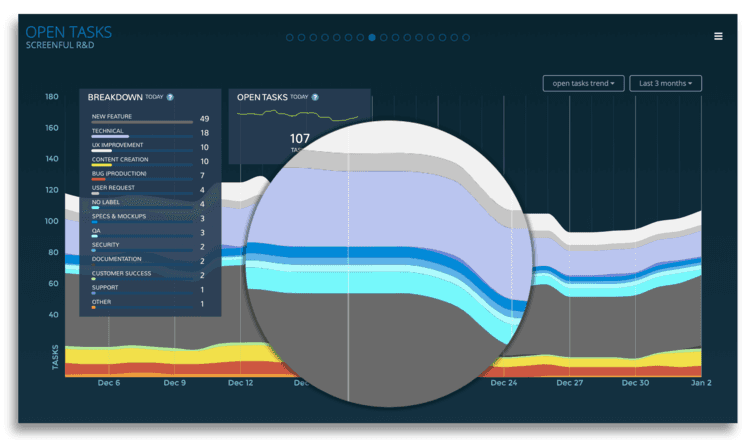
IS YOUR WORK FLOWING SMOOTHLY OR PILING UP?
Each coloured area of the chart represents the number of tasks (or story points) per work type at a given moment. The horizontal axis indicates time, and the vertical axis indicates the number of tasks.
Is the unfinished work piling up for a specific assignee or work type?
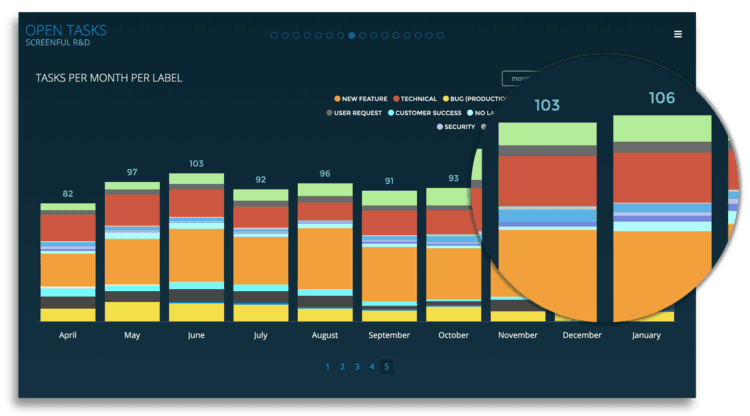
SEE THE WEEKLY, MONTHLY, AND QUARTERLY BREAKDOWN
You can quickly see how much unfinished work there has been per week, month, or quarter. Is your backlog growing or shrinking?
You can further slice and dice to what types of tasks those were and who they were assigned to.
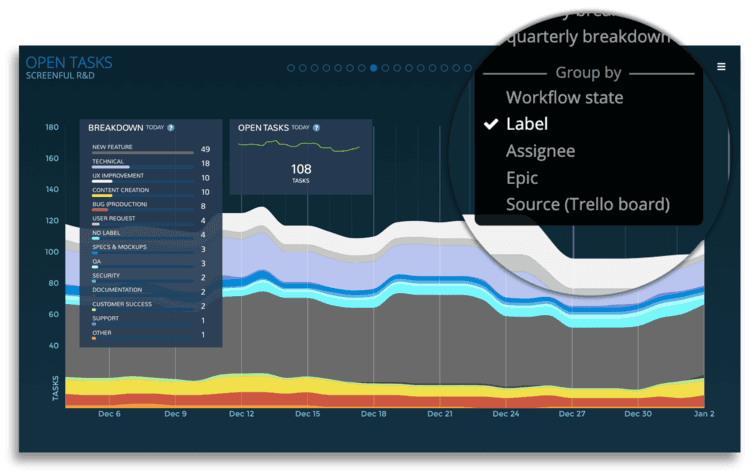
SLICE & DICE PER BOARD, LABEL, ASSIGNEE...
Use the quick menu to switch between different reports. Use the group by options to see the number of tasks completed per dimension such as label, source or assignee.
Explore and find the exact report you were looking for!
Learn More
How to set up: Getting started with Screenful
From our blog: Visualise your work with the Open Tasks chart