Setting up an information radiator - Part 2 - Tracking metrics from your Trello board
Jan 27, 2015
This is the second part of our series of posts about setting up an information radiator. The first one was How to set up an information radiator into your office? Part 1 - Selecting the hardware.
Think your team is data-driven? The reality is that your data is not used to it's full potential if it's kept locked in the silos of various tools. Your tool is an information refrigerator.
"Information refrigerator is a place where information goes to die"
An information radiator is the opposite - it's highly visible and "radiates" information to its surroundings. Here's what we did to set up one for ourselves.
Managing agile workflow with Trello
We track our tasks with Trello. It's a Kanban board, which allows you to visually track your workflow by progressing cards from one column (or list as they're called in Trello) to another. Each list corresponds to a specific state in your workflow, and it also lets you attach supporting documentation and checklists to your tasks.
We like Trello due to its simplicity and its close resemblance to attaching physical post-it notes into a wall (a practise we do ourselves). As a developer, you want to focus on code and anything that gets on your way is a distraction, so you want a tool that takes least of your energy. Trello excels in that aspect.
Here's what our Trello board looks like
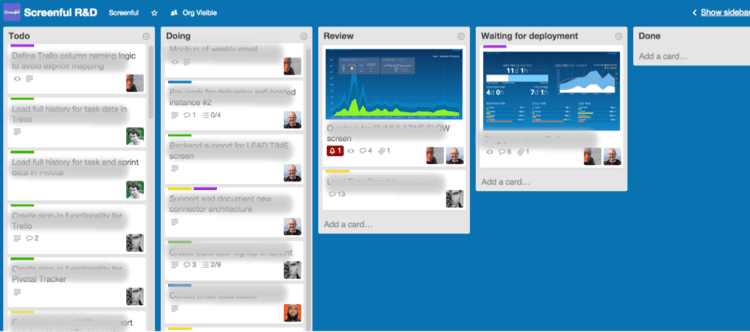
This board contains five lists representing our workflow
Todo -> Doing -> Review -> Waiting for deployment -> Done
Your workflow may look different but one of the cool features of Trello is that it's super easy to set up your lists so that it suits your specific way of working.
Here's how our workflow goes. The cards in the leftmost list represent the backlog of items to be developed. They are prioritised so that the topmost items are in highest priority. Cards progress from left to right as team gets work done by pulling a card from backlog into the Doing list, and ultimately to the Done list when the task is fully completed. In between, we have a review stage where other team members can provide feedback on the solution and suggest improvements. Often there's few iterations before the task is ready for deployment to production. As soon as a card is moved to Waiting for deployment list, it will be deployed to production.
Tracking lead and cycle times of your Trello board
So what kind of useful insights can we get from the data that is being generated? Well, let’s start with what we have. First of all, we have work items represented as cards. In addition, we have the information about their traversal on a board. Based on this data we can establish the key Kanban metrics - lead and cycle time - which help you to understand how quickly your tasks gets resolved:
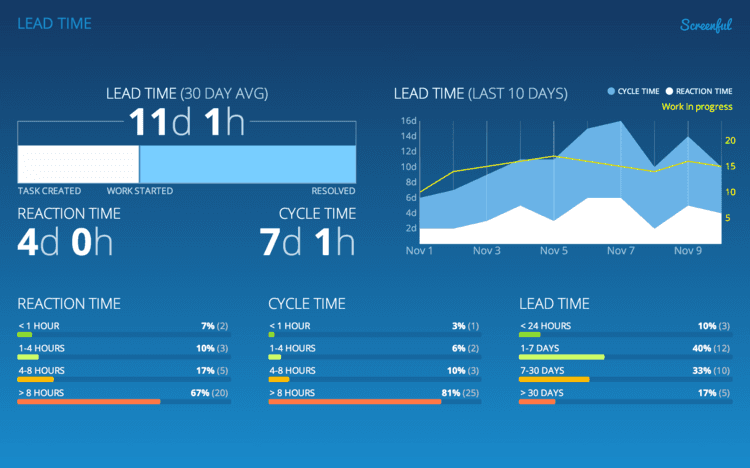
The insights that we get from these metrics:
It takes four days before we start working on a task that is added to the board (reaction time).
It takes about seven days to move a card across the board until completion (cycle time)
Our cycle time has slightly increased during the last 30 days (cycle time trend)
Average number of items in progress has slightly increased (work in progress)
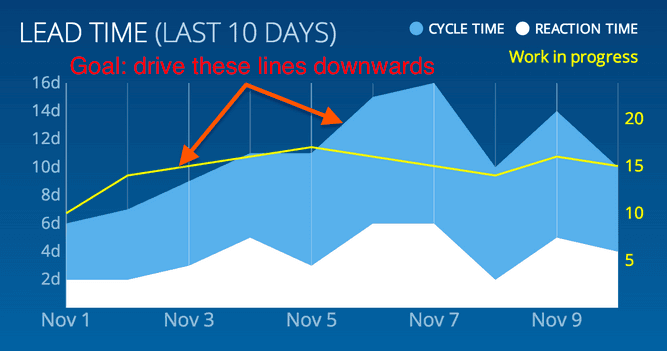
How do we interpret these numbers? As each team has unique work rhythm, there's really no thresholds for good or bad performance. What we get is a baseline for our own rhythm. For us, the most interesting metric here is the cycle time as it tells us how quickly we can deliver new features (or fix bugs).
Cycle time is the total time that elapses from the moment when the work is started on a task until its completion
That's something we want to keep eye on. In a stable system, work-in-process and cycle time are correlated so that when keeping the same pace of work, if WIP goes down, cycle time goes down as well. It's a mathematical fact. Software development is never a stable system and therefore does not strictly follow rules like that. But intuitively it makes sense - The more you multitask, the longer it takes to complete any individual task.
Our goal is to reduce our cycle time by having fewer tasks in progress at the same time. Now that we know our baseline, we can easily see whether we're making progress.
Improvement in cycle time means we can introduce new features to our users faster. That means being more agile. We always try to work on the most important task and deliver it as quickly as possible. At the same time, we seek to eliminate the inventory of partly completed work.
To help us succeed, we keep our key metrics constantly visible on an information radiator. Why keep data hidden inside your tools when you can use it to communicate the stuff that matters?
Let us know if you have questions or feedback by contacting hello@screenful.com. To stay on the loop, read our blog, or follow us on LinkedIn.