Setting up an information radiator - Part 3 - Agile forecasting with Trello
Mar 2, 2015
This is the third part of our series of posts about setting up an information radiator. The previous post were
Setting up an information radiator - Part 1 - Selecting the hardware
Setting up an information radiator - Part 2 - Tracking metrics from your Trello board
When you’re agile, you’re not supposed to plan much in advance, right? You progress one iteration at a time and take the learnings and adjust based on feedback. You keep your backlog as small as possible so that you can focus on things that are most important right now. Anything else, you disregard.
So is agile forecasting an oxymoron? While it’s true that agile projects can’t be estimated the way it was done in waterfall methods (rather unsuccessfully though), but that doesn’t mean they can’t be managed at all. It’s just that agile projects require less up-front planning.
In this blog I'll share how we do planning and forecasting in a data-driven way without any need for estimations.
We really like the iterative process, and how it enables fast feedback, but it seems like it’s lacking the ability to forecast the delivery of features. How are people currently doing this?"
That question gets often asked by the teams who are making their transition to agile. If you don’t follow a rigid plan, then how do you know how much is completed and how much is there still to do?
Release forecasting using a burnup chart
One way to track your project progress is by using a release burnup chart. It provides a graphical representation of how work progresses over time. In a burnup chart, the timeline is shown on the horizontal axis and the work completed on the vertical axis. Here’s an example
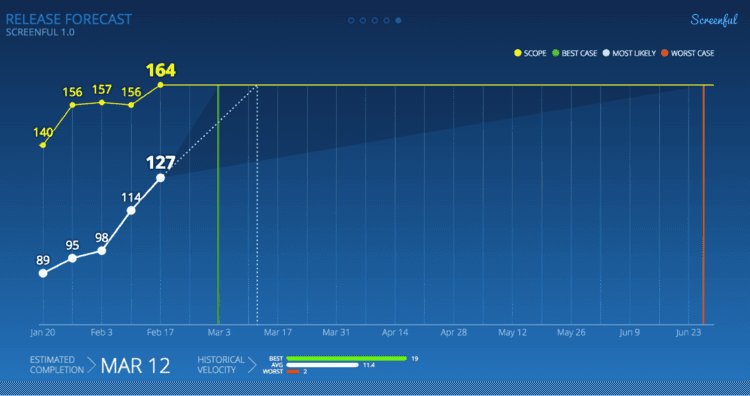
The work completed, represented by the thick white line, shows the amount of work completed so far. The yellow line shows the total scope of work. The gap between the lines represents the remaining work.
As the work progresses, new points are added to the right for both lines. At the starting point, the yellow line shows the initial scope of work. The line goes up when new work is added to the scope, and it goes down if work is removed.
Likewise, the white line goes up whenever work gets completed. If there’s no progress, it remains unchanged and the line becomes flat. This way, the chart keeps track of any changes to the amount of work left to complete the project. Ideally, the white line ultimately reaches the yellow line when all the tasks are completed.
Seeing these two lines help you to stay on track how much is completed vs still to do. But what’s really cool about this chart is that it can give you an estimate of the completion date of all cards in the board. It’s represented by the dotted line that starts at the point showing the current amount of work completed and ends at some point of time in the future. That’s the most likely completion date based on your past velocity. Two more lines, green and red, are shown to represent the best and worst case scenarios. Together these lines form a "landing area" for you project completion.
How are these dates calculated?
To understand the logic behind these lines you need to look at the bottom of the chart:
This is your team’s velocity during the last 8 weeks. During this period, your highest velocity was 19 tasks completed and the lowest was 2. On average, you’ve completed 11.4 tasks per week.
How does that relate to your Trello board? Here's an example board
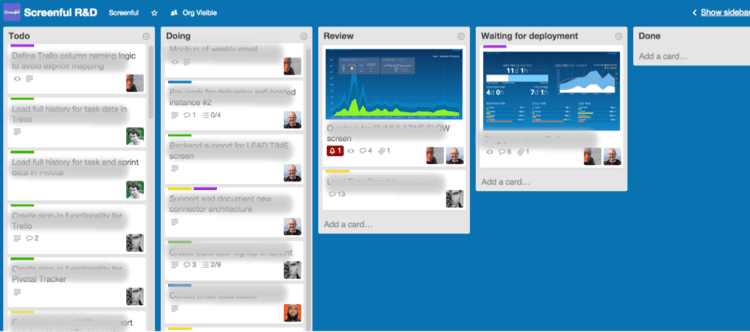
The board represents the total scope of work. Once all the cards are moved into the Done list, all work is done (though you may never reach that point if new cards are added along the way). Therefore, the the total scope in the release forecast chart (the yellow line) is the same as the total number of cards in your board.
In the release burnup chart, there were a total of 127 units of work done. That's the amount of cards in the Done-list (not all of them are visible as cards are archived soon after they're moved to Done-list).
The difference between total scope and work done is your remaining work. That's the cards that are either in Todo, Doing, Review, or in Waiting for deployment list.
The figure below illustrates the scope, work done, and the remaining work in a Trello board:
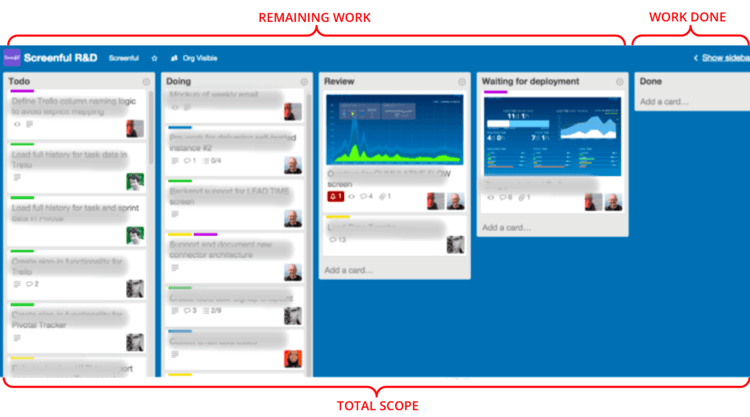
A kanban board like Trello allows you to visualise how work gets done. It gives you a good picture of what is currently being worked on. However, what Trello doesn't provide is the ability to forecast the future.
Based on my velocity so far, how long is it likely going to take to get all the cards moved to the Done list?
Taking the data we have, and applying some simple mathematics, we should be able to answer that question. Let's take a look at the release burnup chart again:

Work done equals to the number of cards in the Done list in your Trello board. Total scope is the total number of cards in the board. Remaining work is all the cards minus the ones in the Done list. That's straightforward.
But what's interesting is the Remaining time. It's calculated based on the remaining work and your team's past valocity. That's the time it takes to move all the cards to the Done list. Or at least the best estimate of it.
But should’t I have estimates for the tasks? What if my tasks are of different size?
While it's advisable to size your tasks so that they're small, say, maximum one day of work, occasionally some tasks may end up consuming much more time than anticipated. That's normal and happens to everyone, it's ok.
Statistically, in the long run, they'll be the same size on average.
Your remaining 20 tasks will likely be of same size on average as your past 20 tasks. Therefore, not having estimations in place doesn't mean you can't get a useful forecast.
Manage expectations early on
Never mind if your forecast is not 100% accurate. It can never be. But now you have at least some idea when the work will be completed. That’s better than nothing, right? Now go and share that information with other stakeholders - your team, your boss, even with your customers. Sounds scary? It’s always better to manage expectations early on than having to adjust them when unrealistic expectations meet with reality at a later stage and the s**t has already hit the fan. We’ve all seen it happen.
Let us know if you have questions or feedback by contacting hello@screenful.com. To stay on the loop, read our blog, or follow us on LinkedIn.