Instant productivity insights, out-of-the-box
Instant productivity insights, out-of-the-box
Instant productivity insights, out-of-the-box
Track productivity, visualize trends, and spot bottlenecks in your workflow with data-driven insights from your tasks data.


Open items
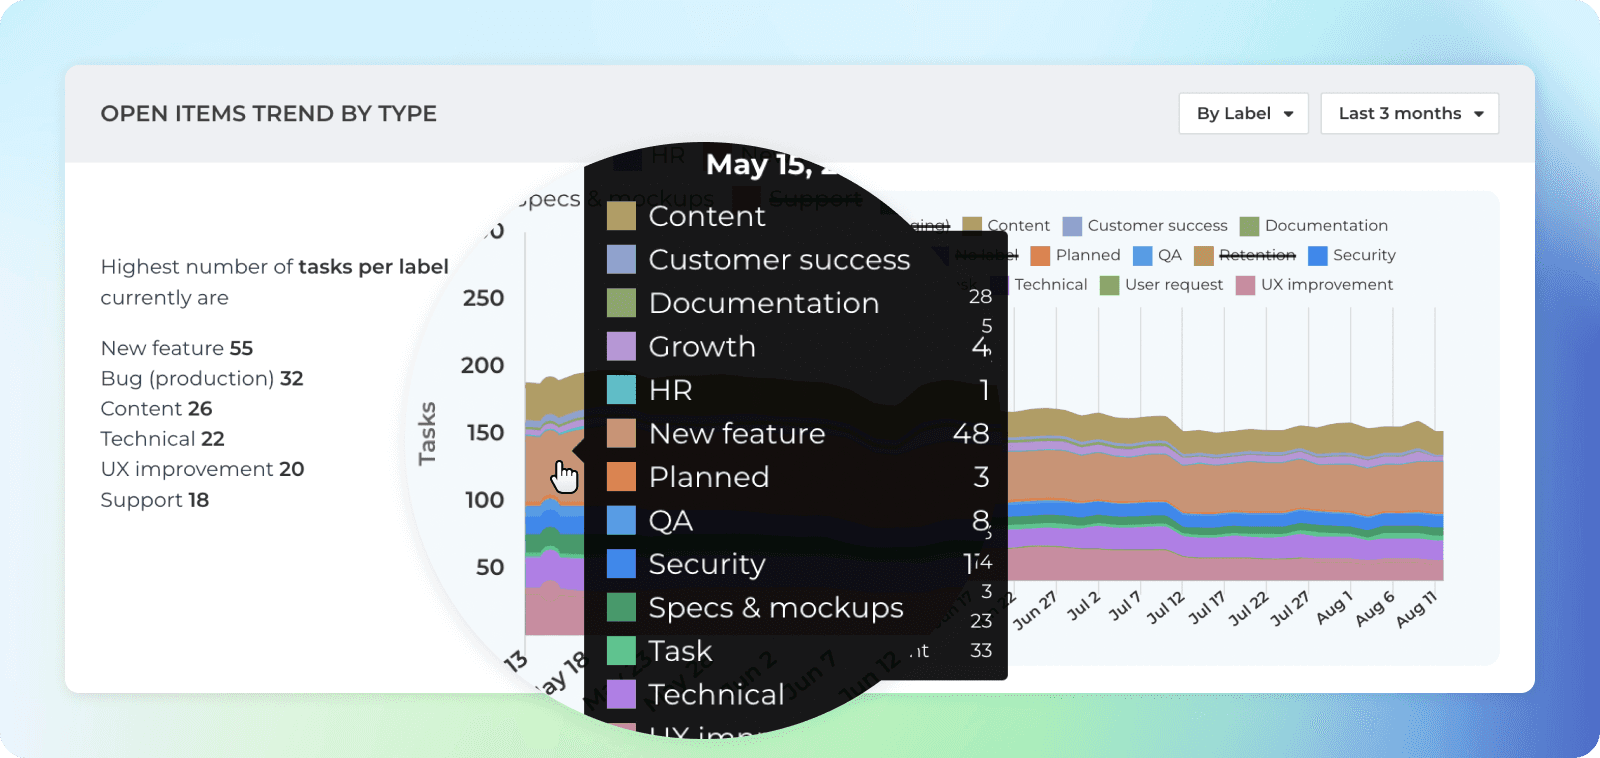
Track the amount of unfinished work in your projects and how that changes as your work progresses.
Use the filter to narrow down to any subset of tasks. Click through to see the list of tasks behind the numbers.
Track the amount of unfinished work in your projects and how that changes as your work progresses.
Use the filter to narrow down to any subset of tasks. Click through to see the list of tasks behind the numbers.


Completed work
See the latest completed tasks and how much work was completed per week, month, or quarter.
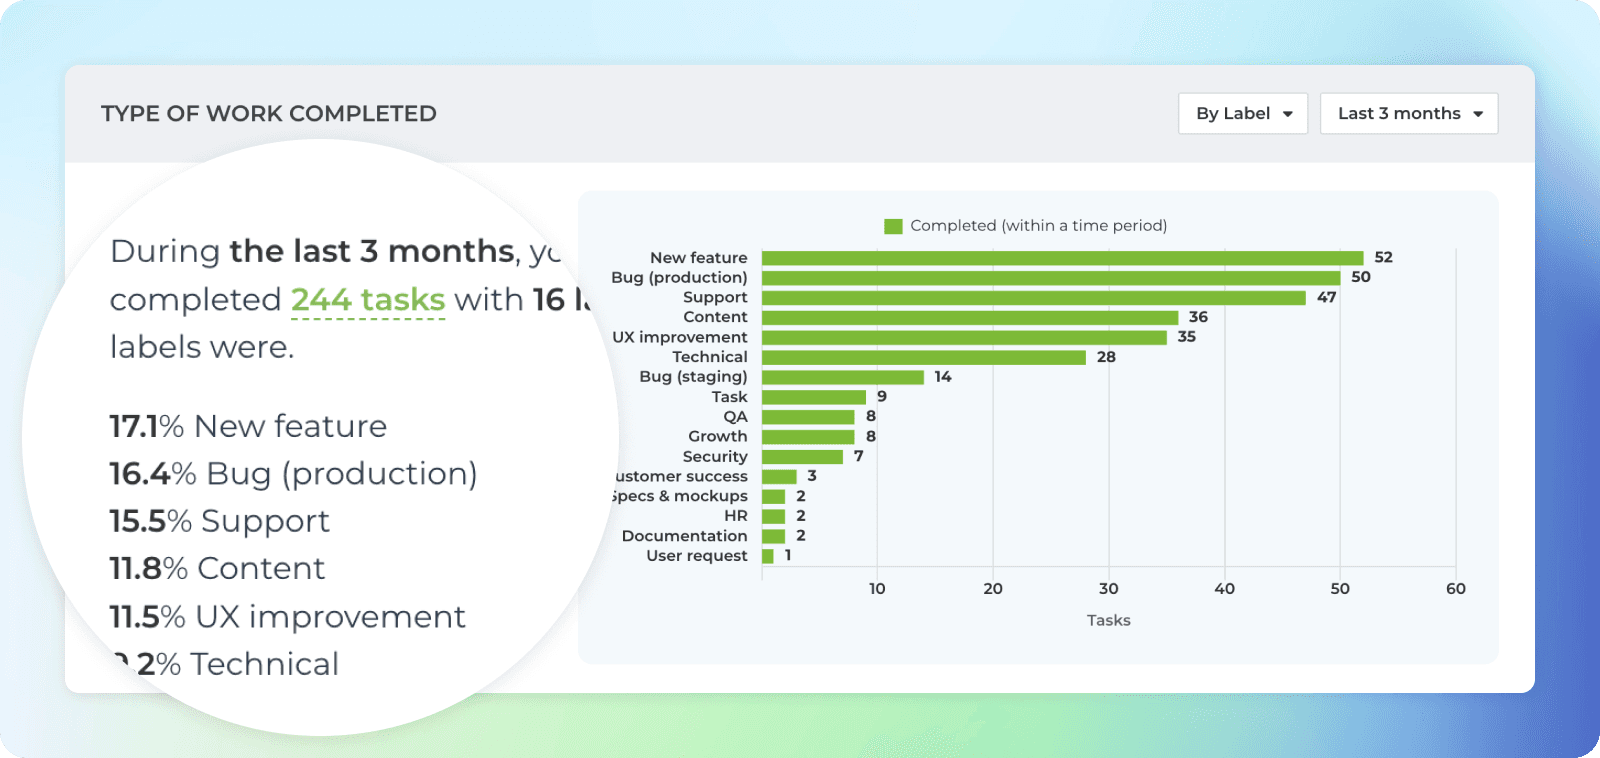
See the distribution of the completed tasks by task type so that you can see trends and can start eliminating wasteful activities.
See the latest completed tasks and how much work was completed per week, month, or quarter.
See the distribution of the completed tasks by task type so that you can see trends and can start eliminating wasteful activities.


Timings
See how long it takes to complete a task on average. Track your lead, reaction, and cycle times. See how long tasks stay in each workflow state.
Find the bottlenecks in your process to pinpoint areas for improvement.
See how long it takes to complete a task on average. Track your lead, reaction, and cycle times. See how long tasks stay in each workflow state.
Find the bottlenecks in your process to pinpoint areas for improvement.


Forecasts
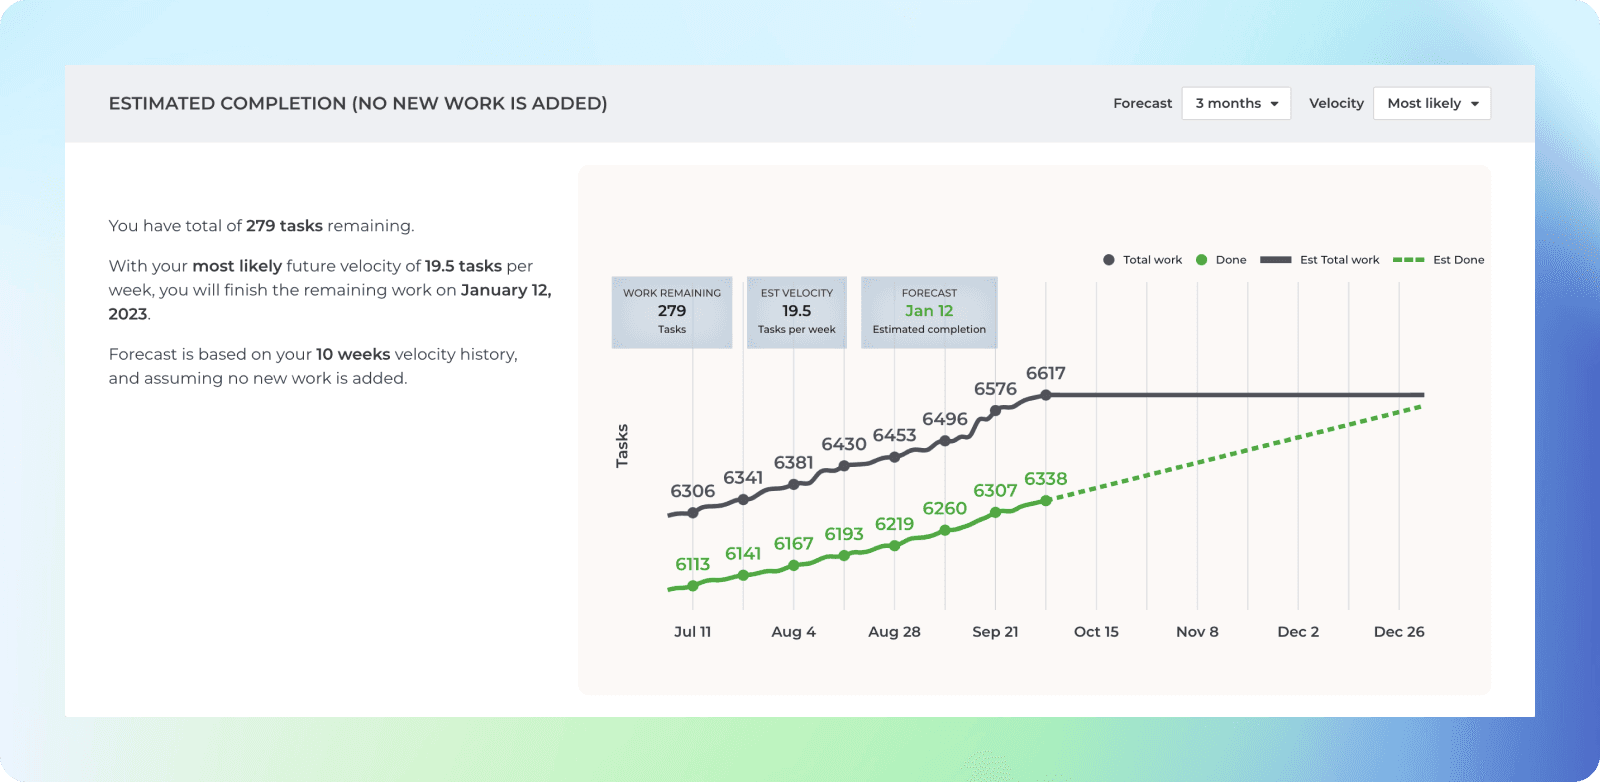
Get data-driven forecasts for the completion of any work scope, such as a customer project or a product release.
Forecasts are based on your team’s historical velocity. The chart looks at how much work was completed in the past and creates three scenarios: likely, optimistic, and pessimistic.
Get data-driven forecasts for the completion of any work scope, such as a customer project or a product release.
Forecasts are based on your team’s historical velocity. The chart looks at how much work was completed in the past and creates three scenarios: likely, optimistic, and pessimistic.

