Scatter Plot Screen
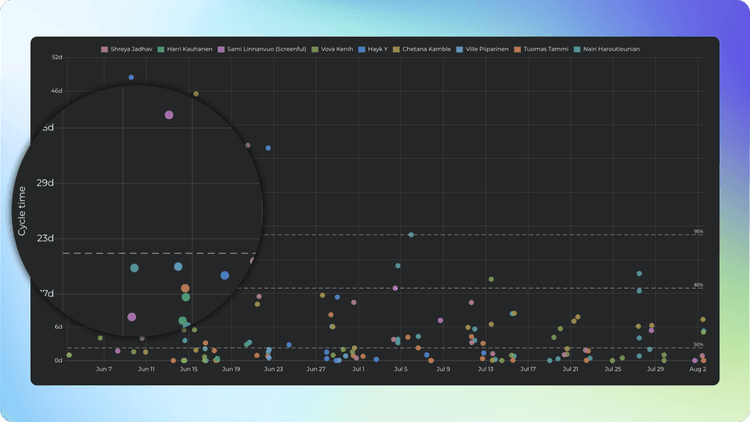
The Scatter plot chart tells how long it takes to work on individual tasks. It shows the cycle time of each task, mapped on a timeline. Only completed tasks are included in this chart.

TRACK YOUR CYCLE TIMES
Each data point in the chart corresponds to an individual task. Thе chart shows when tasks have been completed and how long it took to complete them. The horizontal axis shows the observed date range, the vertical axis shows the cycle time in days. The higher up the circle, the longer it took to complete the task.