Introducing Analytics & Reports for Linear
Introducing Analytics & Reports for Linear
Mar 22, 2024

We are happy to inform you that we now support Linear in our analytics. You can import Linear data sources and use them in your charts and reports. Learn more at screenful.com/linear.
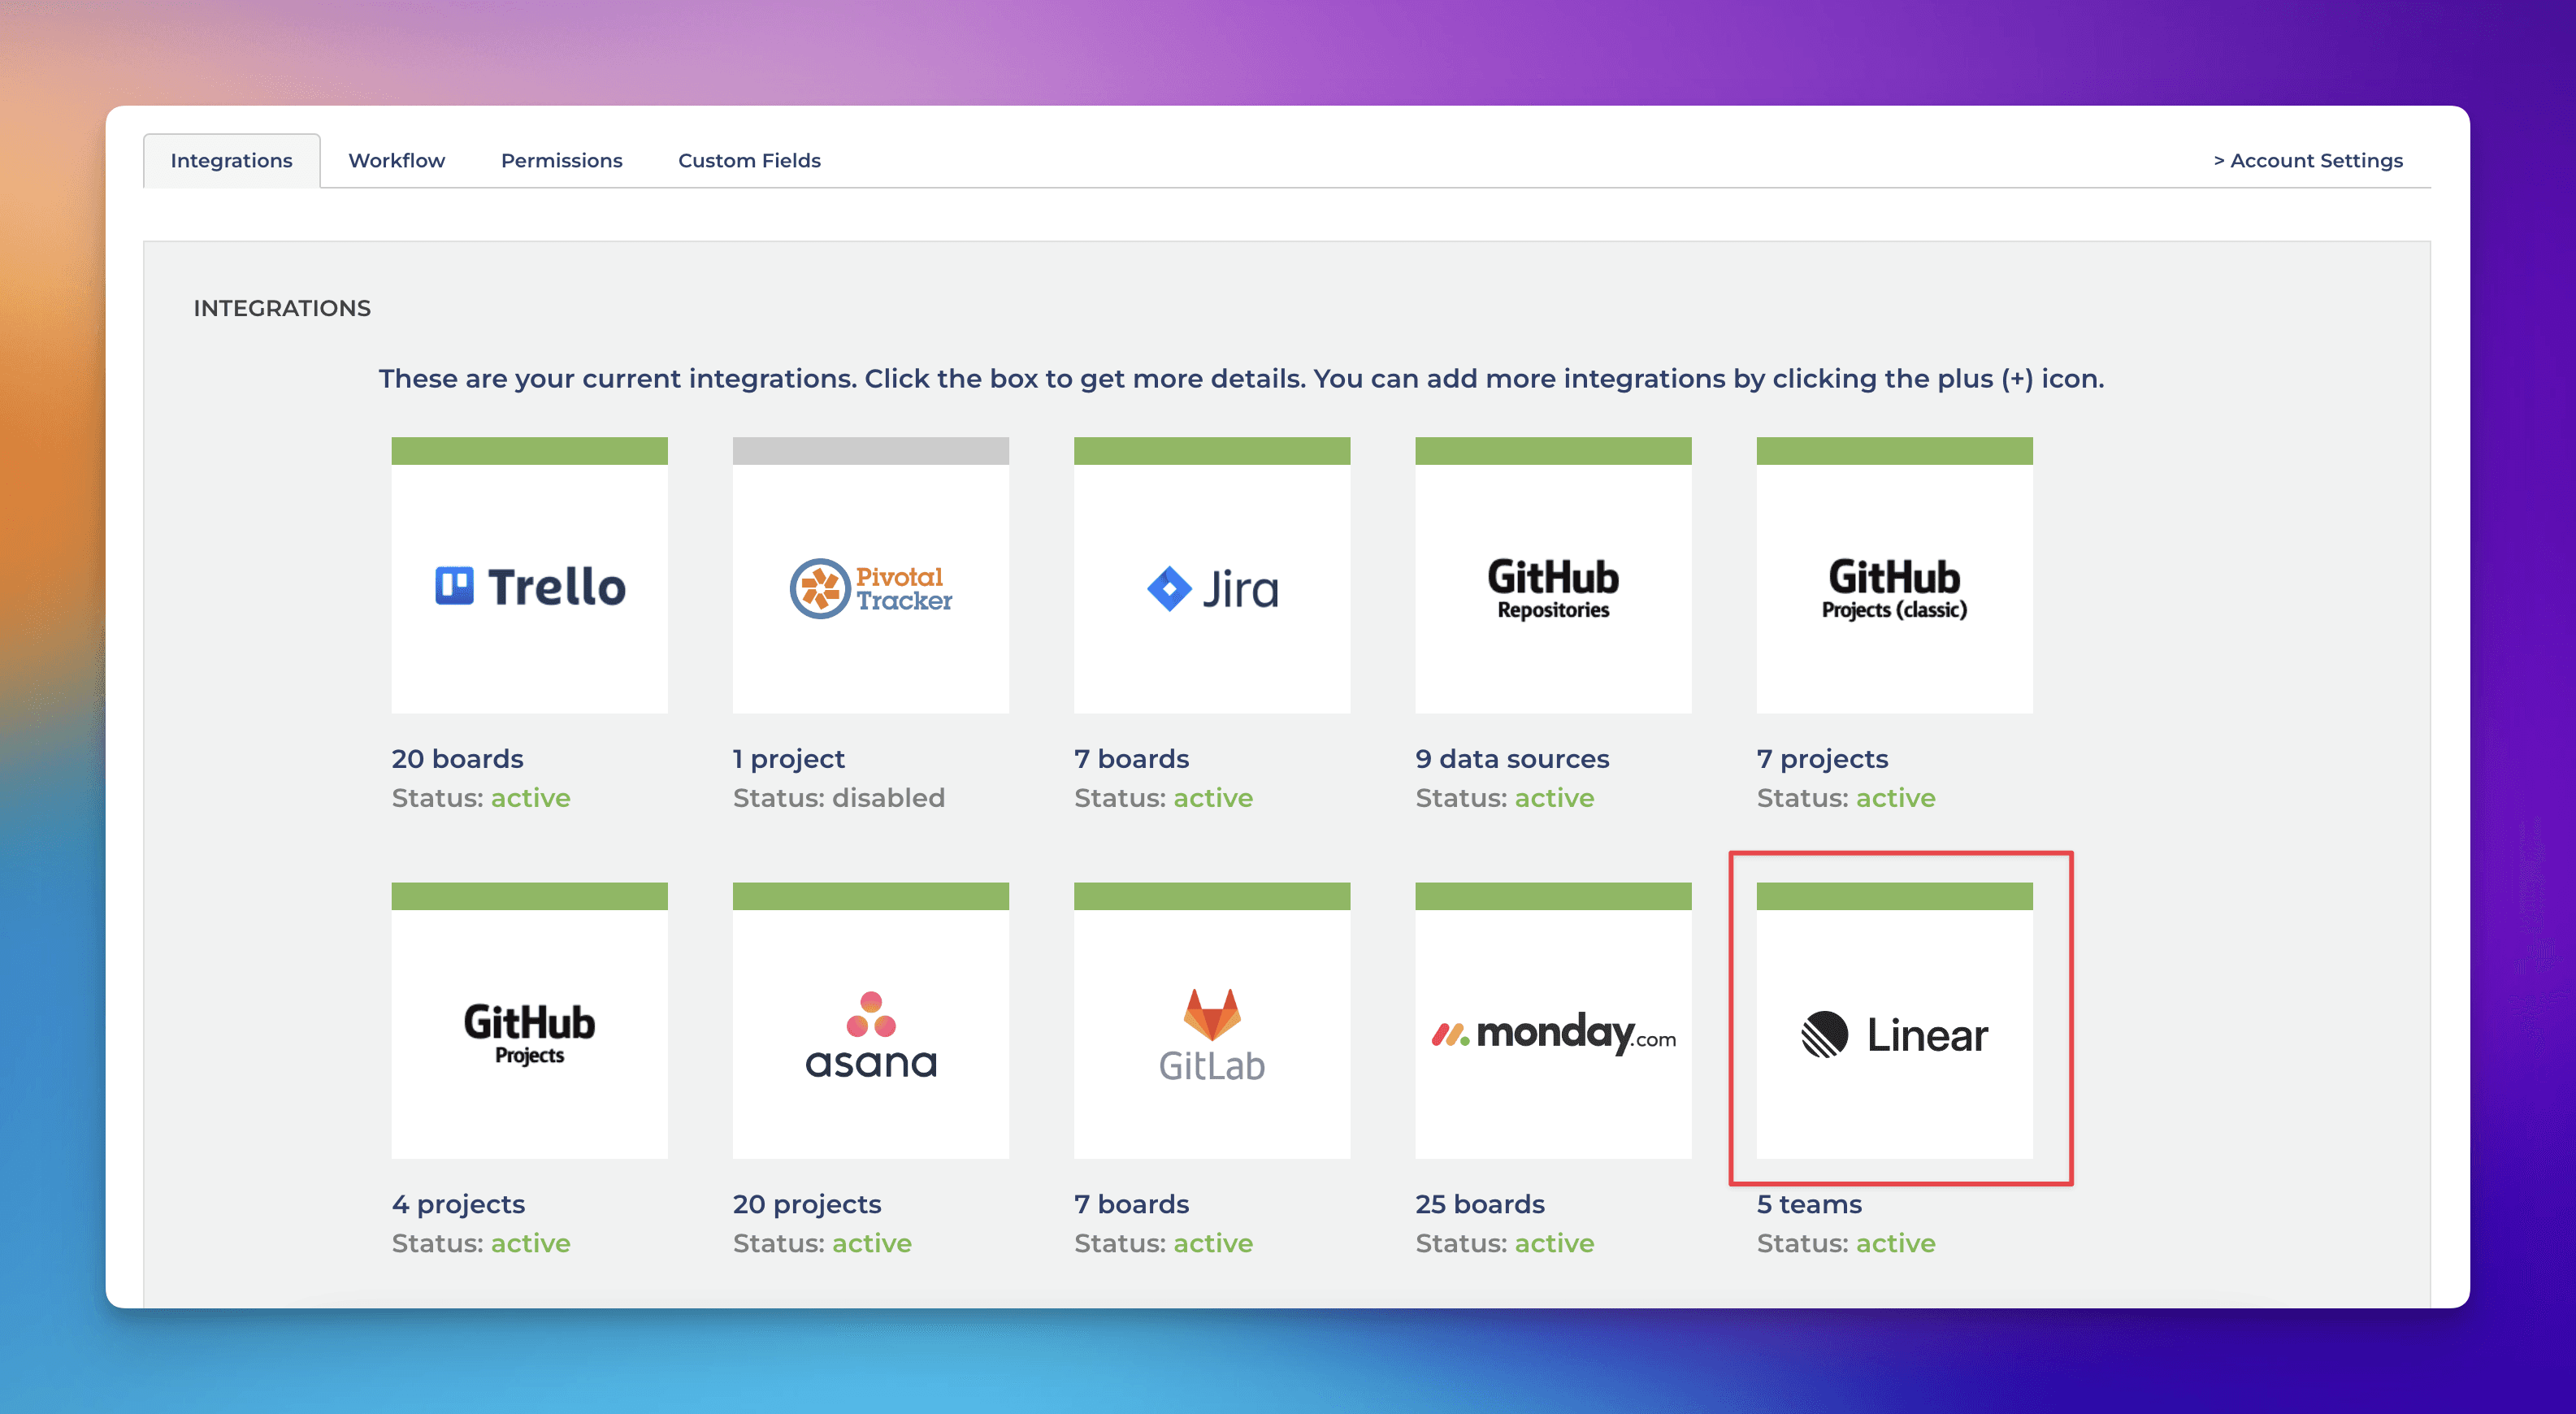
To create a data source from a Linear project, select Add new data source from the main menu. Then select Linear from the available options:
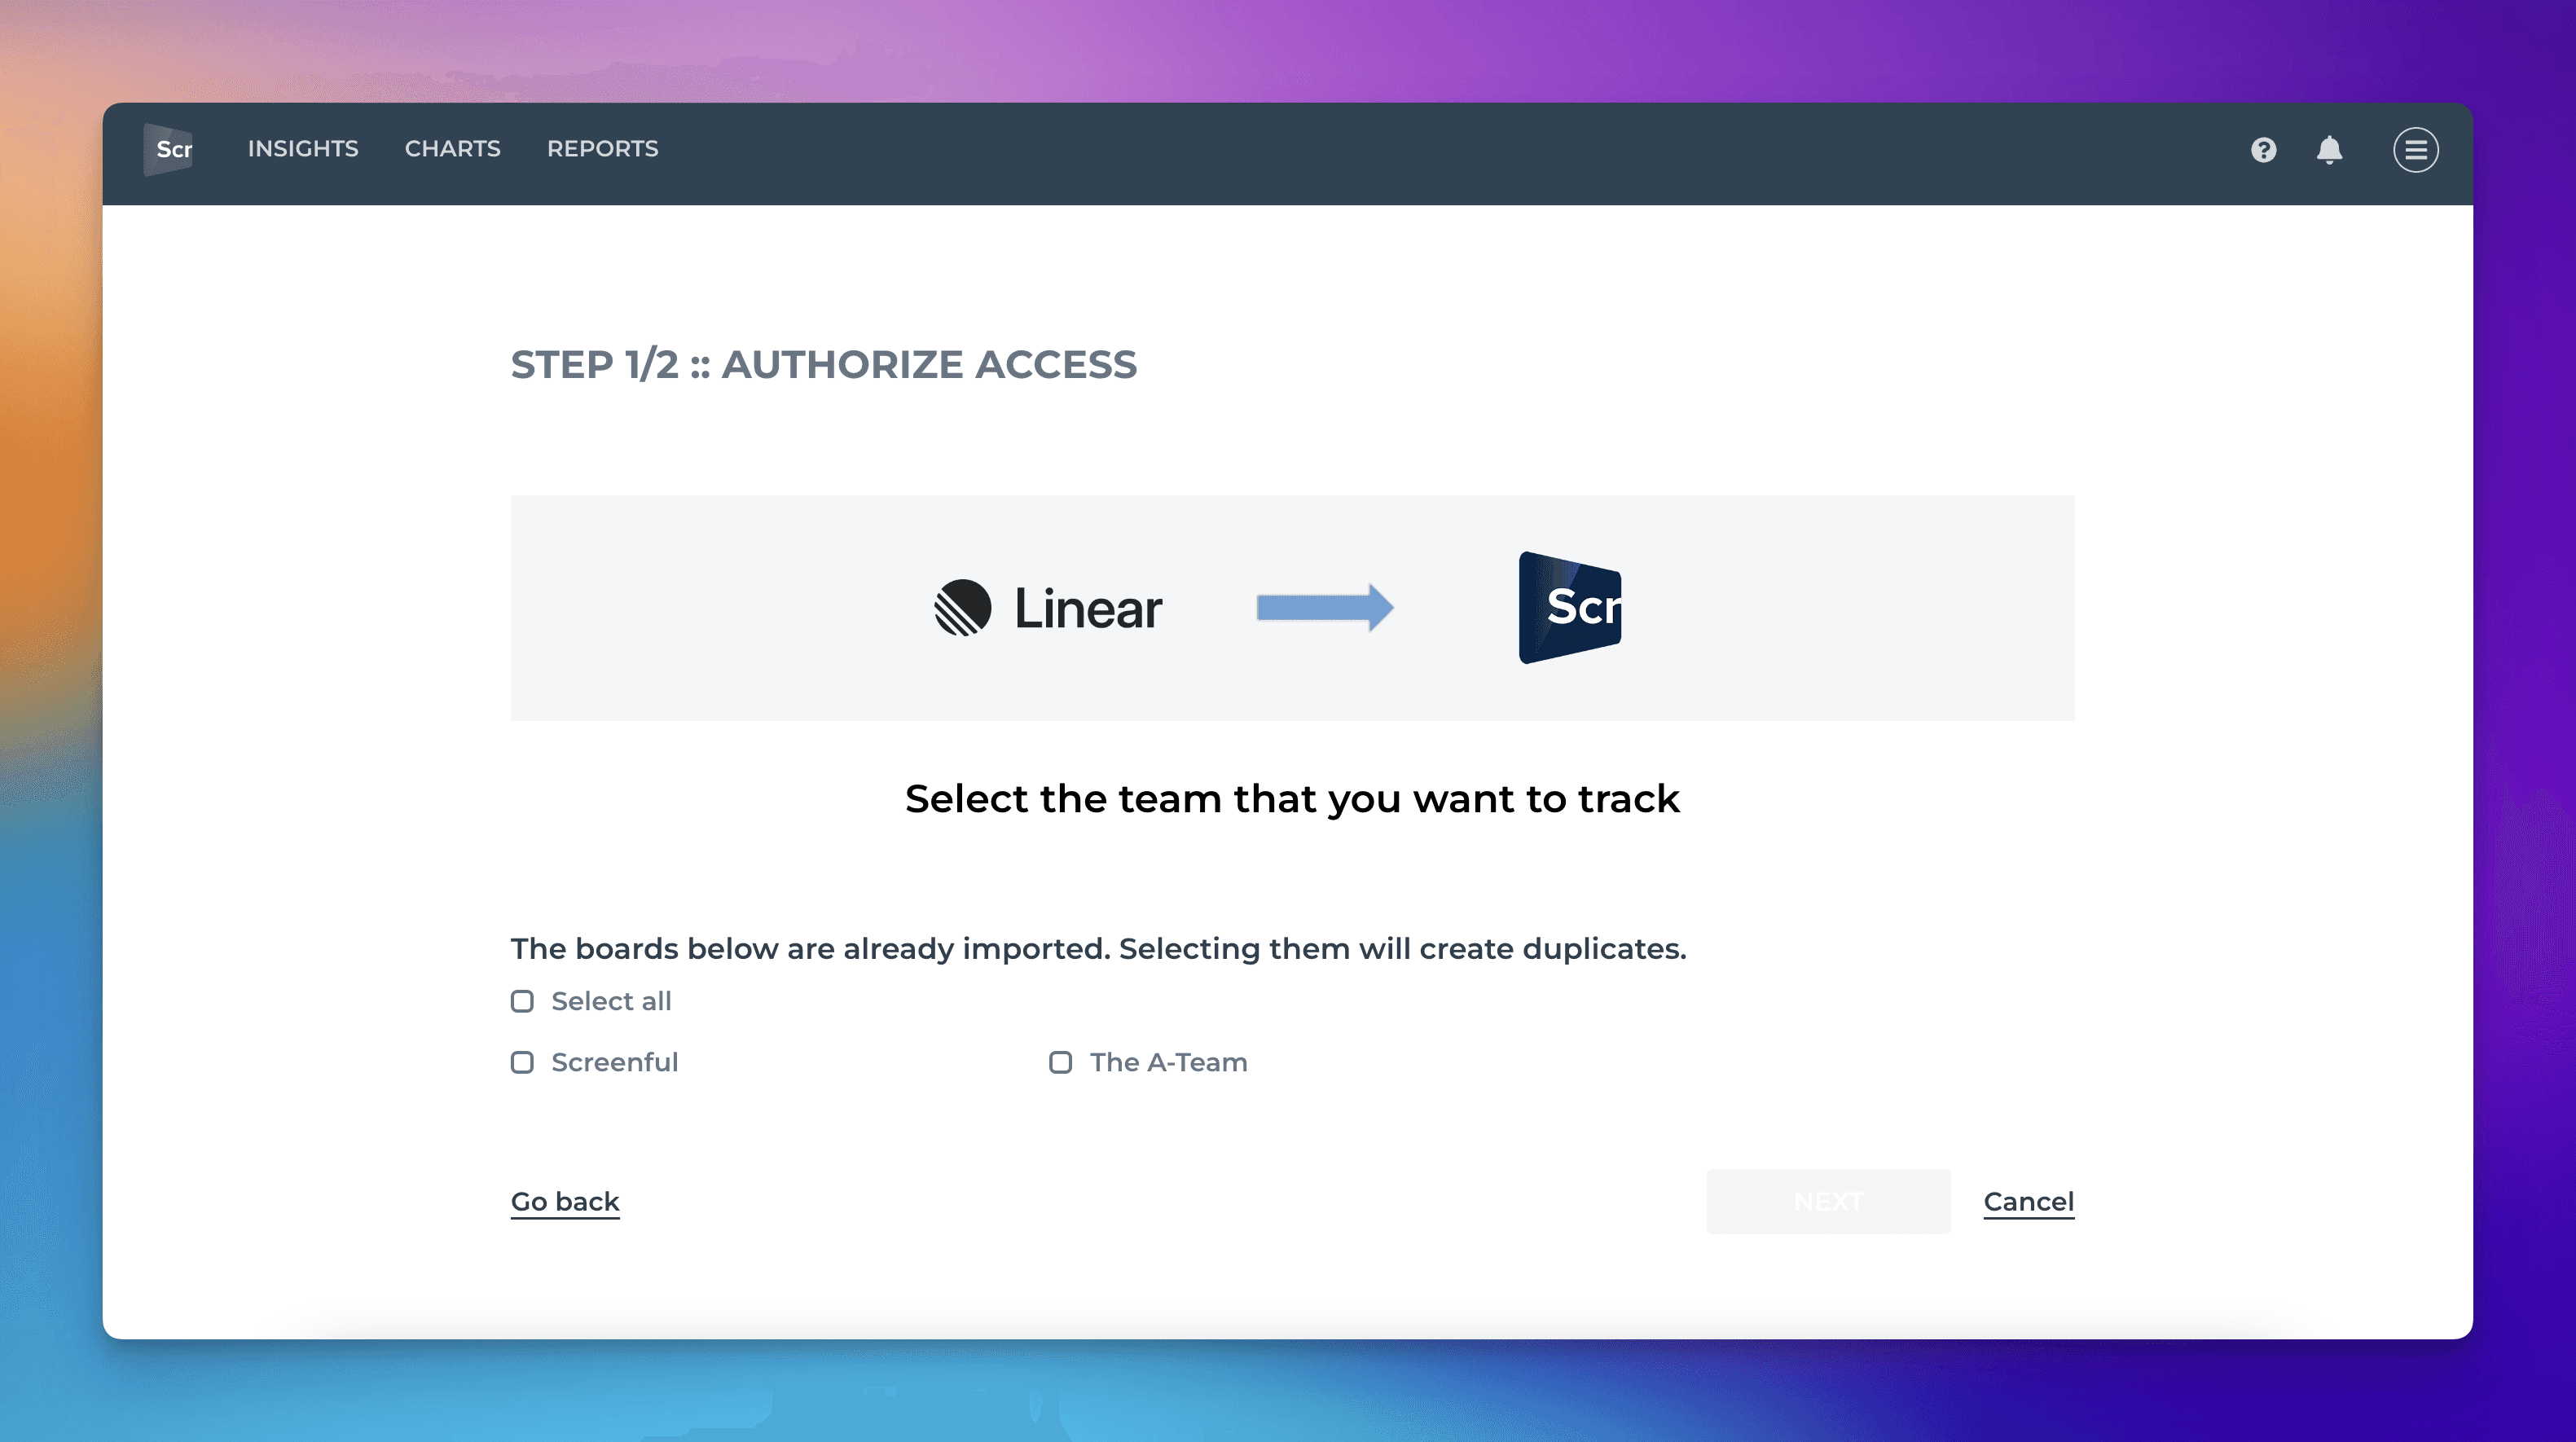
Once you have authorized access to the Linear API, you’ll be shown a list of teams in your account.
Once you have selected one or more boards for importing, you will be shown a suggested workflow mapping. The columns on your board are automatically mapped to either Not started, In progress, or Done. This information is used when calculating the Timing metrics.
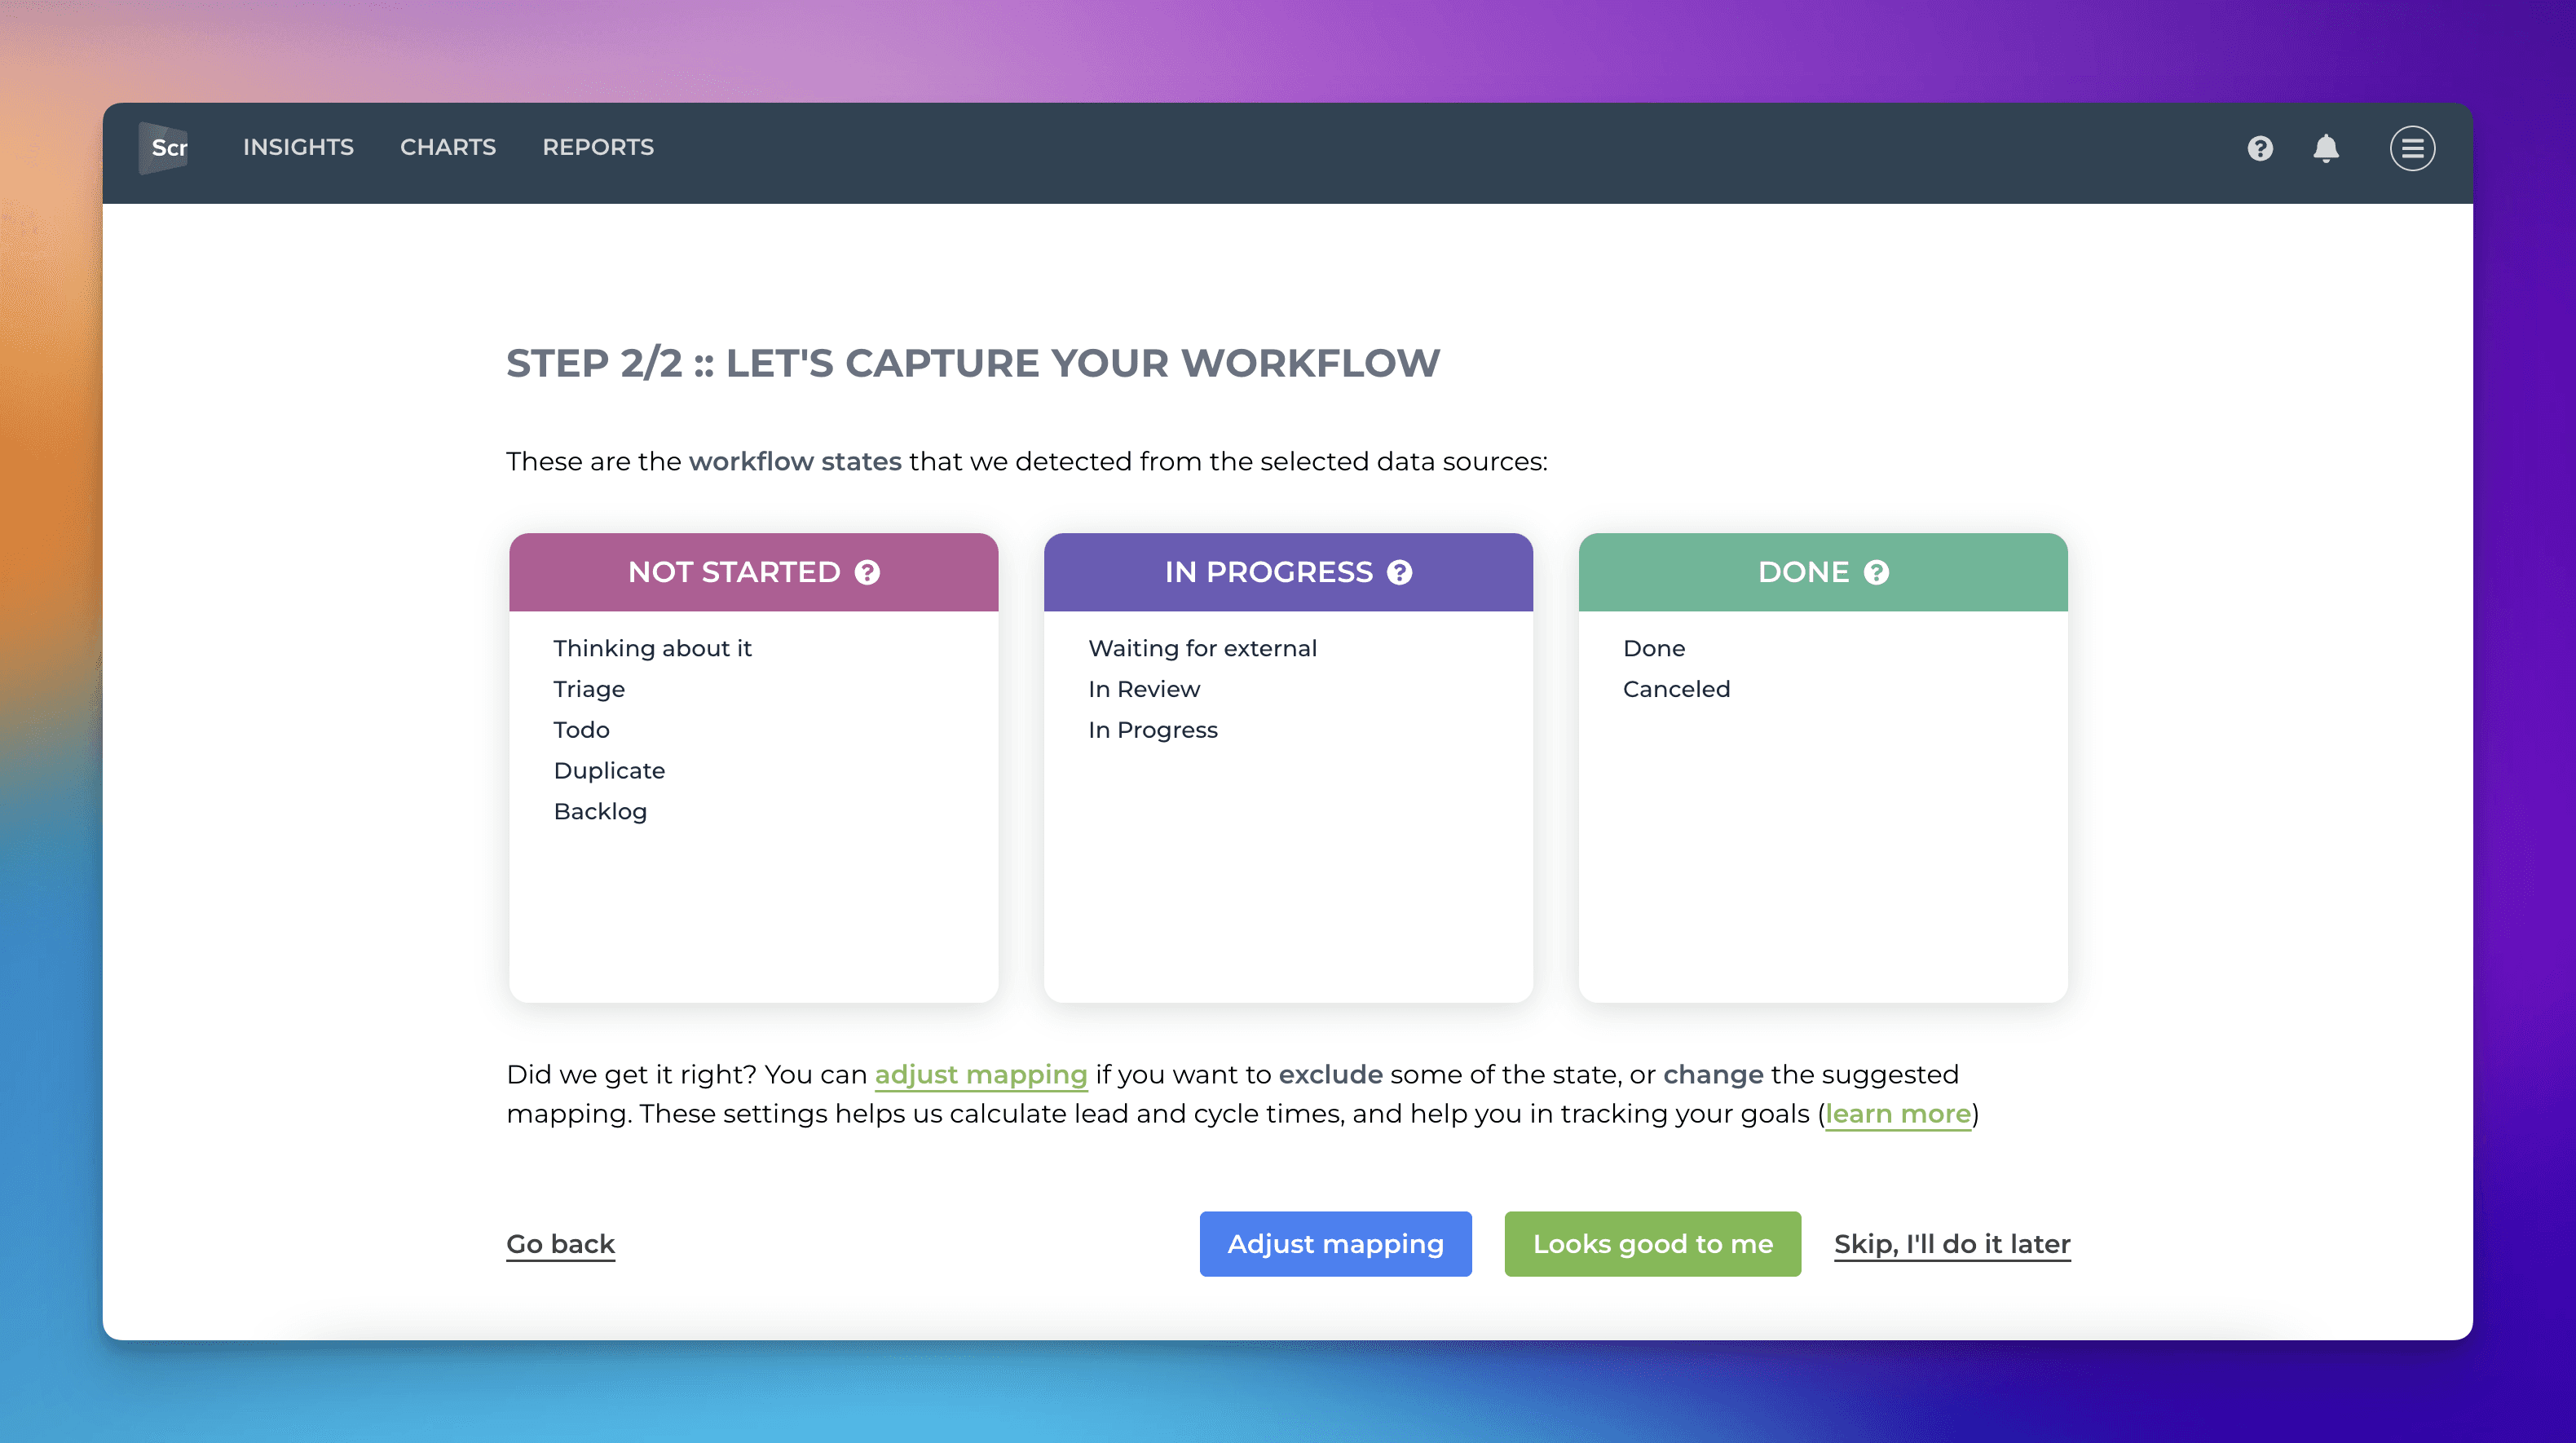
If the suggested mapping looks correct, you can accept it by clicking Looks good to me. You can make changes by clicking Adjust mapping. The boxes become editable, and you can drag & drop items between them.
Your setup is now complete. You can navigate to the Insights tab to see the automatically generated charts and metrics. For more instructions, see the Setup Guide.
We are happy to inform you that we now support Linear in our analytics. You can import Linear data sources and use them in your charts and reports. Learn more at screenful.com/linear.
To create a data source from a Linear project, select Add new data source from the main menu. Then select Linear from the available options:
Once you have authorized access to the Linear API, you’ll be shown a list of teams in your account.
Once you have selected one or more boards for importing, you will be shown a suggested workflow mapping. The columns on your board are automatically mapped to either Not started, In progress, or Done. This information is used when calculating the Timing metrics.
If the suggested mapping looks correct, you can accept it by clicking Looks good to me. You can make changes by clicking Adjust mapping. The boxes become editable, and you can drag & drop items between them.
Your setup is now complete. You can navigate to the Insights tab to see the automatically generated charts and metrics. For more instructions, see the Setup Guide.
That’s it for this release. As always, we’d love to hear from you. Please do not hesitate to contact us anytime if you have questions or feedback.
To give it a try with your own data, sign up for a free 14-day trial
Also, check out recent product updates and follow us on Twitter or Facebook.