Gain birds-eye view across your boards with epics 🦅
Gain birds-eye view across your boards with epics 🦅
Apr 30, 2020
We have made improvements to the Epics screen and wanted to provide an update of all the things you can do with epics in Screenful. Epics are a great way to organise your individual tasks into larger bodies of work. An epic is essentially a large task (or user story) that can be broken down into a number of smaller tasks or stories. The main benefit in the use of epics in your product development process is that allows you can plan your work in bigger chunks than just individual tasks.
What’s new?
Quick menu for browsing epics
Charts integrated with the Epics screen
New sorting options
These features are immediately available for Jira, Trello, and Pivotal Tracker. Read on to learn more about these improvements or start a free trial to give it a try with your own data.
Quick menu for browsing epics
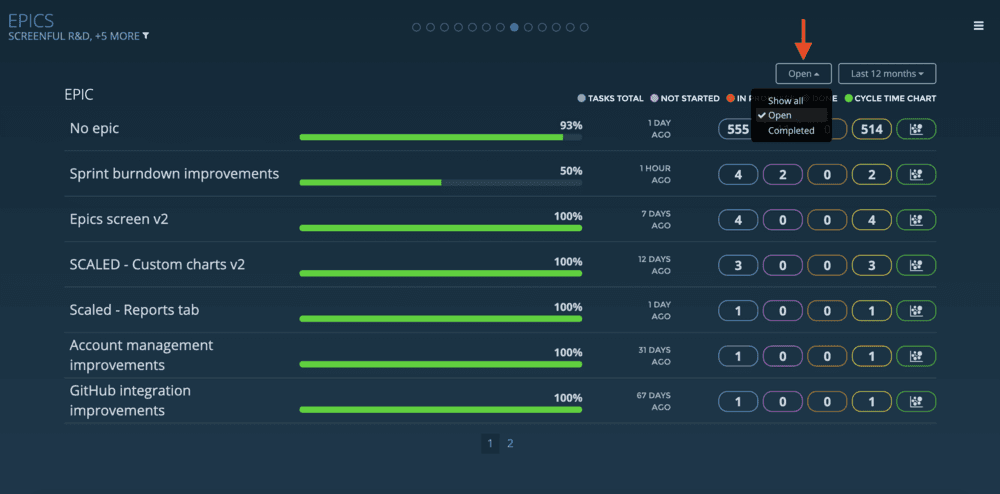
You can now filter the epic list by the epic status. By default, all epics are shown but you can change it to show either the Open or Completed epics.
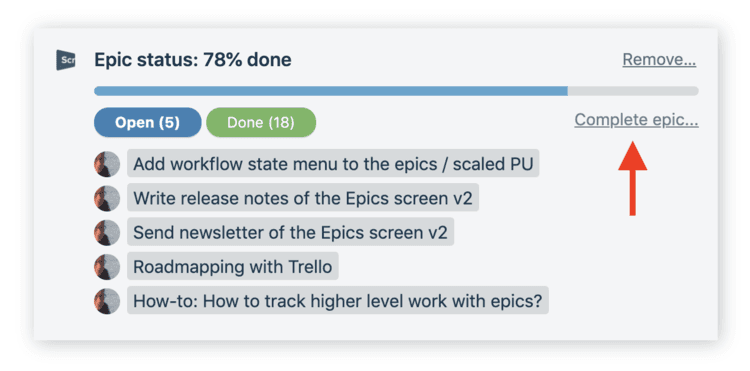
If you’re using the Epics Cards Power-Up, you’ll find the link for completing an epic within the epic card:
The date range menu can also be used for filtering the list since only the epics with activity within the selected date range are included in the list. For example, When Last 2 months is selected as the date range, the list contains the epics which has the the most recent activity within that range:
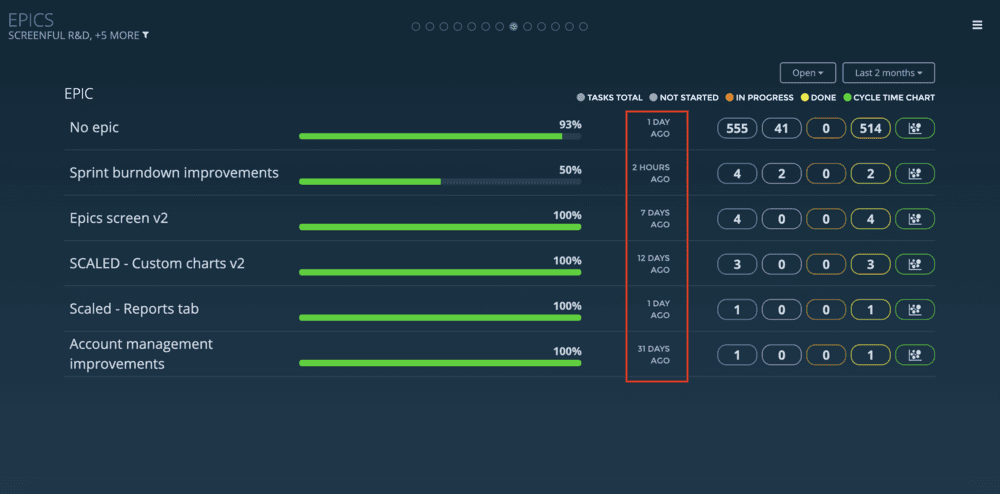
That allows you to focus the list on the currently active epics, or the most recently completed epics while hiding those that don’t have any activity recently.
You can now have charts integrated with the Epics screen
The Epics screen has now an option to show a link epic specific chart in the right column. So for each of your epics, you can see the chart of your choice filtered with that epic. Currently supported charts are the Cumulative flow chart and the Cycle time chart.
You can see the cumulative progress of an epic by selecting Cumulative flow as one of the columns
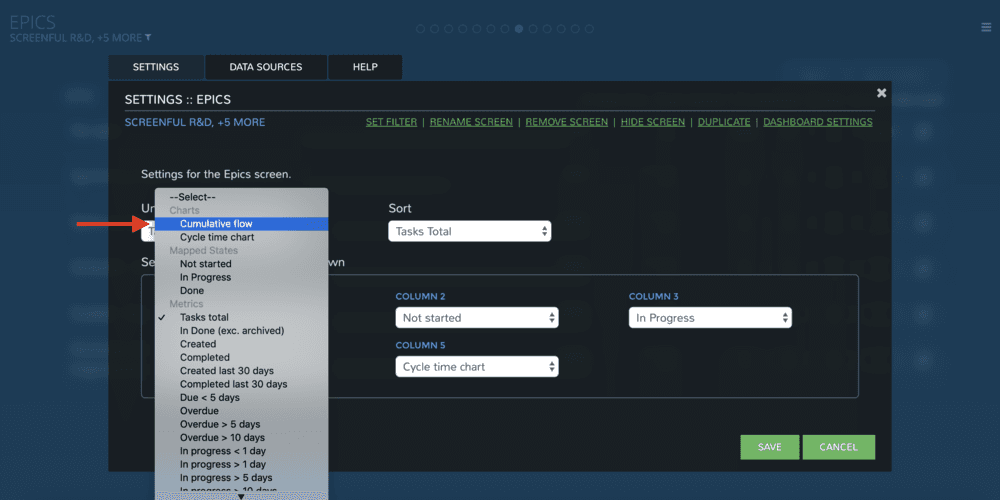
Once you click Save, the new column is added to the Epics screen:
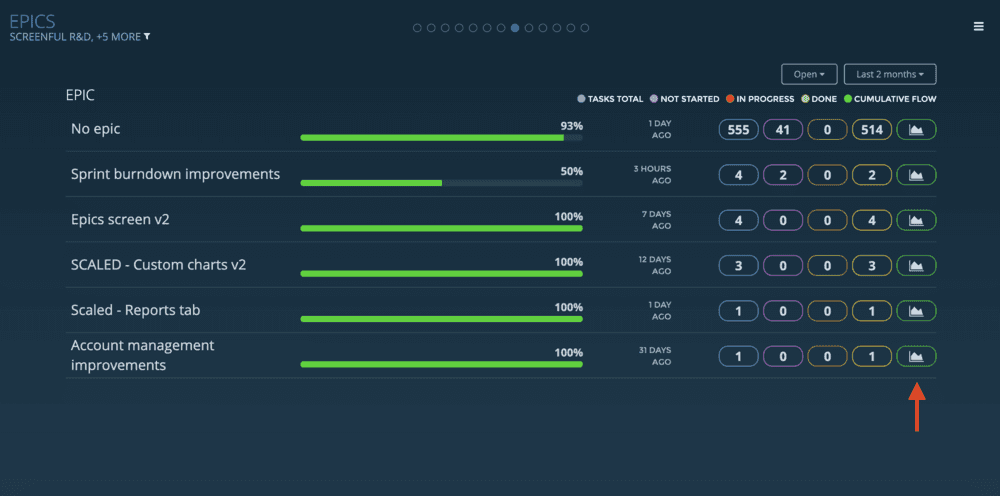
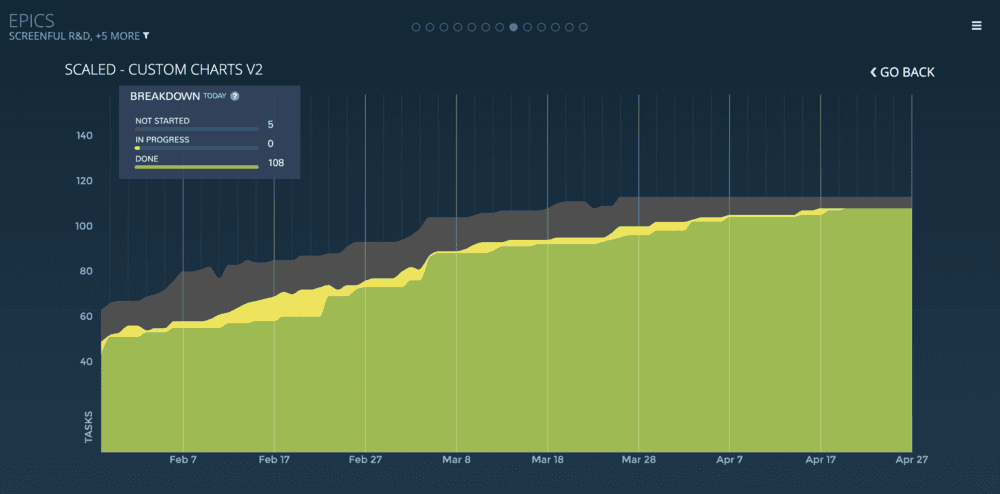
Clicking the chart icon shows the cumulative flow for that epic:
You can also enable the cycle time chart, which shows a scatter plot the completion times of individual tasks assigned to that epic:
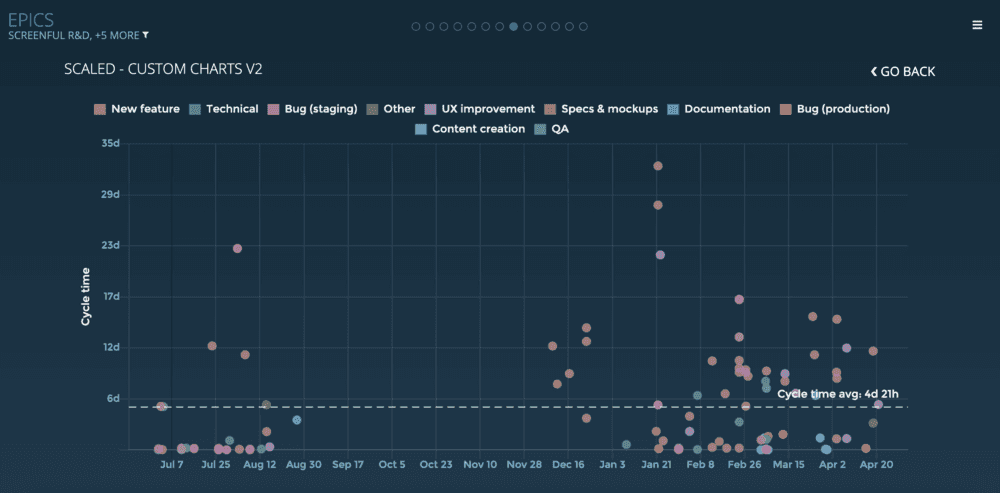
Hovering the mouse over a circle shows the name of the task and the cycle time:
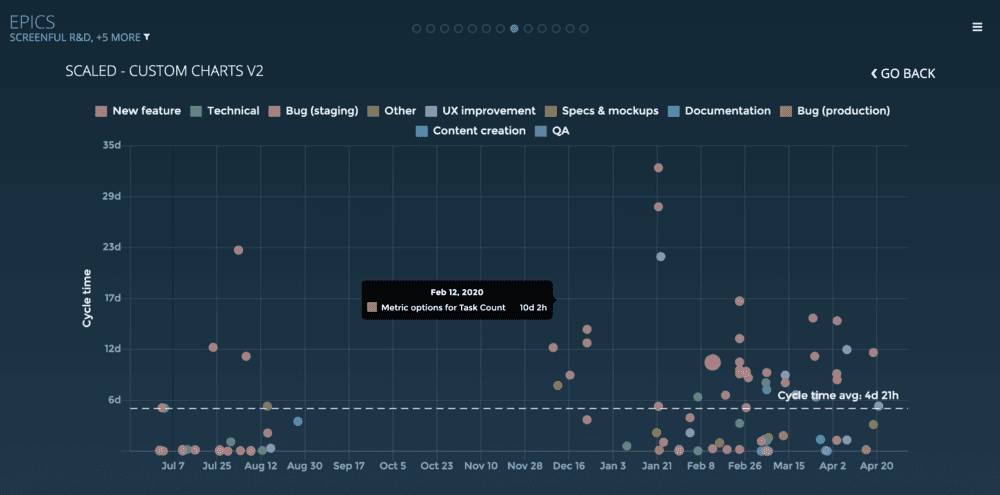
This chart helps you to find outliers in your data as it shows how long it took to complete any individual task assigned to an epic. Do certain types of tasks take longer than average to complete? Which tasks were fastest or slowest to complete? Can you find any patterns that helps you to streamline the flow of tasks?
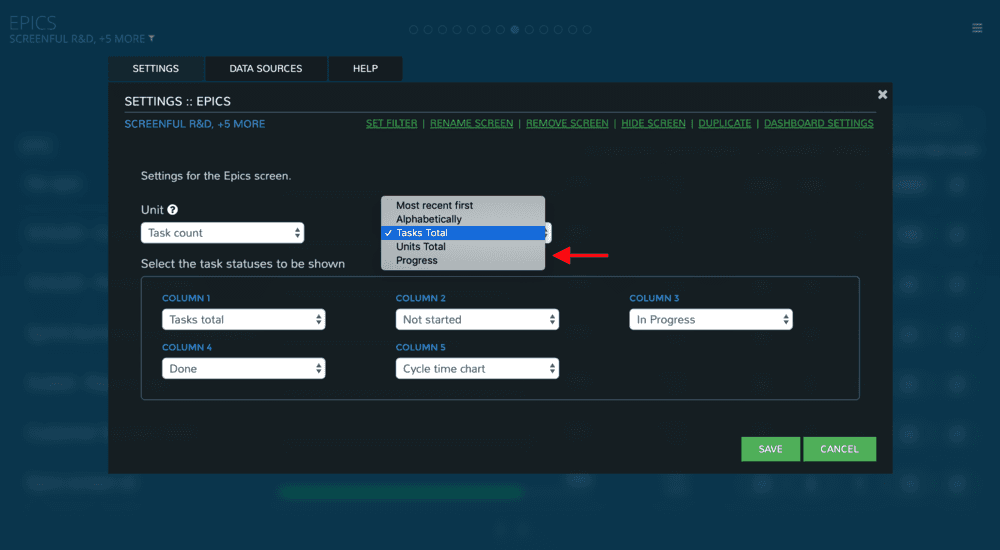
New sorting options
We’ve also added some new sorting options. In addition to sorting by recentness or alphabetically, you can now sort also by tasks total, units total, and progress.
Summary
The use of epics is a great to establish a hierarchy in your backlog so that you can plan your work at a higher level. If you aren’t using epics for organising your product roadmap, now it’s a good time to start doing that. If Trello is your tool of choice, you can add support for epics by installing our free Epic Cards Power-Up.
We have made improvements to the Epics screen and wanted to provide an update of all the things you can do with epics in Screenful. Epics are a great way to organise your individual tasks into larger bodies of work. An epic is essentially a large task (or user story) that can be broken down into a number of smaller tasks or stories. The main benefit in the use of epics in your product development process is that allows you can plan your work in bigger chunks than just individual tasks.
What’s new?
Quick menu for browsing epics
Charts integrated with the Epics screen
New sorting options
These features are immediately available for Jira, Trello, and Pivotal Tracker. Read on to learn more about these improvements or start a free trial to give it a try with your own data.
Quick menu for browsing epics
You can now filter the epic list by the epic status. By default, all epics are shown but you can change it to show either the Open or Completed epics.
If you’re using the Epics Cards Power-Up, you’ll find the link for completing an epic within the epic card:
The date range menu can also be used for filtering the list since only the epics with activity within the selected date range are included in the list. For example, When Last 2 months is selected as the date range, the list contains the epics which has the the most recent activity within that range:
That allows you to focus the list on the currently active epics, or the most recently completed epics while hiding those that don’t have any activity recently.
You can now have charts integrated with the Epics screen
The Epics screen has now an option to show a link epic specific chart in the right column. So for each of your epics, you can see the chart of your choice filtered with that epic. Currently supported charts are the Cumulative flow chart and the Cycle time chart.
You can see the cumulative progress of an epic by selecting Cumulative flow as one of the columns
Once you click Save, the new column is added to the Epics screen:
Clicking the chart icon shows the cumulative flow for that epic:
You can also enable the cycle time chart, which shows a scatter plot the completion times of individual tasks assigned to that epic:
Hovering the mouse over a circle shows the name of the task and the cycle time:
This chart helps you to find outliers in your data as it shows how long it took to complete any individual task assigned to an epic. Do certain types of tasks take longer than average to complete? Which tasks were fastest or slowest to complete? Can you find any patterns that helps you to streamline the flow of tasks?
New sorting options
We’ve also added some new sorting options. In addition to sorting by recentness or alphabetically, you can now sort also by tasks total, units total, and progress.
Summary
The use of epics is a great to establish a hierarchy in your backlog so that you can plan your work at a higher level. If you aren’t using epics for organising your product roadmap, now it’s a good time to start doing that. If Trello is your tool of choice, you can add support for epics by installing our free Epic Cards Power-Up.
That’s it for this release. As always, we’d love to hear from you. Please do not hesitate to contact us anytime if you have questions or feedback.
To give it a try with your own data, sign up for a free 14-day trial
Also, check out recent product updates and follow us on Twitter or Facebook.