Analytics & Reports

Analytics & Reports

for Trello

for Trello

Get automated productivity insights from your Trello data and share them with ease

Available as Trello Power-Up
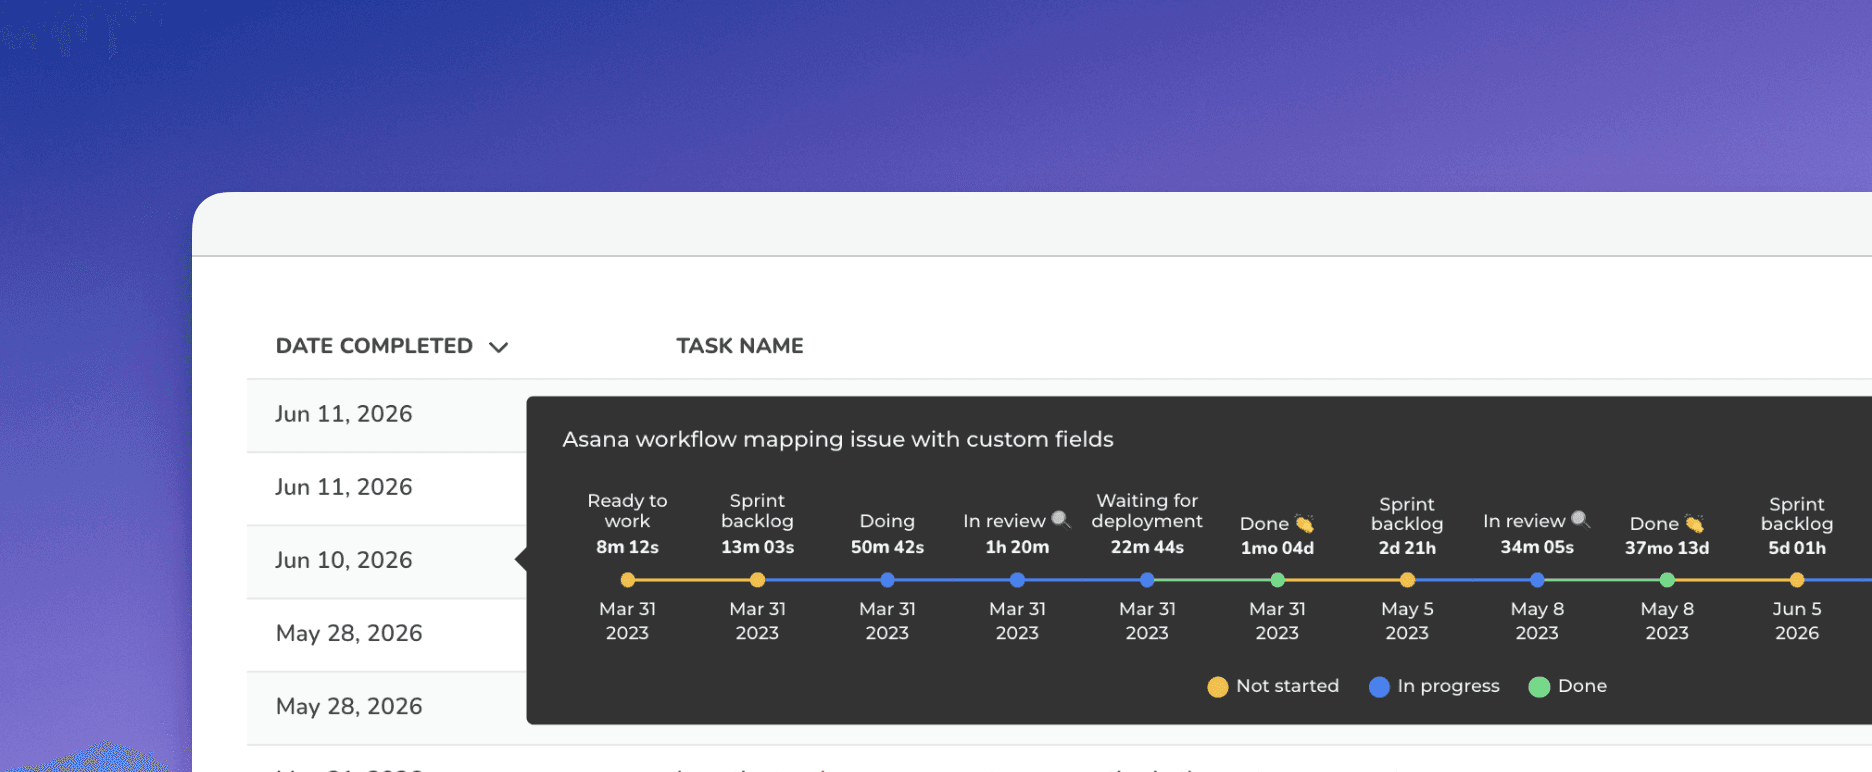
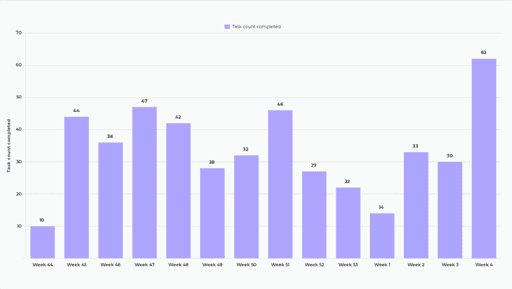
You can get Screenful within the Trello UI by installing the Power-Up.

You can get Screenful within the Trello UI by installing the Power-Up.

Analytics & Reports

Get actionable insights with automated reports and customizable charts.

Automated project reporting made easy for everyone

  • Screenful was best in every category. It beautifully and simply highlights key agile metrics for our whole in-office team and any visiting stakeholders.

    Jesse Fewell

    Agile coach, writer, trainer

    I love Screenful for its user-friendly interface and seamless integration to multiple data sources. The customer service is outstanding; they provided exceptional support whenever we needed it!

    Tasnia Rehnuma Mahmud

    Project Coordinator at Fashion Snoops

    Outright best reporting tool. We have tried many different ones over the past 2 years, and none of them beats Screenful. The ability to build custom reports provides amazing capabilities for agile teams.

    Akaki Meladze

    Director of Engineering at Singular

    Using visual boards without metrics misses the whole point of improving performance. Screenful is a must have tool for our Kanban.

    Jaxon Klein

    CEO & Co-founder at Keyo Inc.

    We've been using Screenful for 13 months now and we can't say enough good things about it. The insight we have is invaluable to us and has helped us keep the delivery capacity at a steady temperature.

    Fabien Arcellier

    CTO & Co-founder at Stackeo

    Screenful is a wonderful visualization tool that I use to illustrate to organizations why they should relentlessly focus on reducing lead time & cycle time, understand cumulative flow and decompose work.

    Patrick Ingram

    Enterprise Agility Consultant

    Accenture is working with Screenful to roll out best practice agile metrics in minutes - allowing our world class delivery teams to be led by data.

    Kit Friend

    Business & Technology Innovation Senior Principle, Accenture UK

    Screenful allows me to easily identify where I am spending time so that I can ensure I'm working on the right things. The weekly email is a great summary delivered right to my phone

    Andy Wheeldon

    Agile coach

trusted by the world’s most innovative businesses

trusted by the world’s most innovative businesses

trusted by the world’s most innovative businesses

"Really good looking views and easy setup. Ideal for providing open visibility for the progress across the company."

🏆🏆🏆

Winner of the Best Trello Power-Up, and an Honorary Mention in the Jira Apps Category at the Atlassian Codegeist

FAQ

Common questions

Do you have a free version?

Yes and no. We have a set of free Power-Ups that you can freely install to your boards. We also have two paid products, Analytics & reports, and Dashboards which you can try out for free.

Yes and no. We have a set of free Power-Ups that you can freely install to your boards. We also have two paid products, Analytics & reports, and Dashboards which you can try out for free.

Do I need a paid version of Trello in order to use Screenful?

Screenful has its own pricing plan, separate from Trello. You don't need a paid version of Trello in order to use Screenful.

Screenful has its own pricing plan, separate from Trello. You don't need a paid version of Trello in order to use Screenful.

What’s the difference between Screenful Power-Up and the Screenful SaaS service?

Both have the same features, except that with the Power-up, you can embed Screenful within your Trello UI. Regardless of whether you have installed the Power-Up or not, you can always use Screenful just like any standalone web app by logging in at https://screenful.com/login/

Both have the same features, except that with the Power-up, you can embed Screenful within your Trello UI. Regardless of whether you have installed the Power-Up or not, you can always use Screenful just like any standalone web app by logging in at https://screenful.com/login/

What about your free Power-Ups, do I need to use them?

You don’t have to use our free Power-Ups but if you do, the data created in the Power-Ups will be available in your charts, reports, and dashboards.

You don’t have to use our free Power-Ups but if you do, the data created in the Power-Ups will be available in your charts, reports, and dashboards.

Can I create charts based on due dates in cards?

Yes, you can filter charts based on due dates or by status such as overdue. You can also track the amount of work planned for the future using the Workload (planned) chart. Learn more about setting up the workload (planned) chart for Trello.

Yes, you can filter charts based on due dates or by status such as overdue. You can also track the amount of work planned for the future using the Workload (planned) chart. Learn more about setting up the workload (planned) chart for Trello.

Do you support work estimates such as story points?

Yes. You can use a custom field or the free Card Size Power-Up for setting weights for cards. Lean more about how to set estimates in your tasks in Trello.

Yes. You can use a custom field or the free Card Size Power-Up for setting weights for cards. Lean more about how to set estimates in your tasks in Trello.

What if I archive a card?

Archived cards are treated differently depending on whether they are completed or not. Completed cards are still considered completed even if they are archived. Cards that are archived before they are completed are considered removed. Archiving a card doesn't affect the metrics collected before it was archived. 

Archived cards are treated differently depending on whether they are completed or not. Completed cards are still considered completed even if they are archived. Cards that are archived before they are completed are considered removed. Archiving a card doesn't affect the metrics collected before it was archived. 

How are the lead and cycle times calculated in Trello?

The timings are based on your workflow settings. You can learn more from the Lead Time FAQ.

The timings are based on your workflow settings. You can learn more from the Lead Time FAQ.

I have created automation to move cards from one board to another. Will that mess up my stats?

If a card is moved from one board A to board B, you will lose the data about the card movements in board A since the Trello API won’t return it anymore. The solution is to copy the card instead of moving it.

If a card is moved from one board A to board B, you will lose the data about the card movements in board A since the Trello API won’t return it anymore. The solution is to copy the card instead of moving it.

Will Screenful make changes to my data, or is my data affected in any way?

We do not make changes to your data. We only read it via the API of your tool. Screenful is only for reporting and analytics. It does not update any data within your tools.

We do not make changes to your data. We only read it via the API of your tool. Screenful is only for reporting and analytics. It does not update any data within your tools.

Are weekends included in the cycle time calculation?

By default yes, but you can specify your working hours and days in the Account Settings.

By default yes, but you can specify your working hours and days in the Account Settings.

Can I filter charts based on epic, version, sprint etc.

Yes, you can learn more by reading the filtering guide.

Yes, you can learn more by reading the filtering guide.

How do I adjust the contents of the charts?

You can choose what data is included by setting a filter, and you can adjust the appearance of a chart in the chart settings.

You can choose what data is included by setting a filter, and you can adjust the appearance of a chart in the chart settings.

Is there a way to remove outliers from the data?

If you want to exclude individual items from the metrics, you can do it by following the steps below

  1. Set a specific label or tag (e.g. "excluded") to the item you want to exclude (task, issue, user story etc.)

  2. Go to Screenful and reset the data source in the Data sync options

  3. Go to the chart in question and set a filter (e.g. label is none of 'excluded')

If the item is already archived, you have to unarchive it first. Then apply the steps 1-2. After that, you can archive it again.

Does this support my specific workflow or do I have to use some specific states like "open", "in progress" and "done"?

You are not limited to any specific set of states or a workflow. You can configure your own workflow, if such exists, and you can use that in your reporting. It's also ok if you don't have any workflow in your boards, as can create reports based on any other criteria by setting a filter.

You are not limited to any specific set of states or a workflow. You can configure your own workflow, if such exists, and you can use that in your reporting. It's also ok if you don't have any workflow in your boards, as can create reports based on any other criteria by setting a filter.

How often is data updated?

All data sources are synced automatically once per hour. Changing settings or configuration will trigger additional sync so your data is at most one hour old. You can sync data manually at any time in the sync settings.

All data sources are synced automatically once per hour. Changing settings or configuration will trigger additional sync so your data is at most one hour old. You can sync data manually at any time in the sync settings.

Can I embed these charts into my intranet?

You can embed any custom chart or report to any web page using the embed code. Learn more about the sharing feature from the online guide

You can embed any custom chart or report to any web page using the embed code. Learn more about the sharing feature from the online guide

I can’t find an answer to my question

The Getting Started Guide contains Instructions for setting up Screenful.

See also our Accounts & Pricing FAQ.

Check out our how-to and public roadmap or get in touch by emailing to support@screenful.com

The Getting Started Guide contains Instructions for setting up Screenful.

See also our Accounts & Pricing FAQ.

Check out our how-to and public roadmap or get in touch by emailing to support@screenful.com

Troubleshooting

I have created a Butler automation to move completed cards from one Trello board to another. Will that mess up my stats?

If a card is moved from board A to board B, you will lose the card history from the board A since the Trello API won't return it anymore. Instead of moving to another board, you can create an automation to archive the card.

Once archived, the card is no longer visible on the board but is still included in Trello's search feature, and can be returned to the board at any time if needed.

Another option is to add a delay of at least two hours before moving an item. That leaves enough time for Screenful to register that the card was completed (sync runs once per hour).

Why I can’t see my Trello board when trying to create a new chart or dashboard?

You have to import the board as a data source first. If you don't see the board in the list of boards to import, you'll have to join that Trello board first to see it in the list. Once the board is imported, you can add it as a data source to charts.

You have to import the board as a data source first. If you don't see the board in the list of boards to import, you'll have to join that Trello board first to see it in the list. Once the board is imported, you can add it as a data source to charts.

Why are my charts not showing all the tasks I’ve assigned to my epics?

The most likely reason is that the chart does not have all the data sources included. If the tasks in your epics are scattered across multiple boards, all those boards must be added as data sources to the chart.

You should also review your workflow mapping to ensure all the required lists are mapped.