Let’s Iterate! Introducing the Burndown chart 🔥
May 30, 2022
We have released a burndown chart as a custom chart. With the new custom burndown chart, you can create a burndown for any work scope and place it into a report or a dashboard.
Creating a Burndown chart
1) Navigate to the Charts tab.
2) Click Add new chart.
3) Click New blank chart.
4) Select Burndown 🔥 as the chart type.
The chart editor opens with the chart settings:
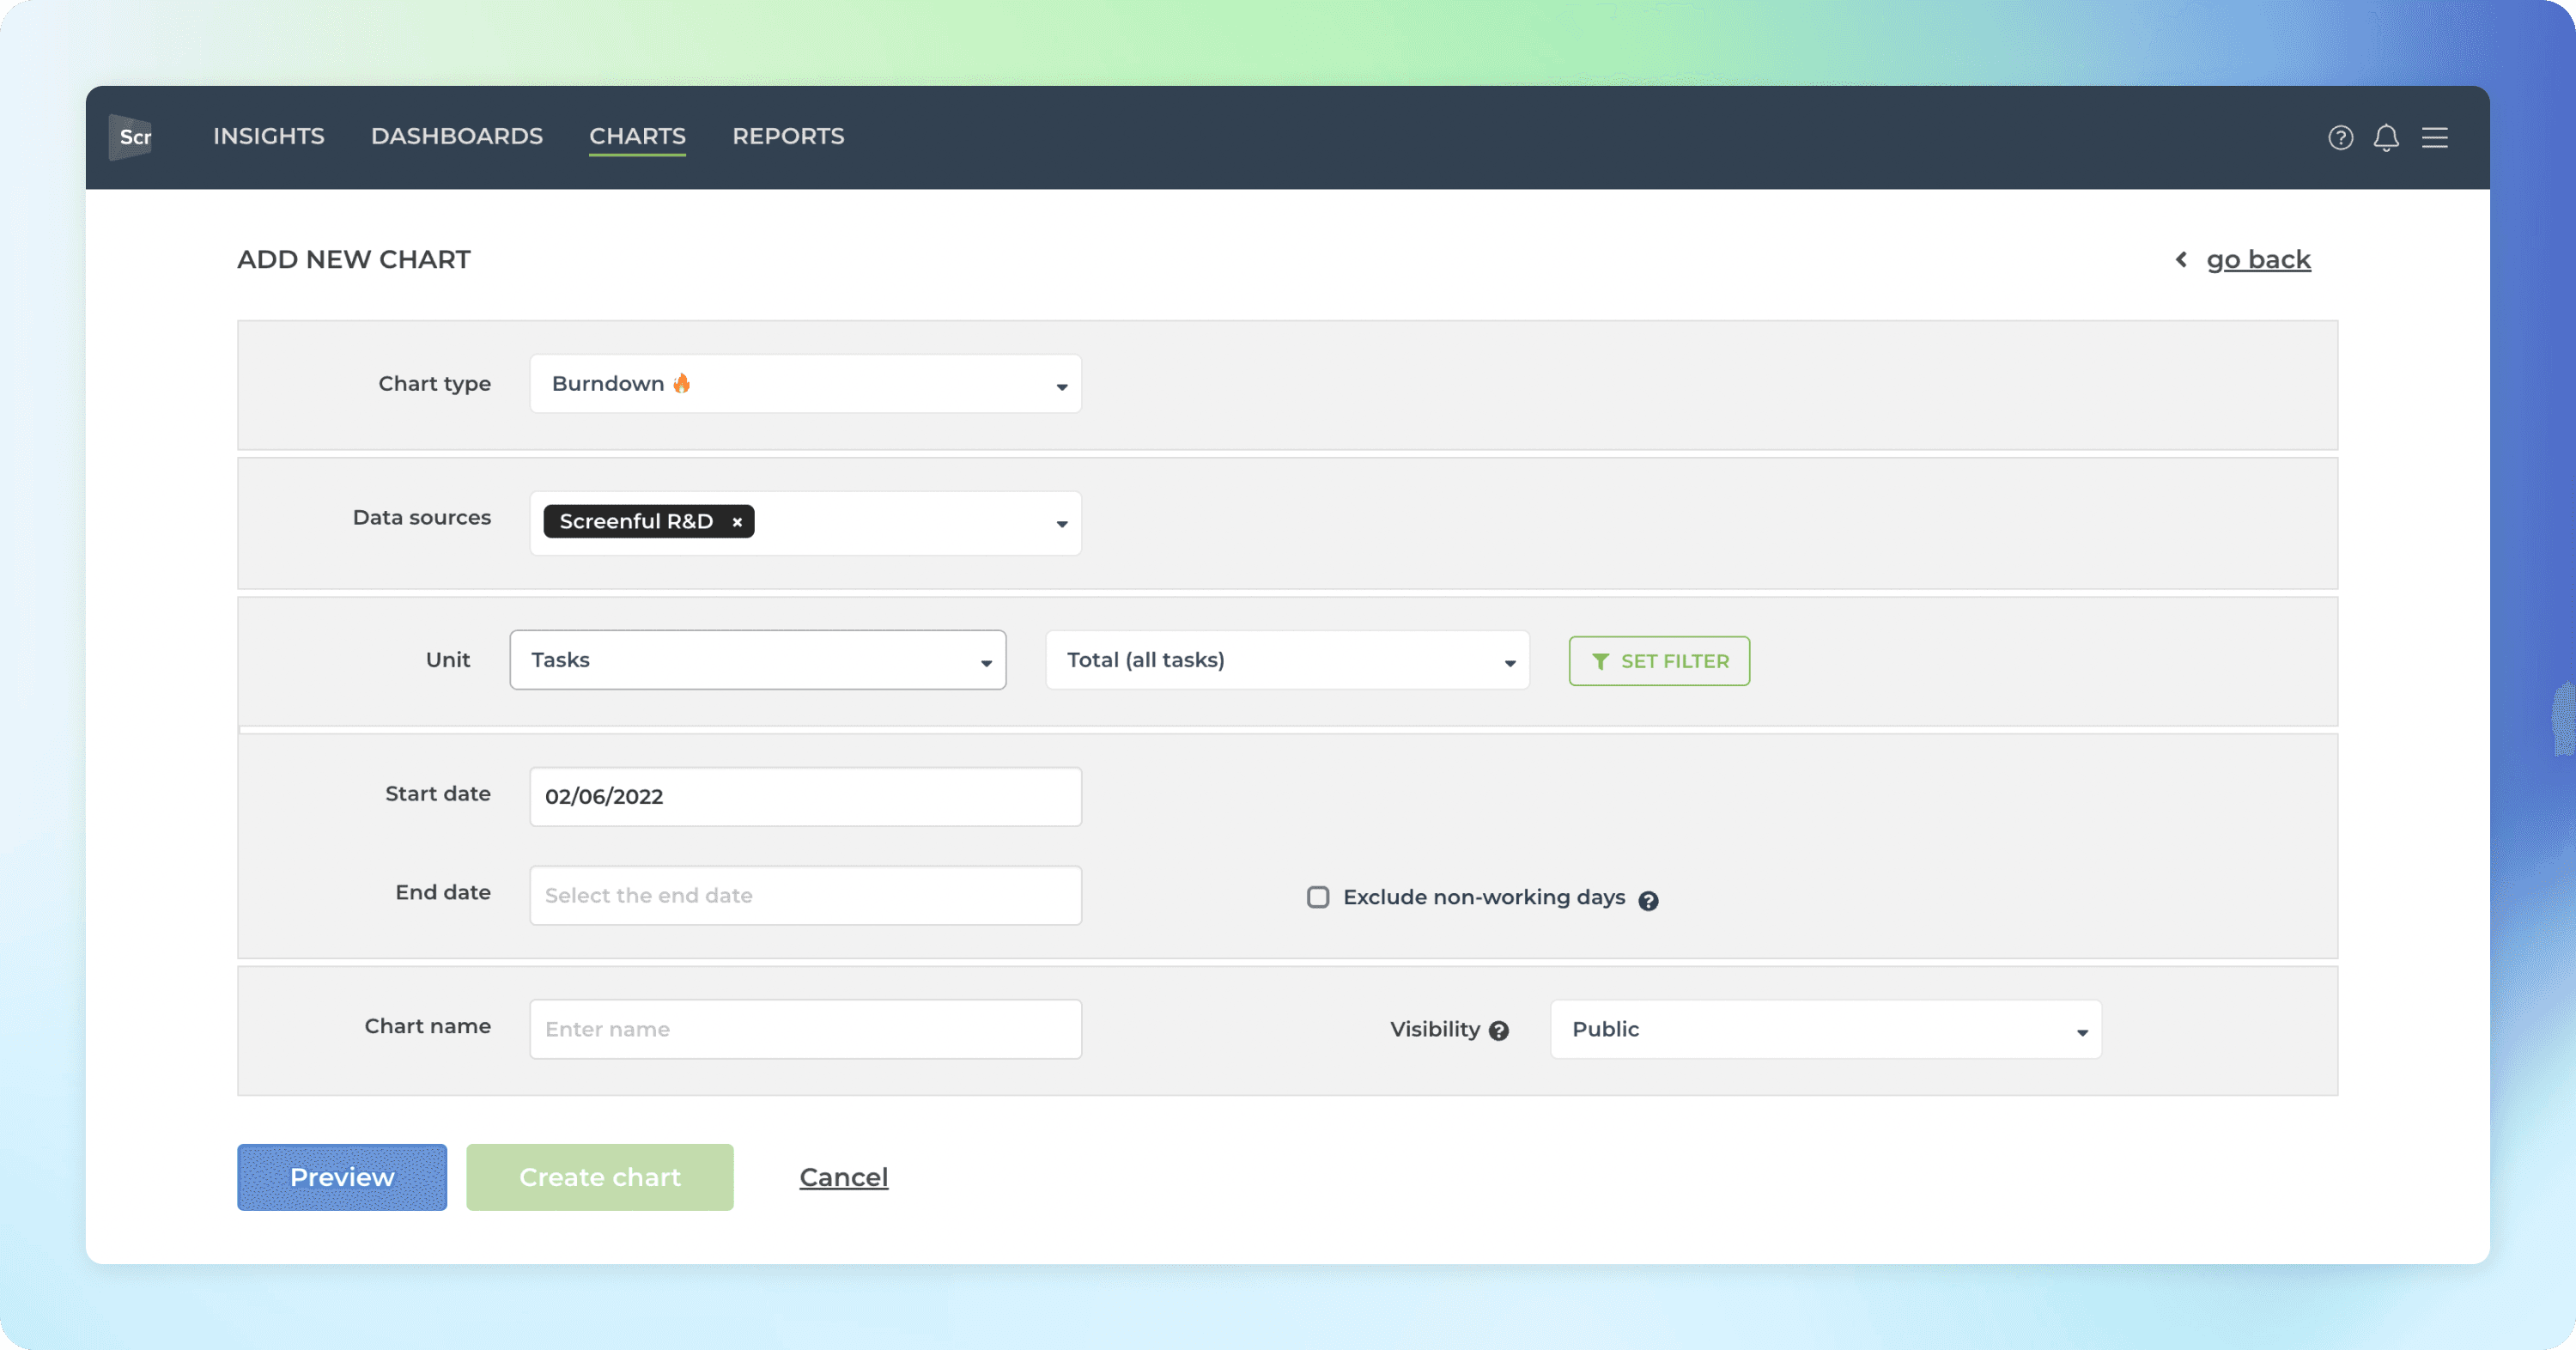
You can select one or more data sources, and any of your numeric fields as the unit.
The work scope is set with a filter. For example, if you want to see a burndown of a certain Jira epic, GitHub Milestone, or a set of groups in a Monday board, you can do so by setting the filter accordingly.
If you check exclude non-working days, the expected burndown will be flat during the weekends.
When you click Create chart, the chart is created and you can find it under the Charts tab under the top navigation.
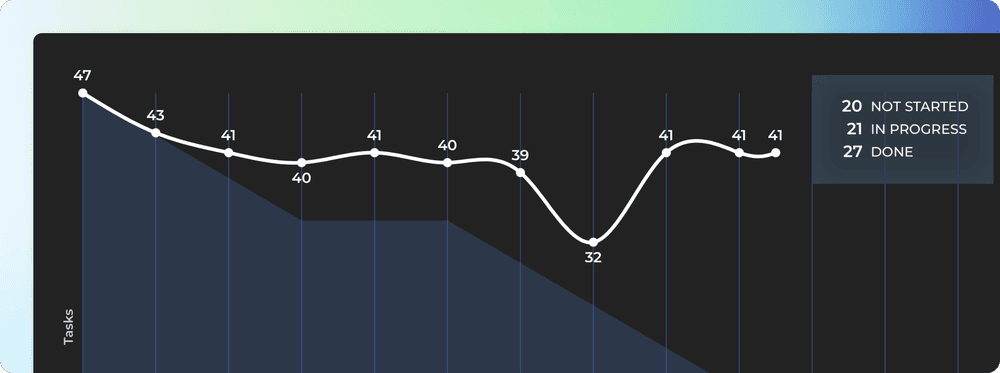
Here’s an example chart:
As with any of our custom charts, you can assign it to a report, or share it with others using the share links.
How to read the burndown chart?
A burndown chart shows how much work there's left in the selected work scope. The vertical axis represents work items and the horizontal axis represents time. When you complete tasks, the chart shows how much work is still remaining.
The lighter-colored area in the background shows the expected burndown. That’s how your burndown would look like if you completed the work evenly throughout the selected timespan (e.g. sprint or a milestone). The white line is your actual burndown. The expected burndown provides guidance so that if your actual burndown differs a lot from the expected burndown, then you are getting behind (or ahead) of the plan.
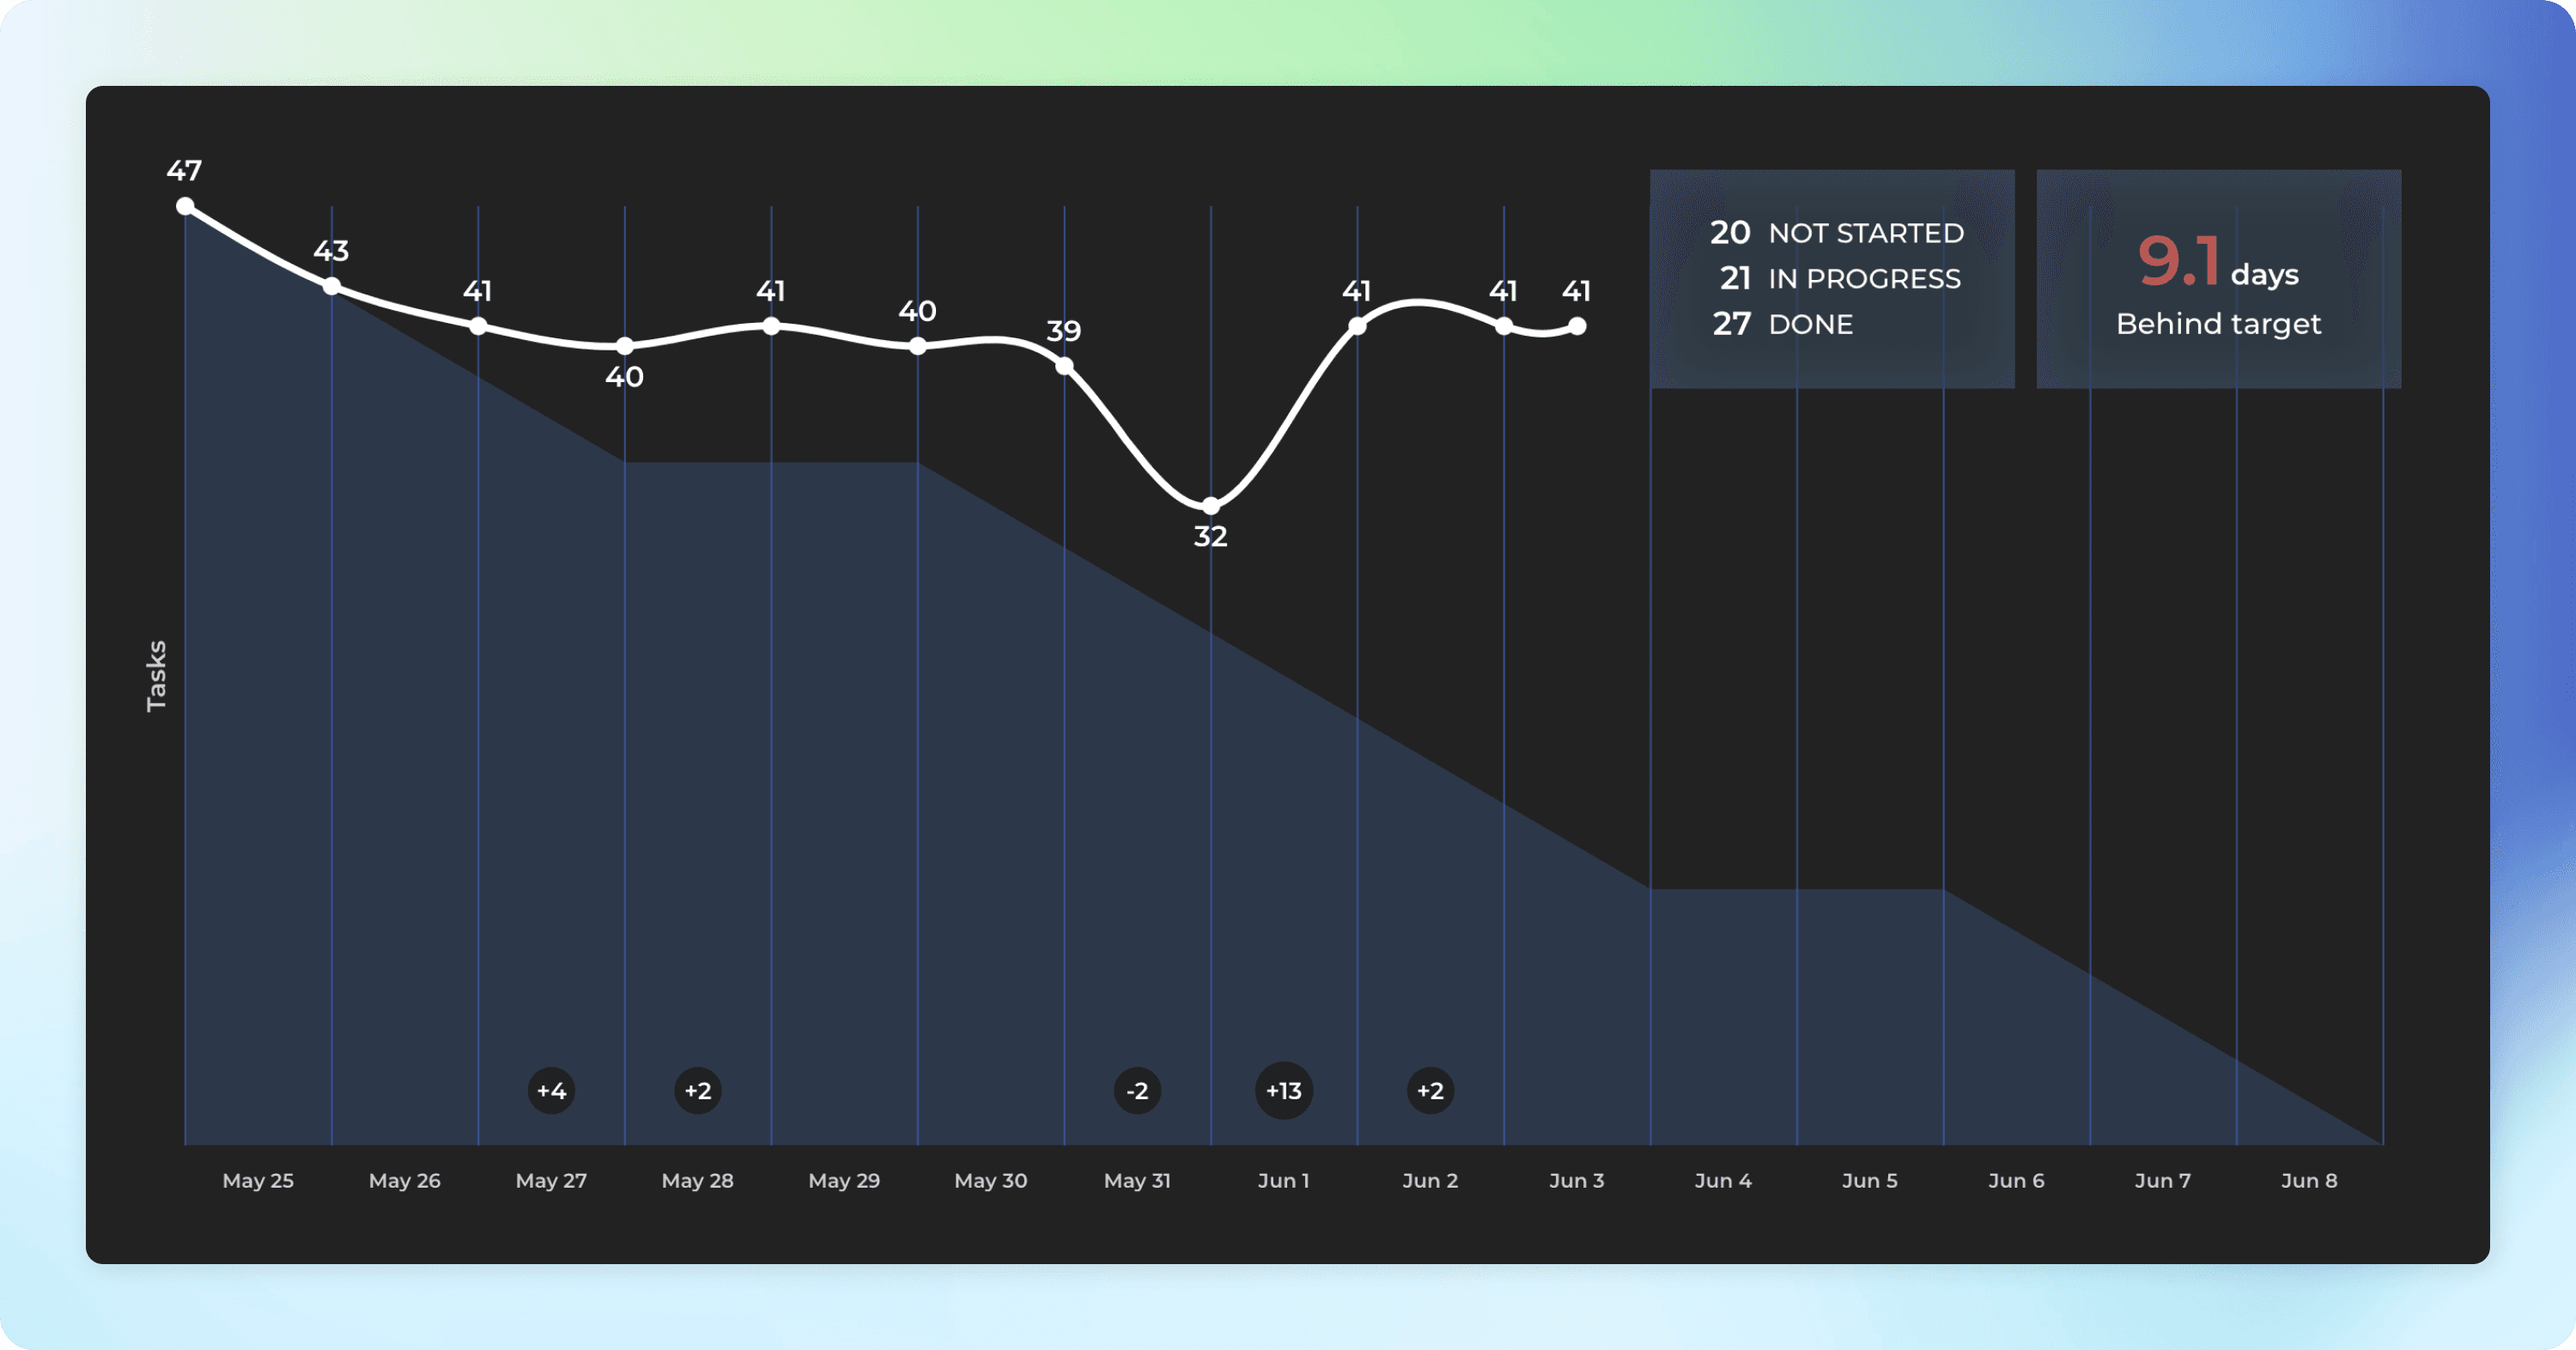
If work is added or removed after the burndown was started, the changes in the scope are shown in the timeline:
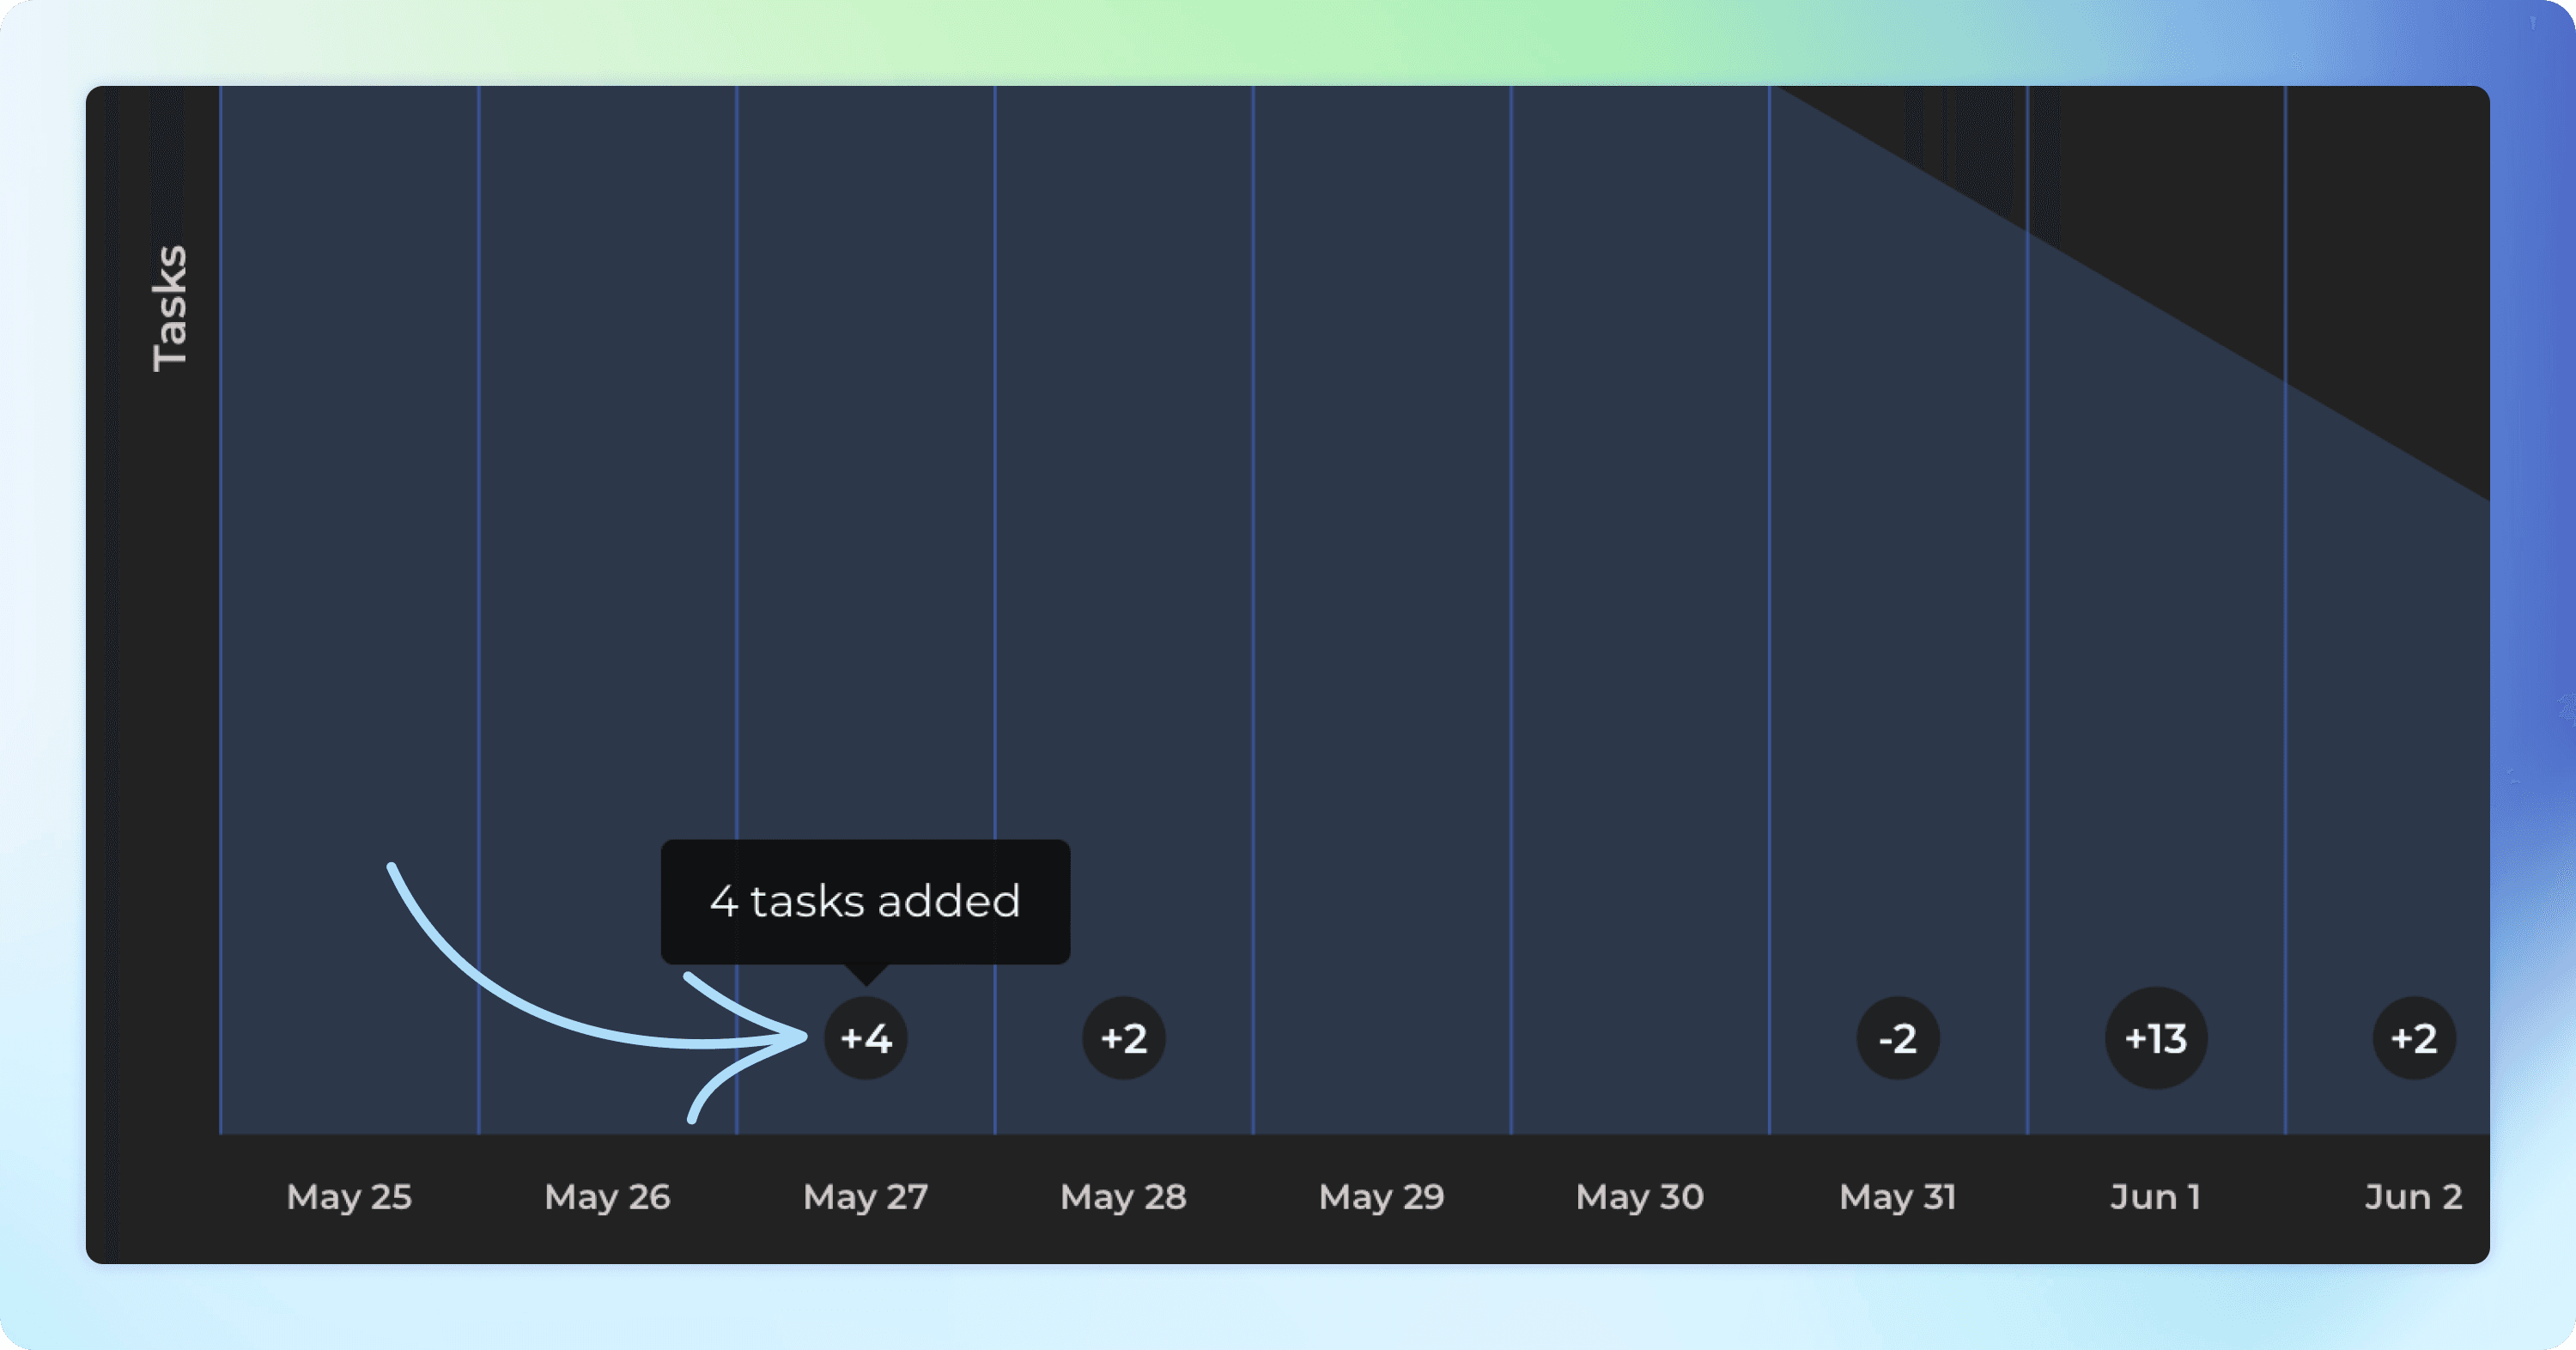
The numbers shown in the burndown line always display the work remaining. The burndown line shows the daily difference in the remaining work, considering newly added work and completions.
If you add more new work to the scope than you complete, the burndown starts trending upwards. That means you are falling behind your goal.
Good luck with meeting your sprint goals!
Avísanos si tienes preguntas o comentarios contactando hello@screenful.com. Para estar al tanto, lee nuestro blog, o síguenos en LinkedIn.