Add custom charts to a report
Add custom charts to a report
To add a custom chart to a report, select Edit report from the report context menu to open it for editing.

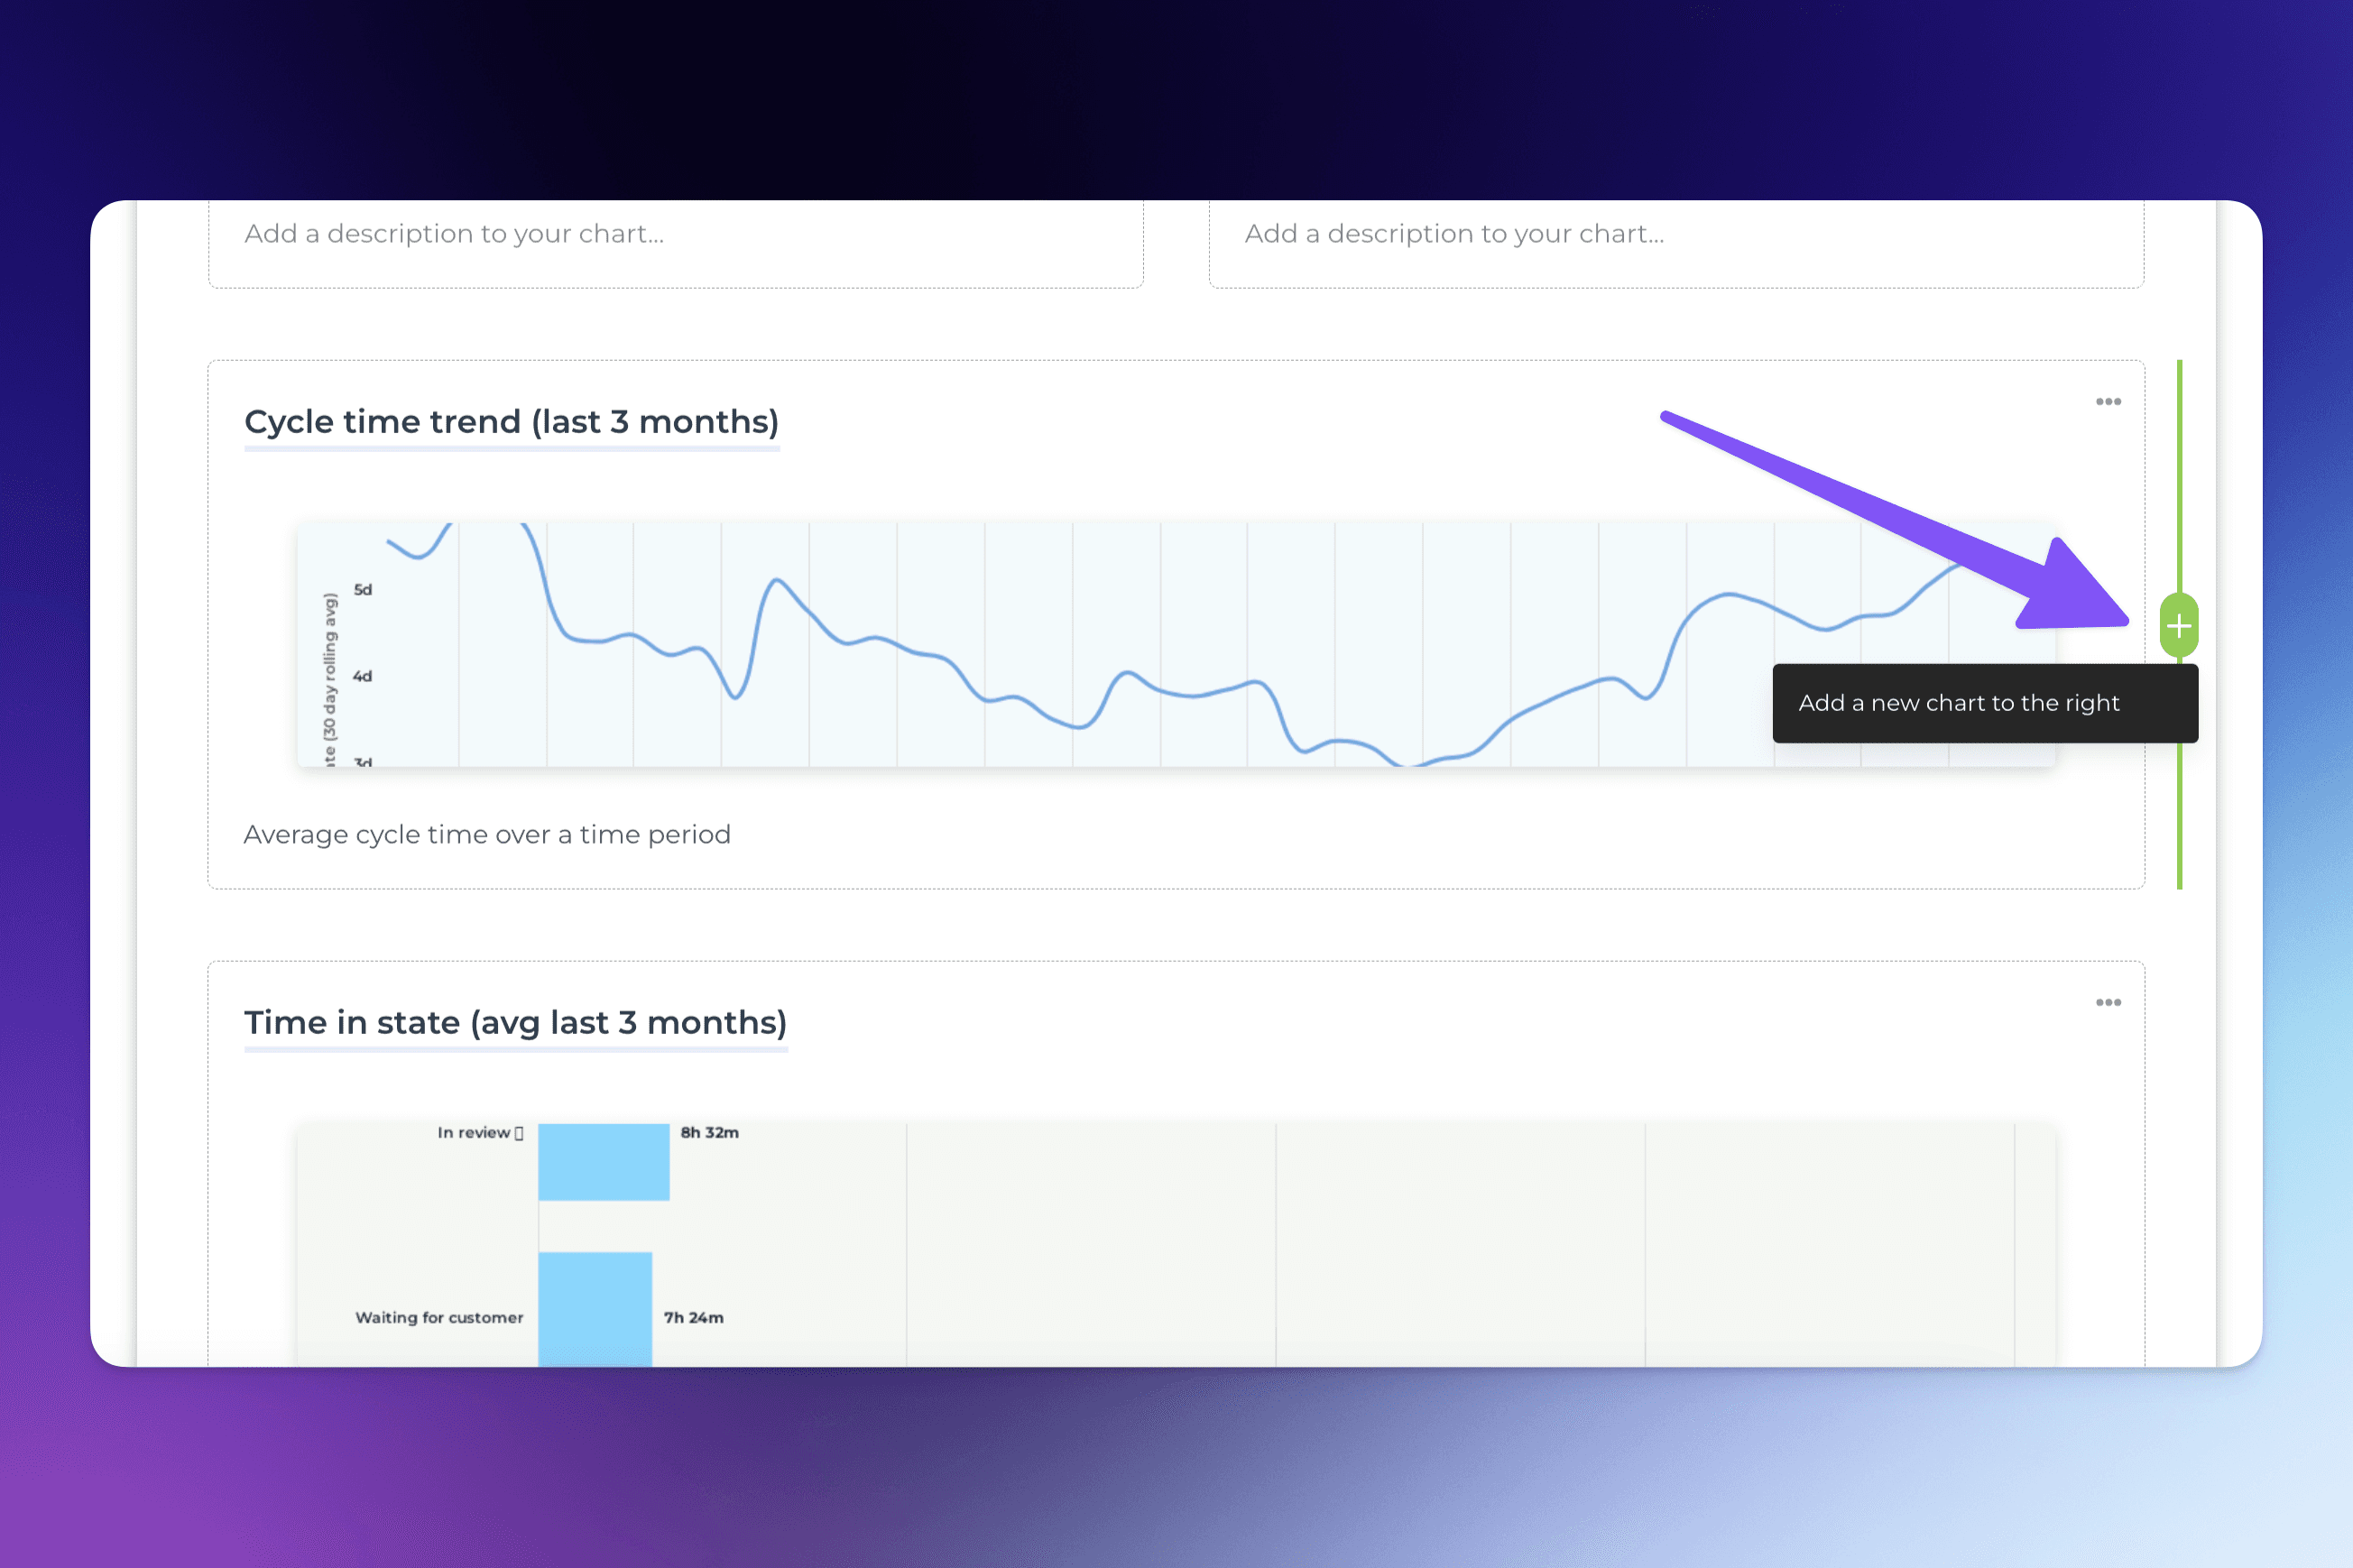
In the report editor, hover over any side of an existing chart and click the “+” button to add either a new chart or a new text block:

To split a row into two columns, hover over either sides of an existing chart, click the “+” button and select Add a new chart:
A modal will open allowing you to either use one of the existing charts, create a new chart from the chart template gallery, or create a new chart from scratch.
If you decide to create a new chart from scratch, the chart editor opens allowing you to configure the chart.
From there, you can drag & drop it to the desired position in the report.
To add a custom chart to a report, select Edit report from the report context menu to open it for editing.
In the report editor, hover over any side of an existing chart and click the “+” button to add either a new chart or a new text block:
To split a row into two columns, hover over either sides of an existing chart, click the “+” button and select Add a new chart:
A modal will open allowing you to either use one of the existing charts, create a new chart from the chart template gallery, or create a new chart from scratch.
If you decide to create a new chart from scratch, the chart editor opens allowing you to configure the chart.
From there, you can drag & drop it to the desired position in the report.