Tracking metrics based on custom Date fields
Jun 4, 2024
We have added new capabilities for tracking work based on start date, due date, or by any of your custom date fields. When you create a custom chart, you'll now be able to pick a date field instead of a workflow state as the primary filter for your chart. That lets you track how many items were completed by passing their manually set completion date.
Below, you can find some examples of how to use this feature.
Contenido:
Tracking completions based on Date completed
Let's assume you have a custom field Date completed on your board. You can create a chart that shows how many items have the date in the past by selecting by Date completed as the metric for the chart.
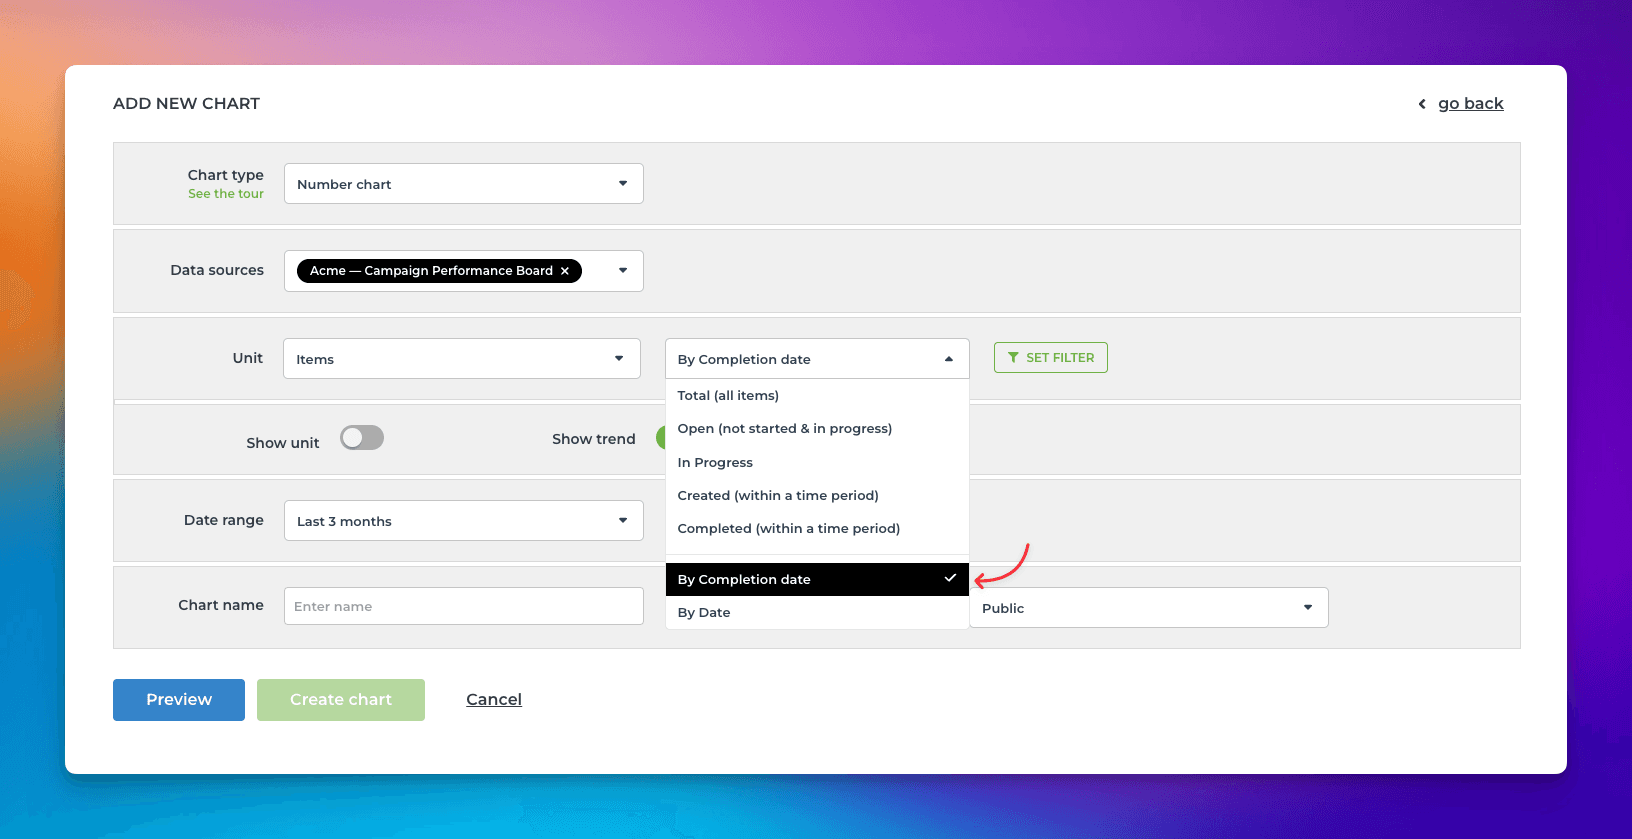
That will work the same way as if you had selected Completed (within date range), except that it will only look at the value in the date column. If the date is in the past, it is considered completed, regardless of the workflow state of that item. It is an alternative way of tracking work completions.
Here's the resulting chart:
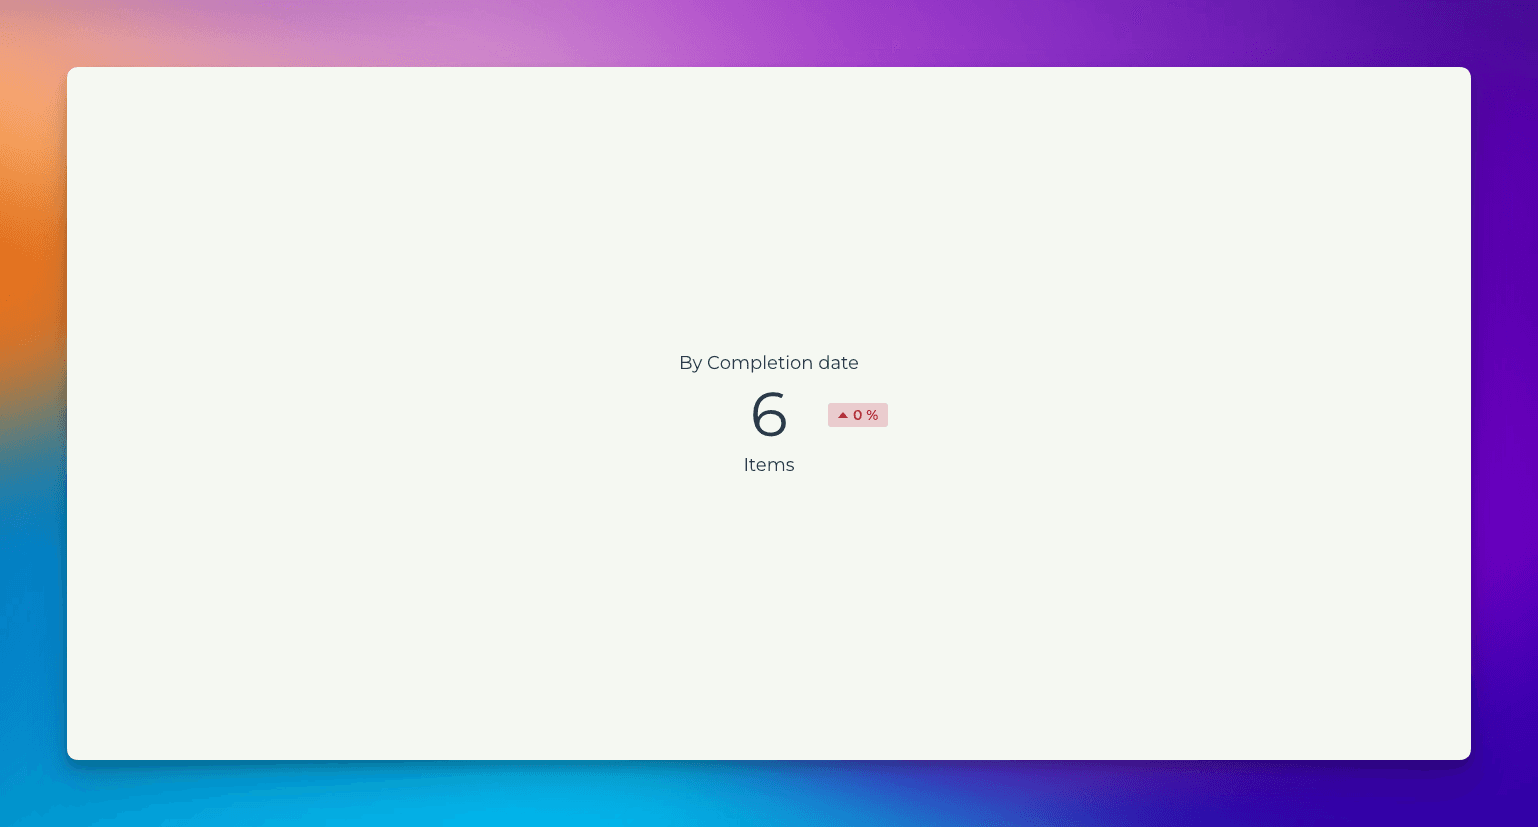
All of your date fields are automatically made available in the metric menu. This feature will be gradually made available to all accounts within the next few months. If you don't see your date columns in the menu, it means this feature has not yet been applied to your account.
Creating a bar chart of work due
When you create a bar chart, you'll see a list of date fields in the metrics menu:
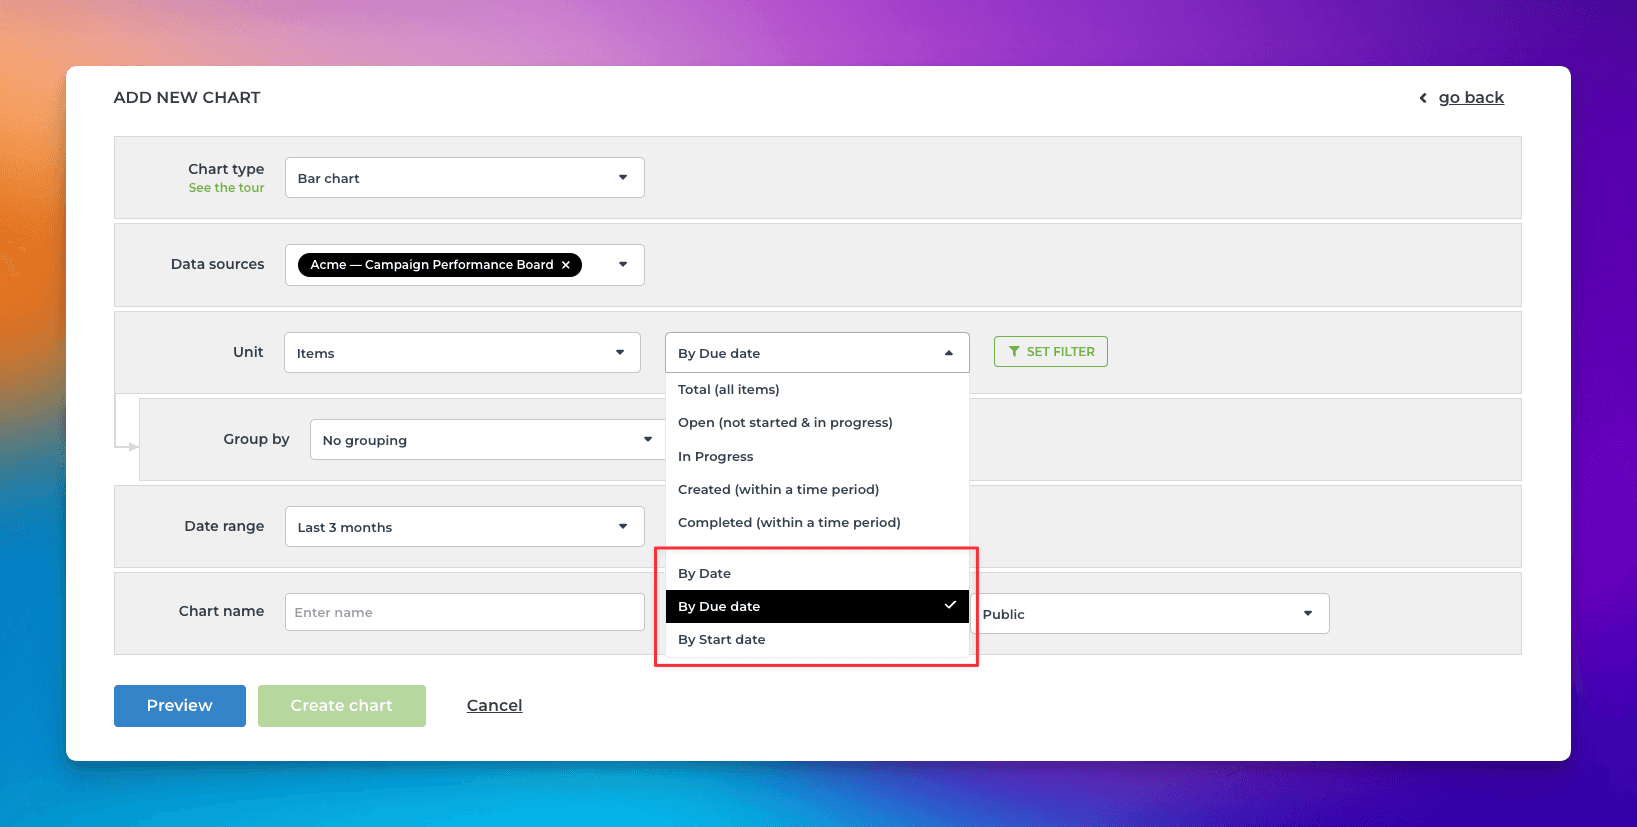
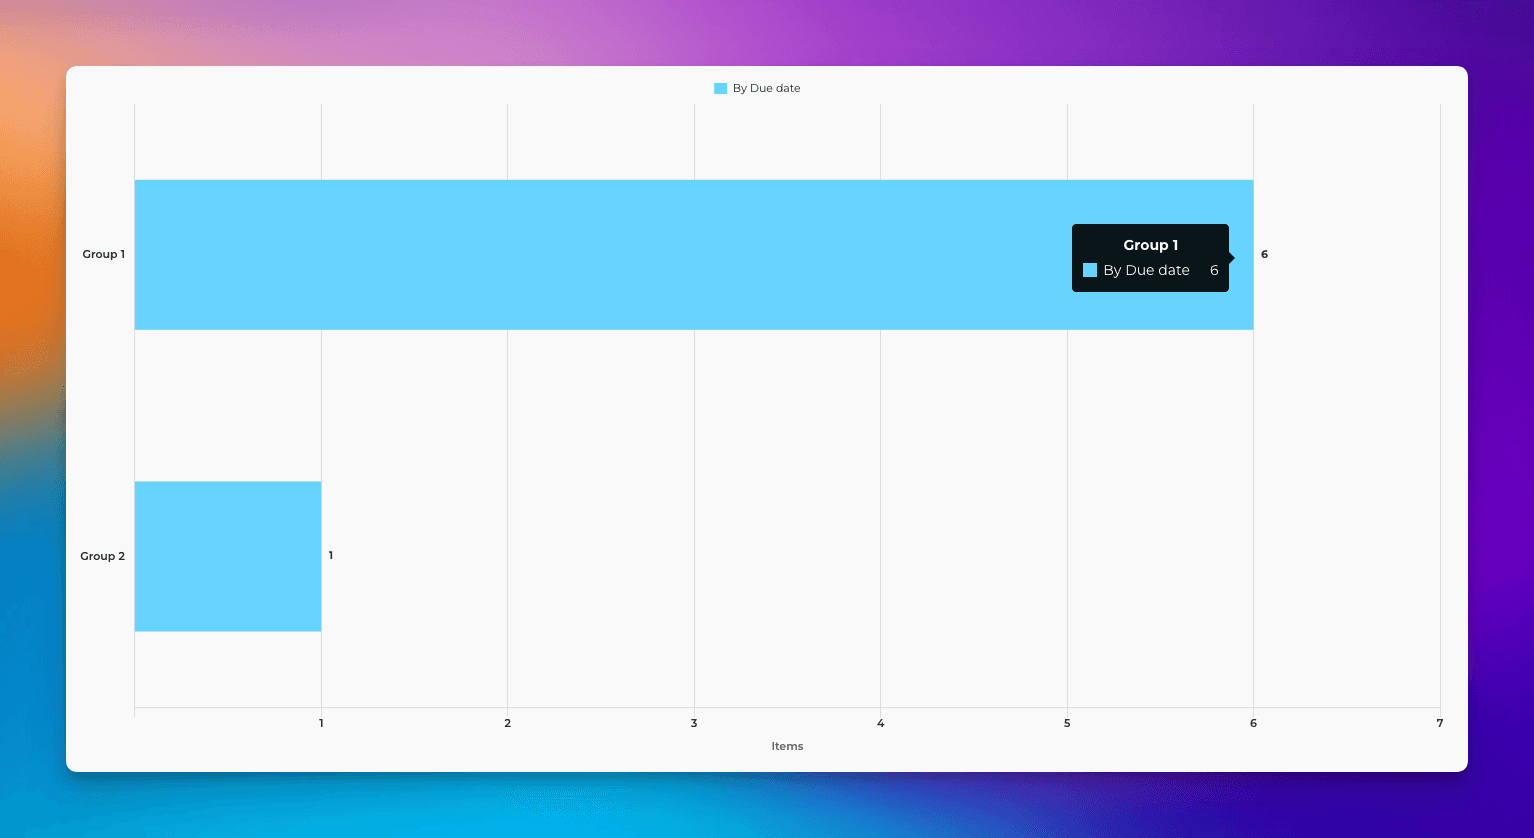
Selecting by Due date, generates a bar chart showing how many items have a due date in the past.
Creating a line chart based on Start date
When creating a line chart, you can pick a date field from the metrics menu:
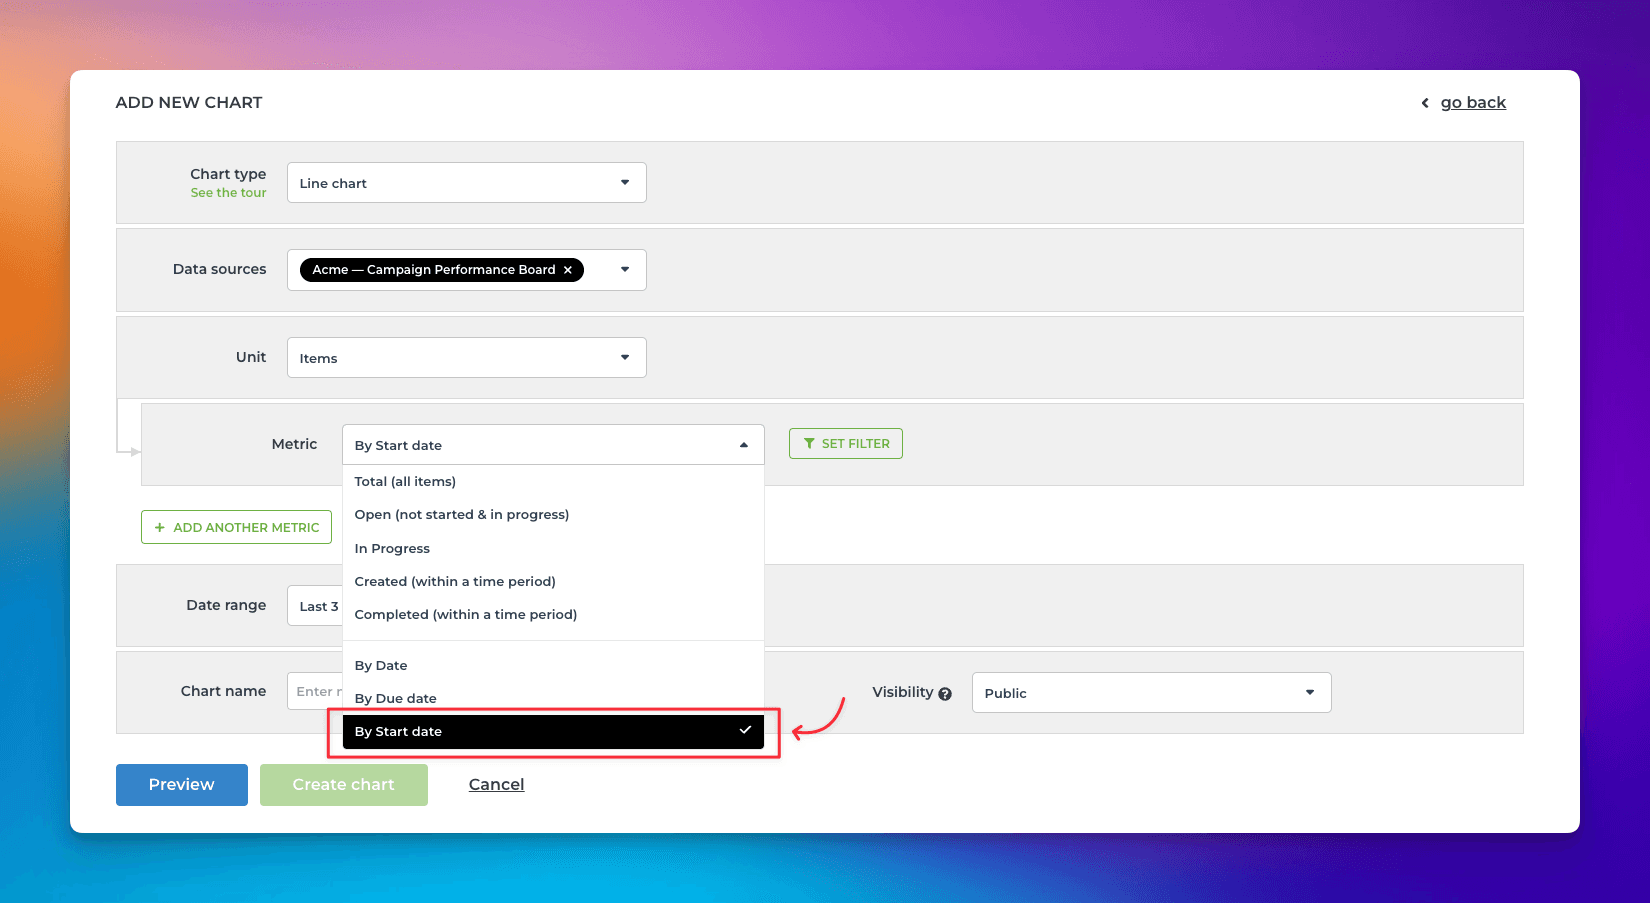
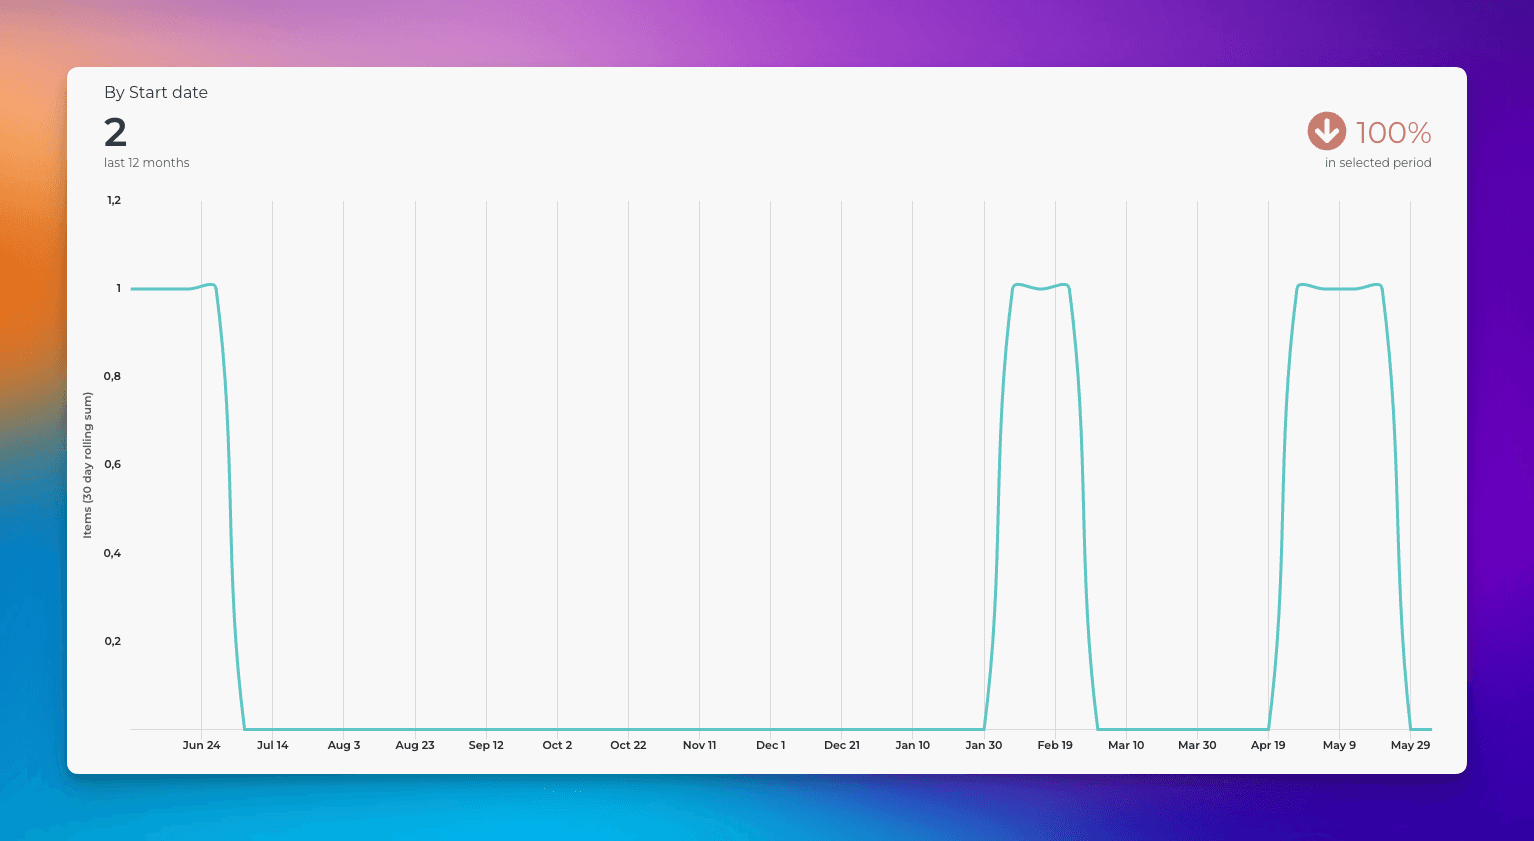
Selecting Start date, generates a line chart showing how many items have start date in the past.
Tracking custom units by date
You can track any of your units, such as Story points, by any of your date fields. Like previously, you can pick a unit from the Unit menu:
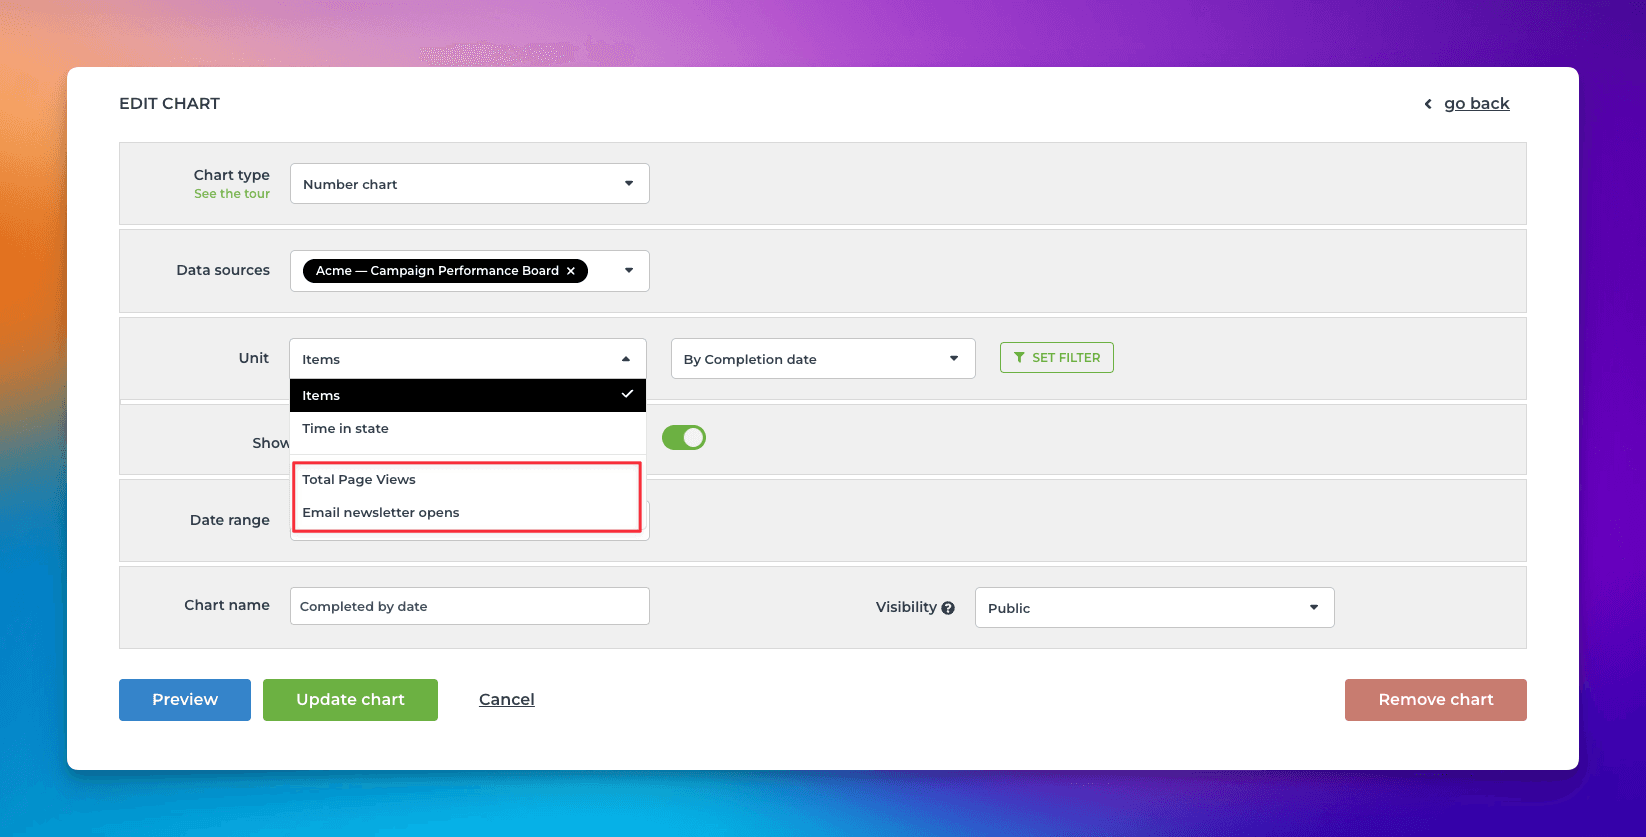
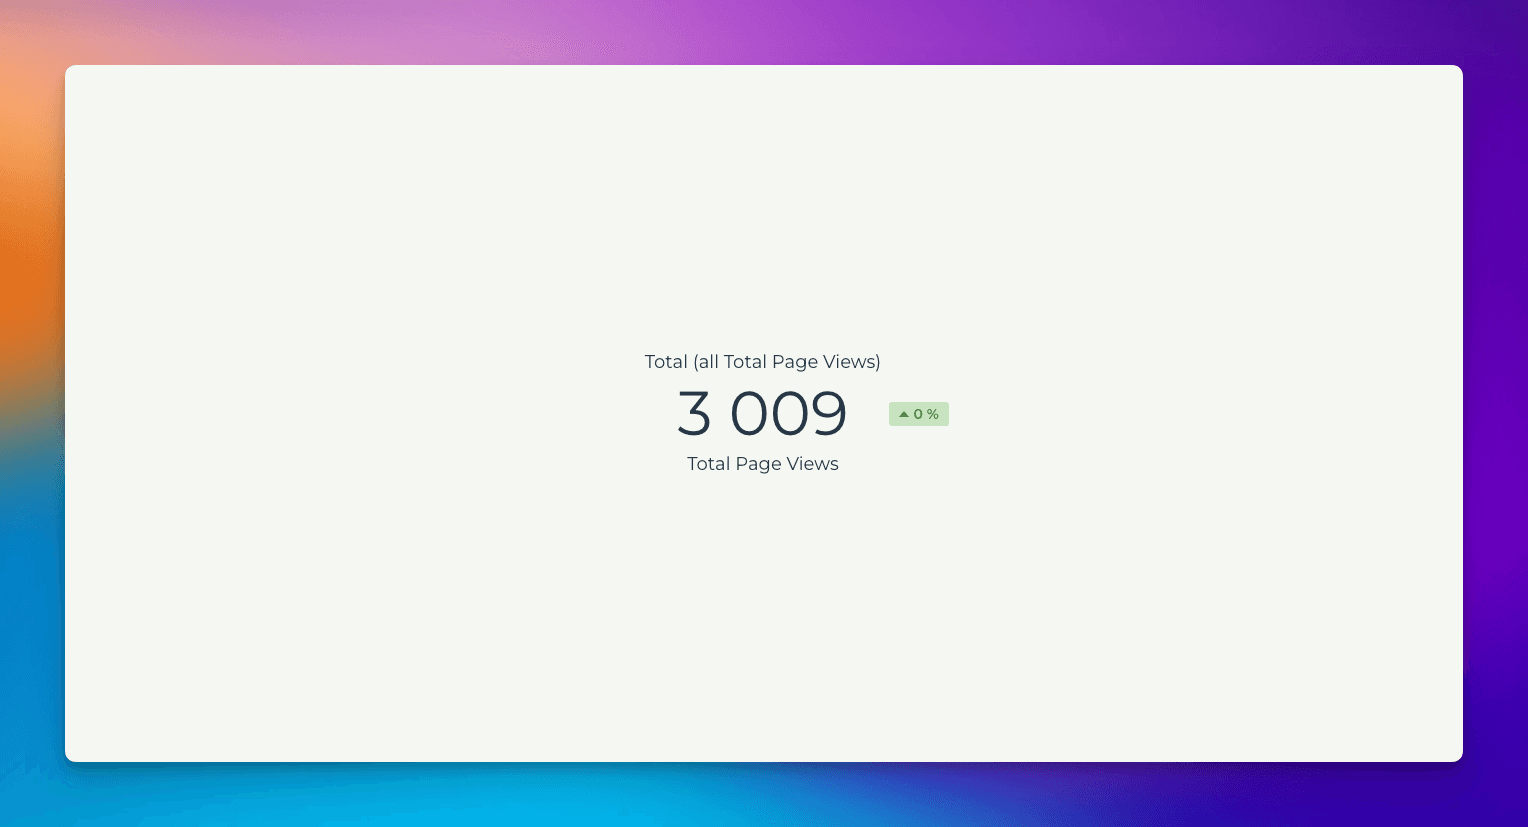
In this example, I have selected Total page views as the unit for the chart. Here's the resulting chart:
Any of your custom number fields can be used as a unit in the charts. You can also map your drop down fields as units in the custom fields mapping. You can learn more from this guide.
Avísanos si tienes preguntas o comentarios contactando hello@screenful.com. Para estar al tanto, lee nuestro blog, o síguenos en LinkedIn.
