Get automated productivity insights from your GitHub data and share them with ease
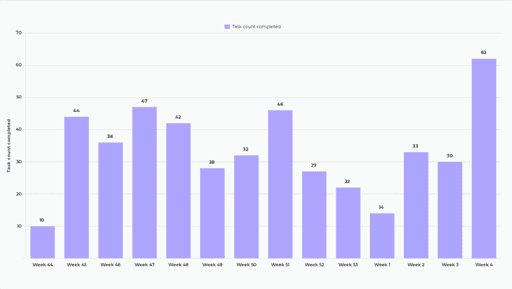
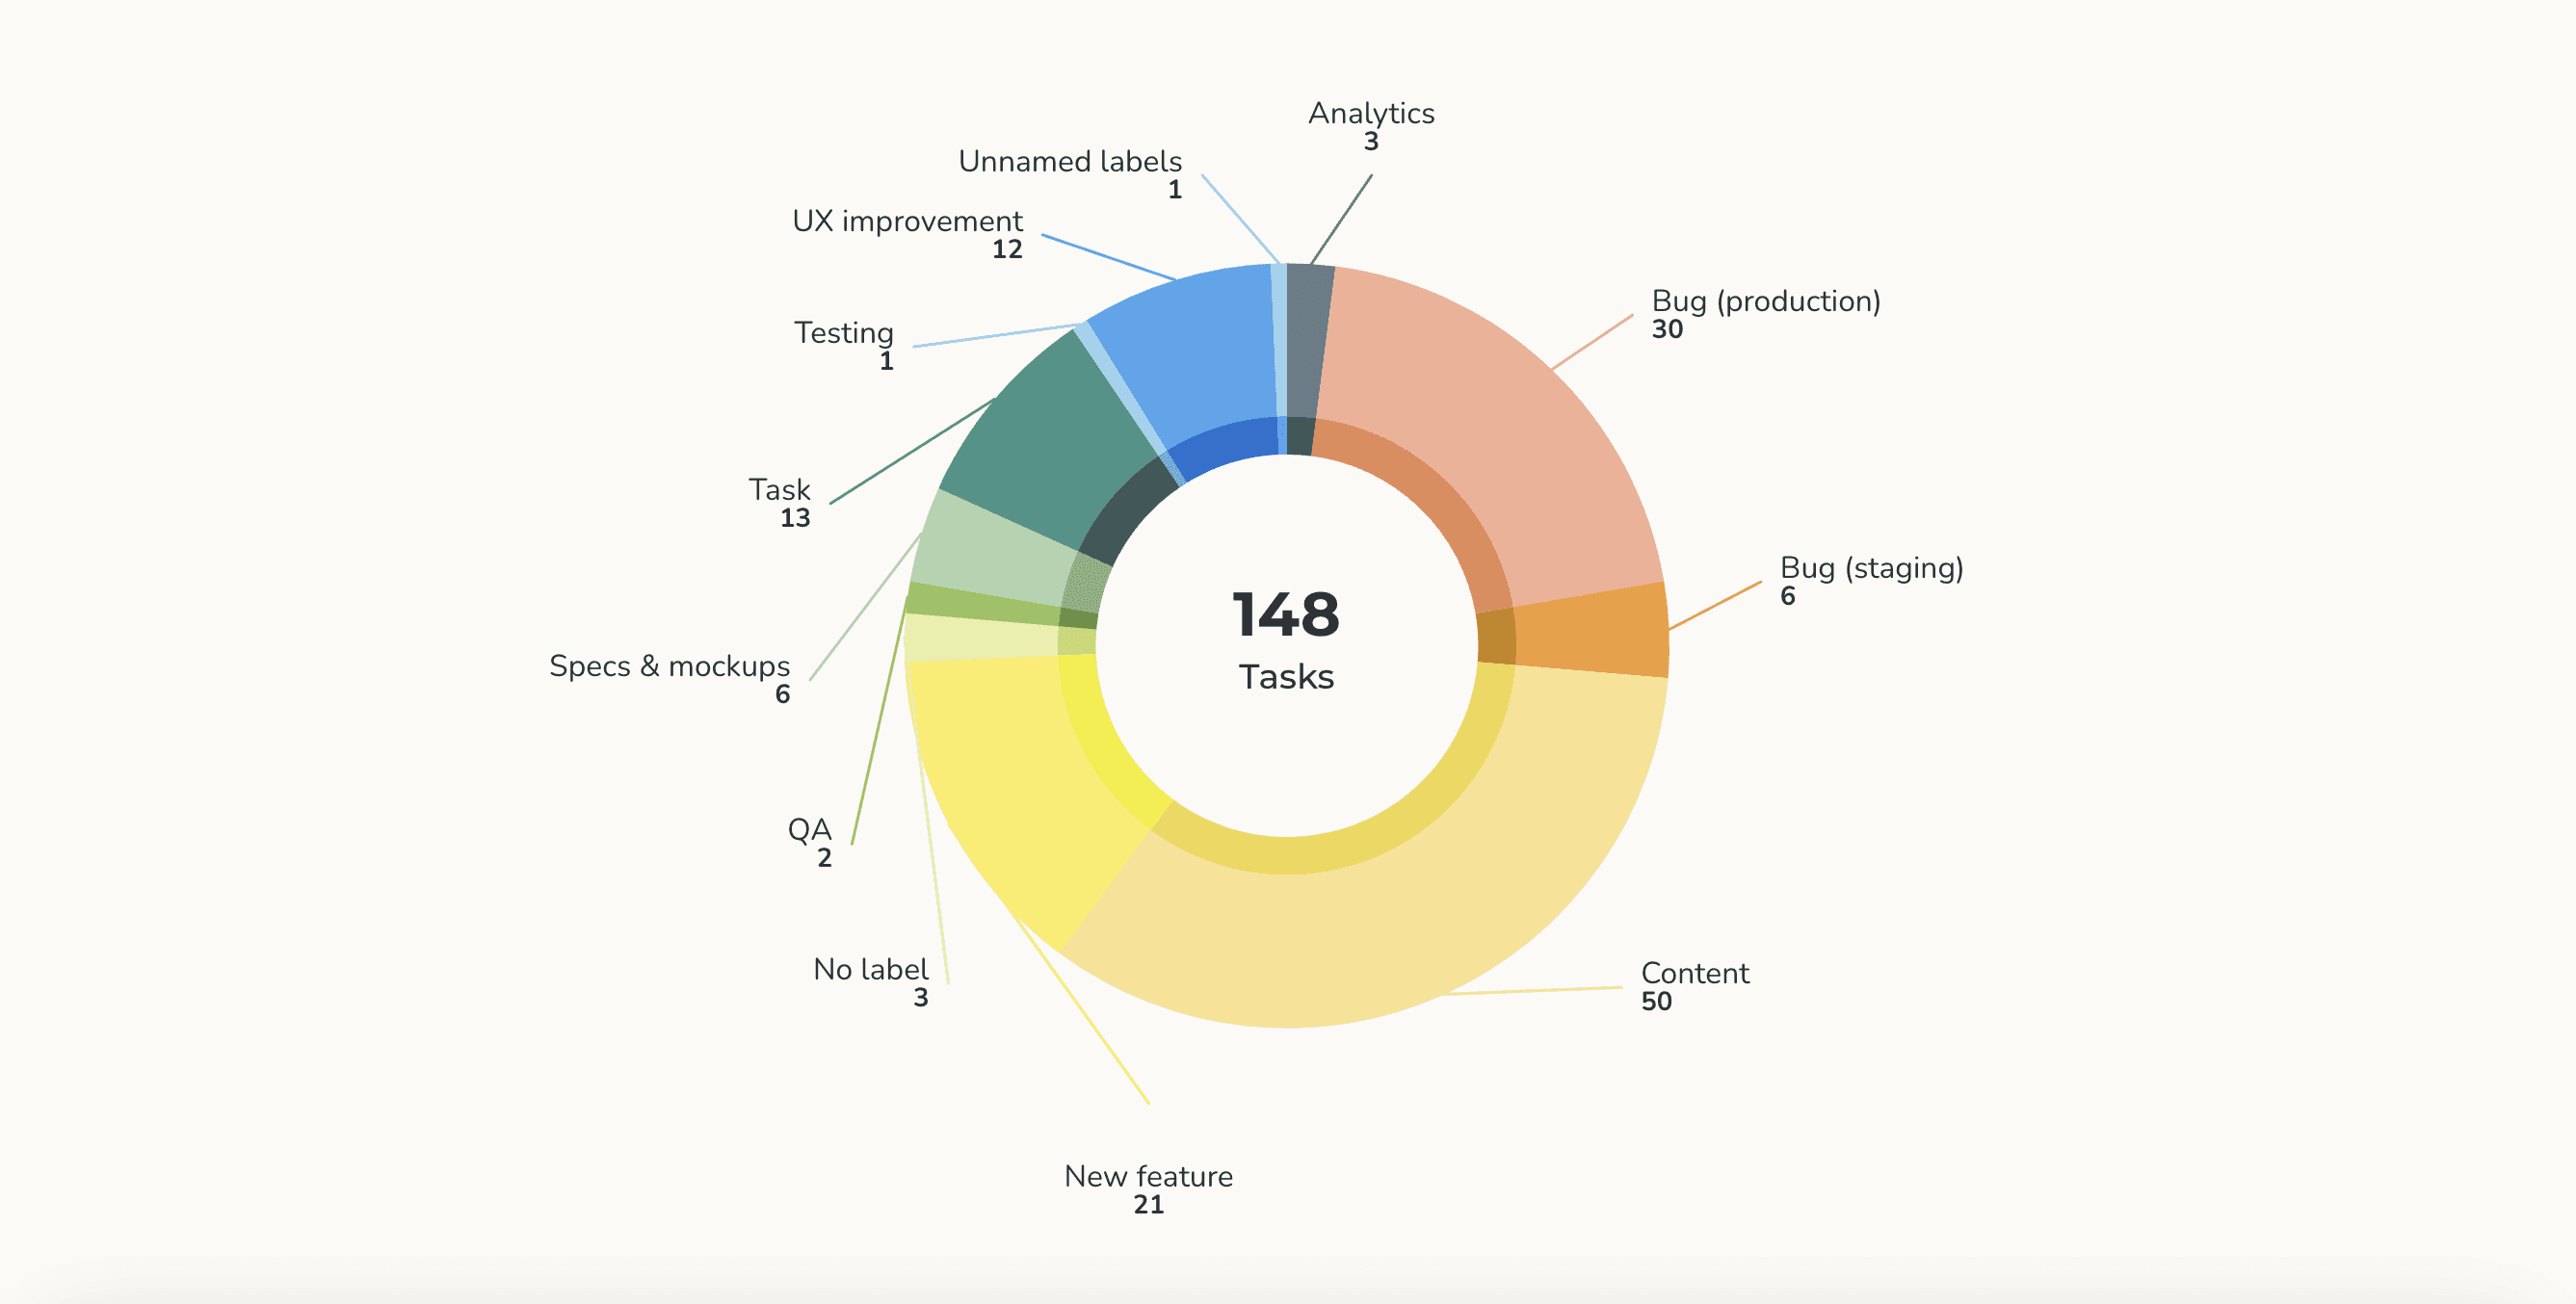
Visualize your data like never before


Available on GitHub Marketplace
Análisis e Informes
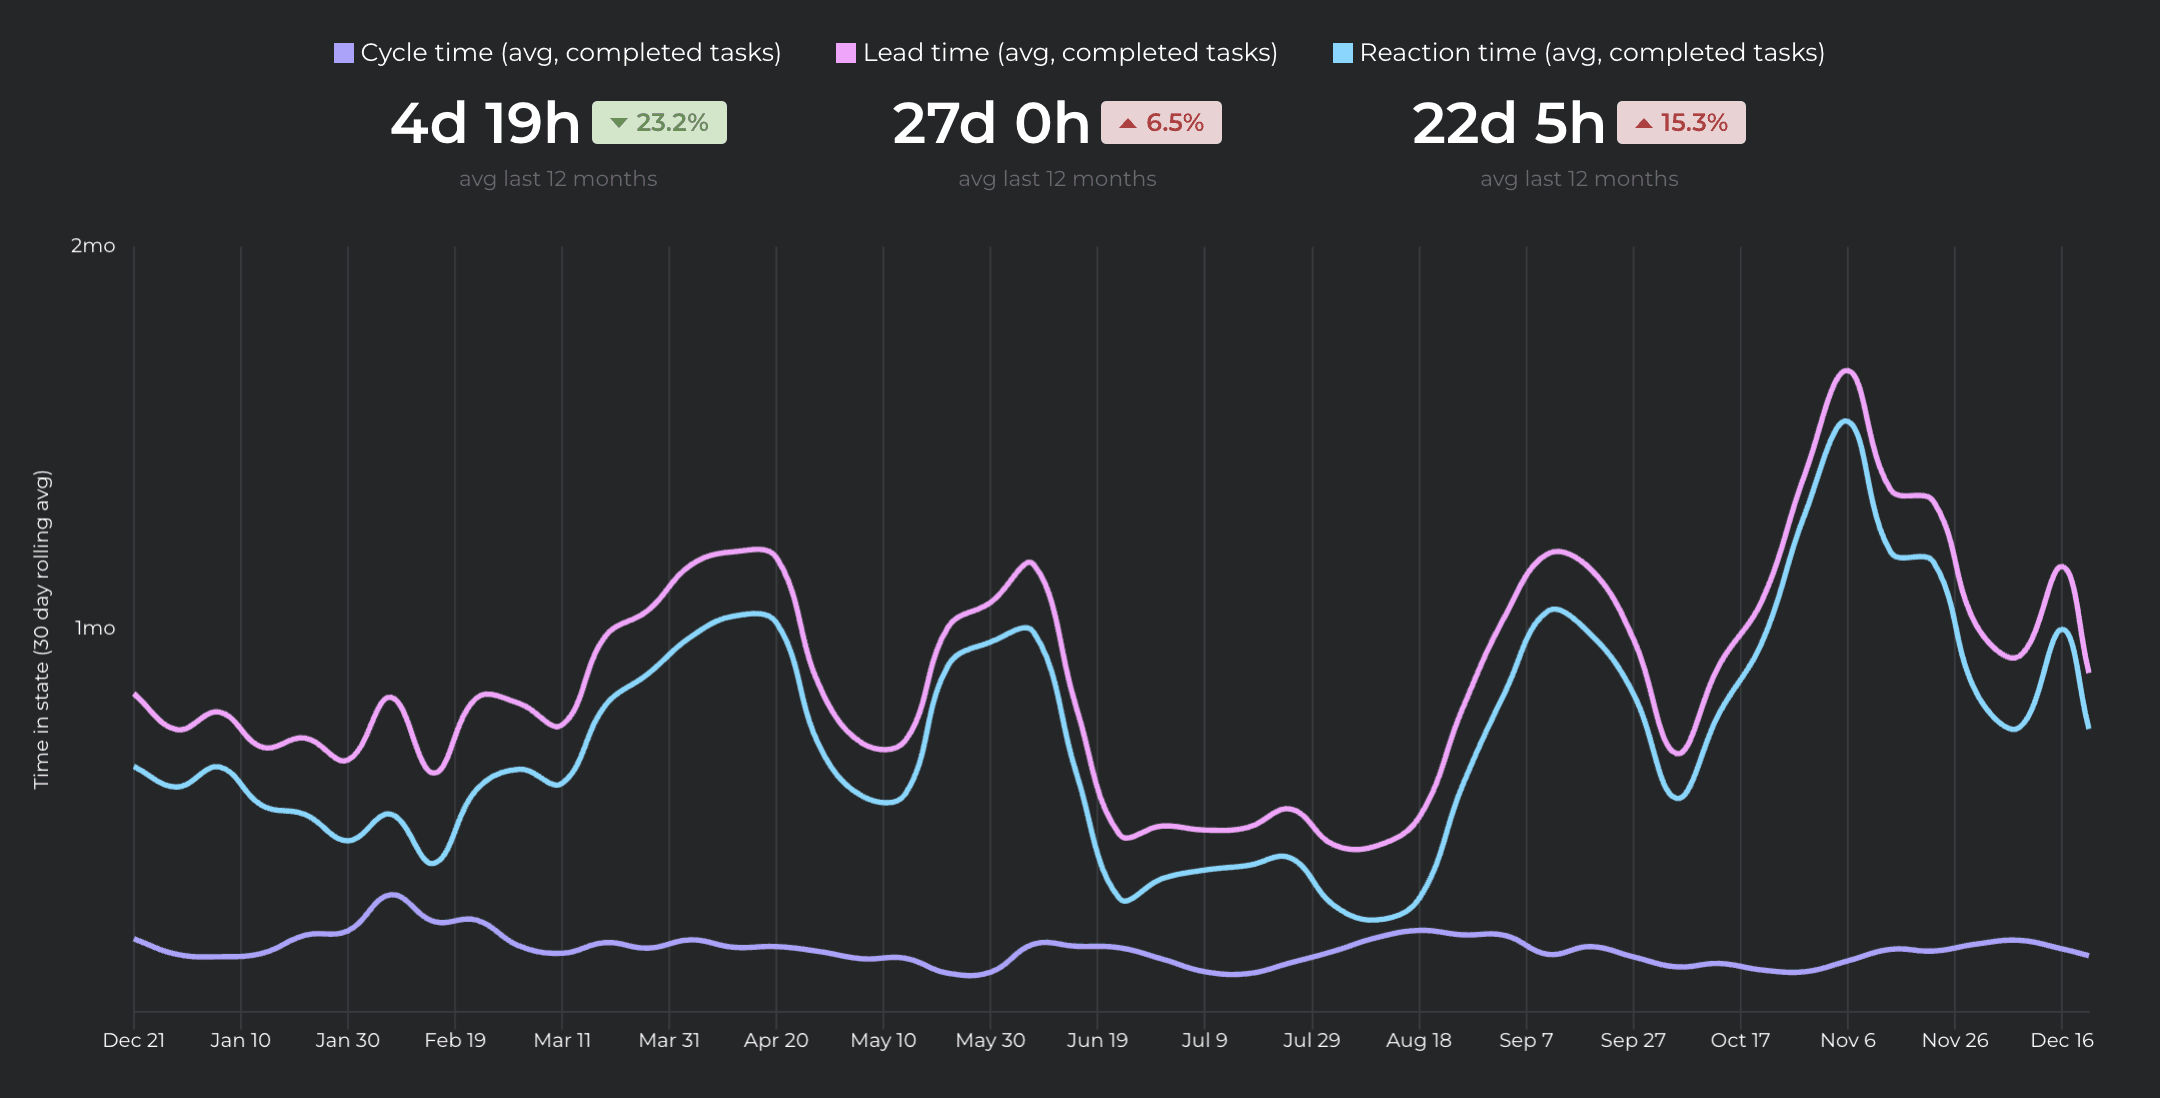
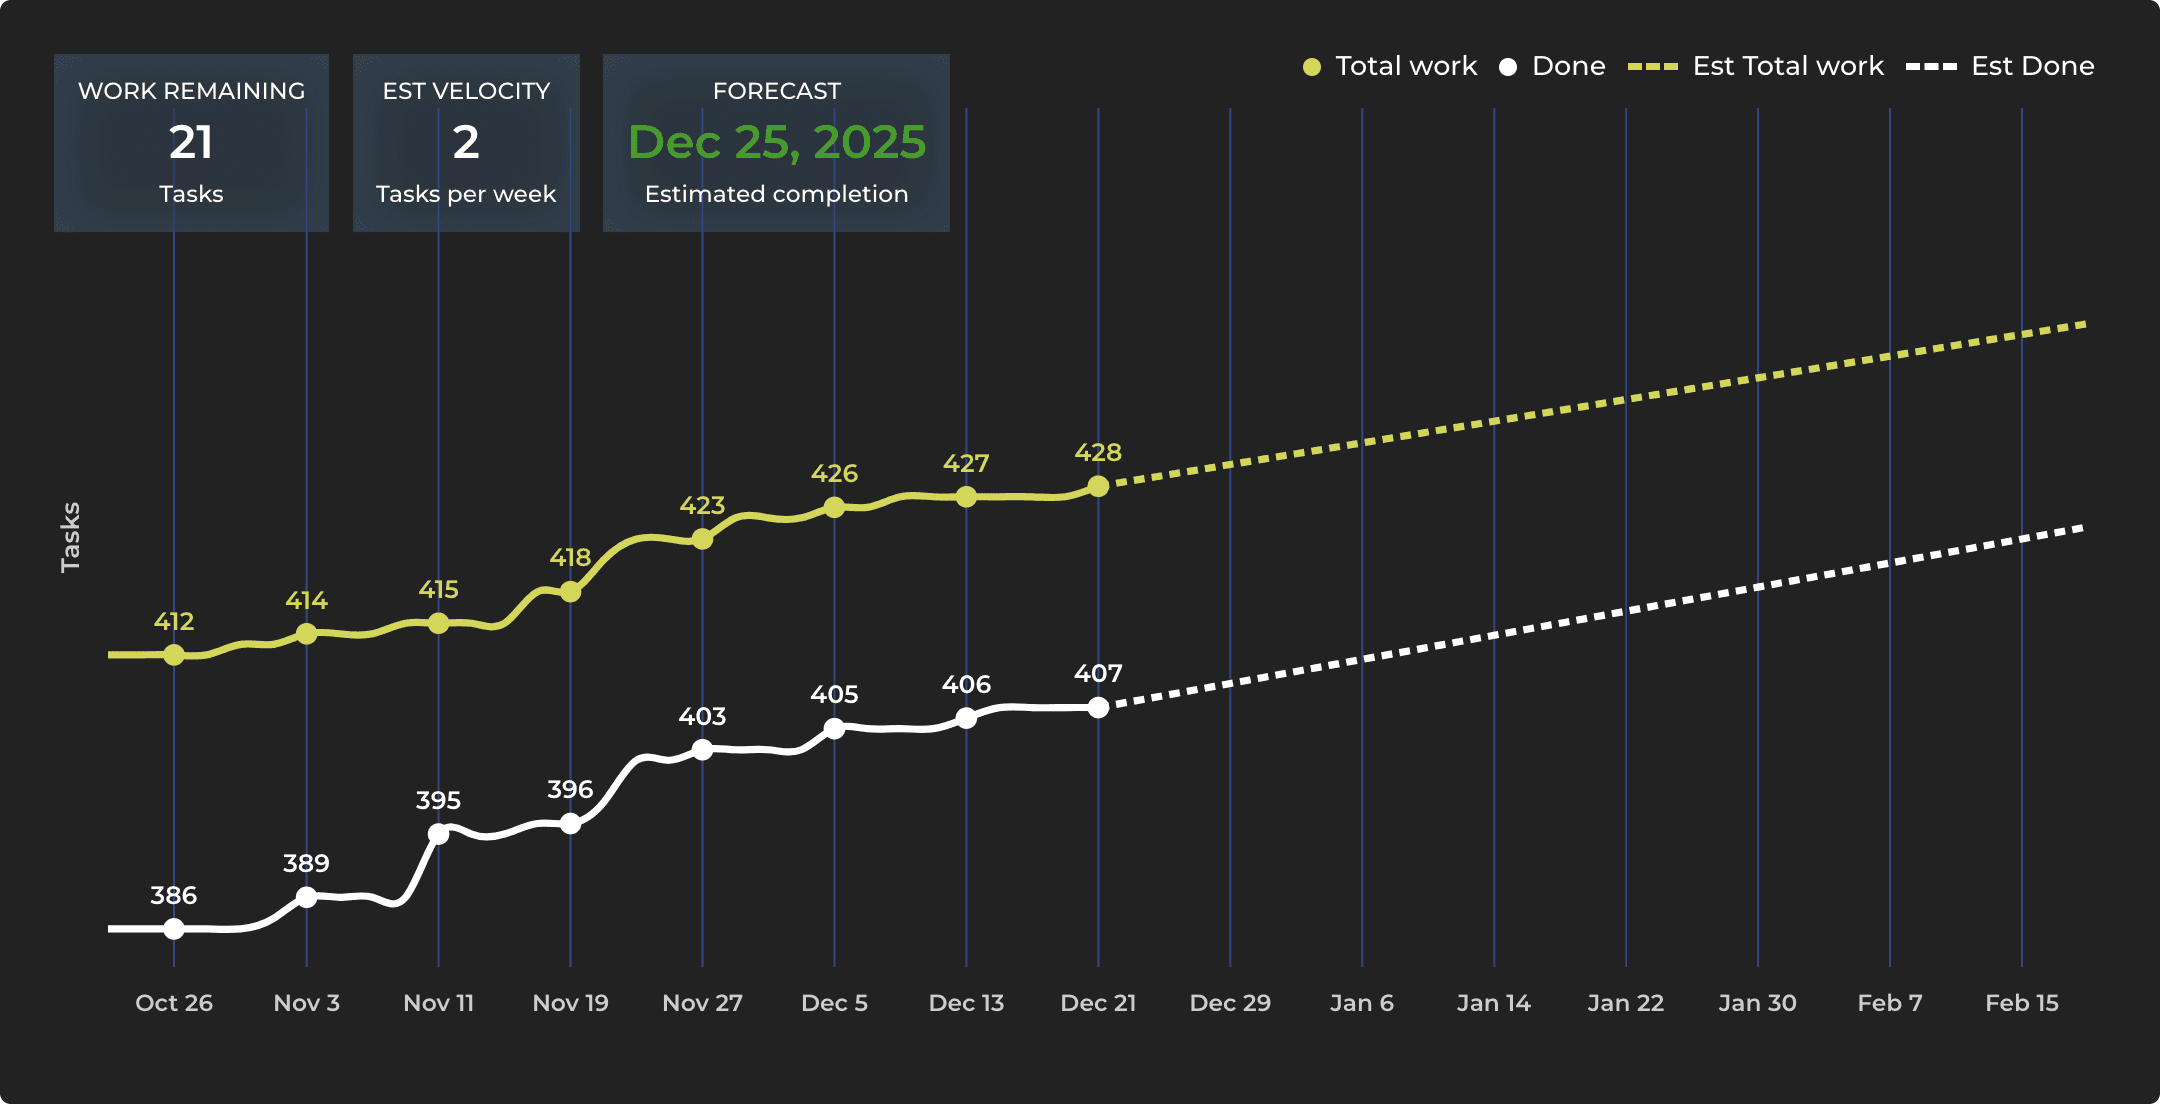
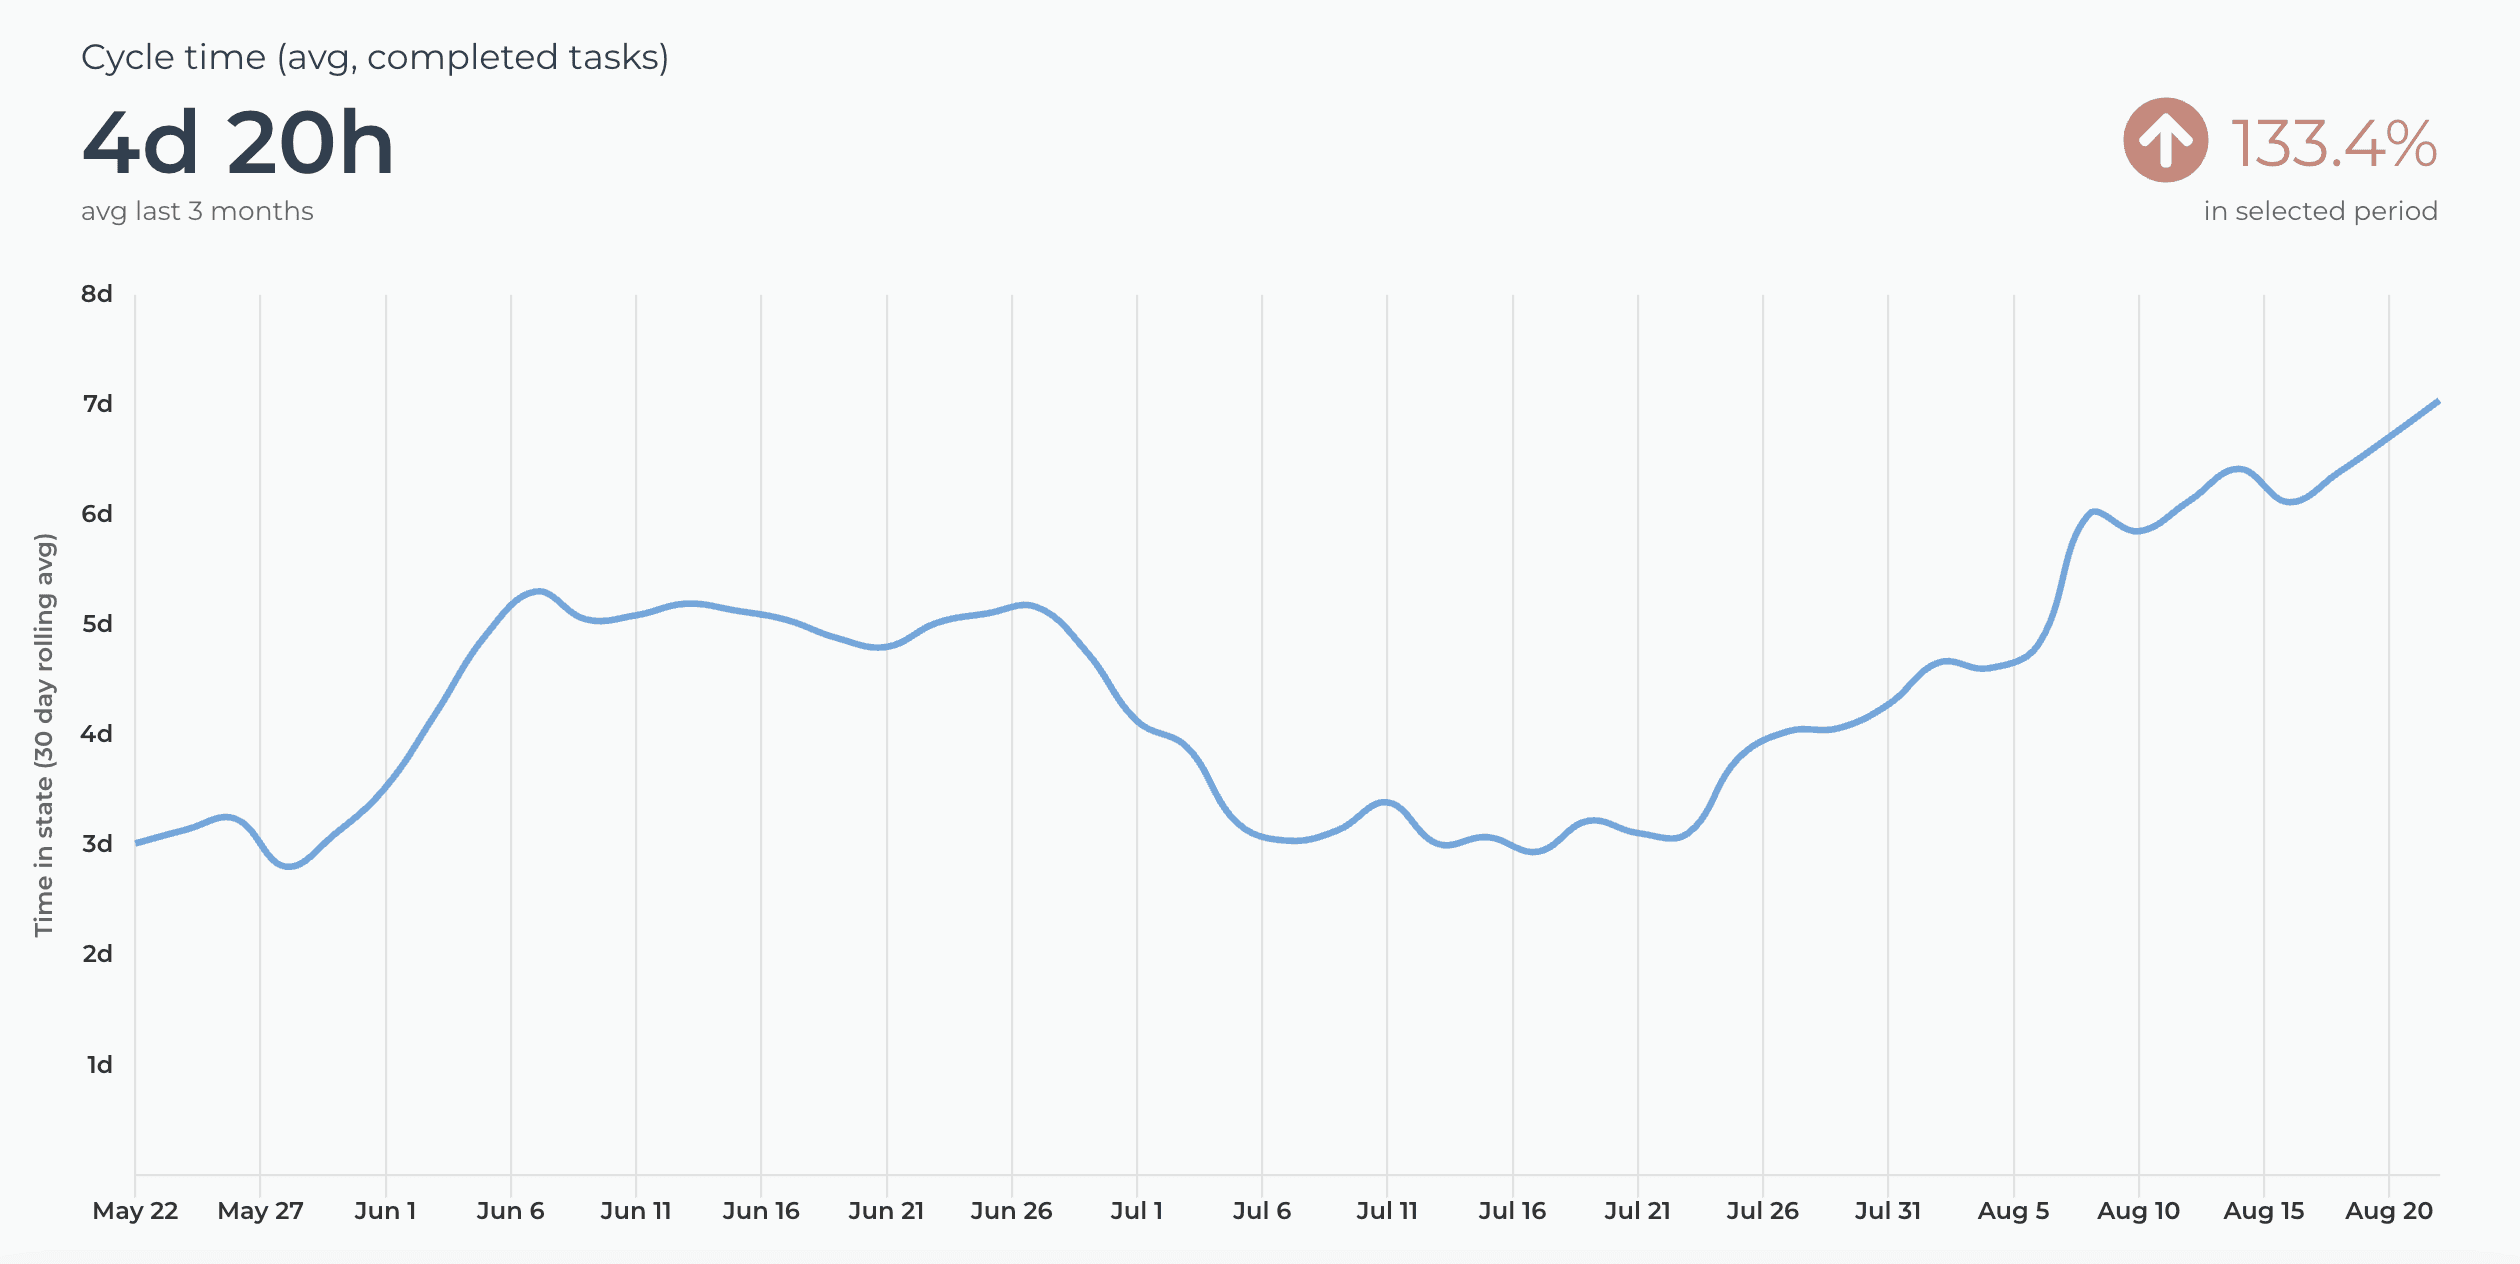
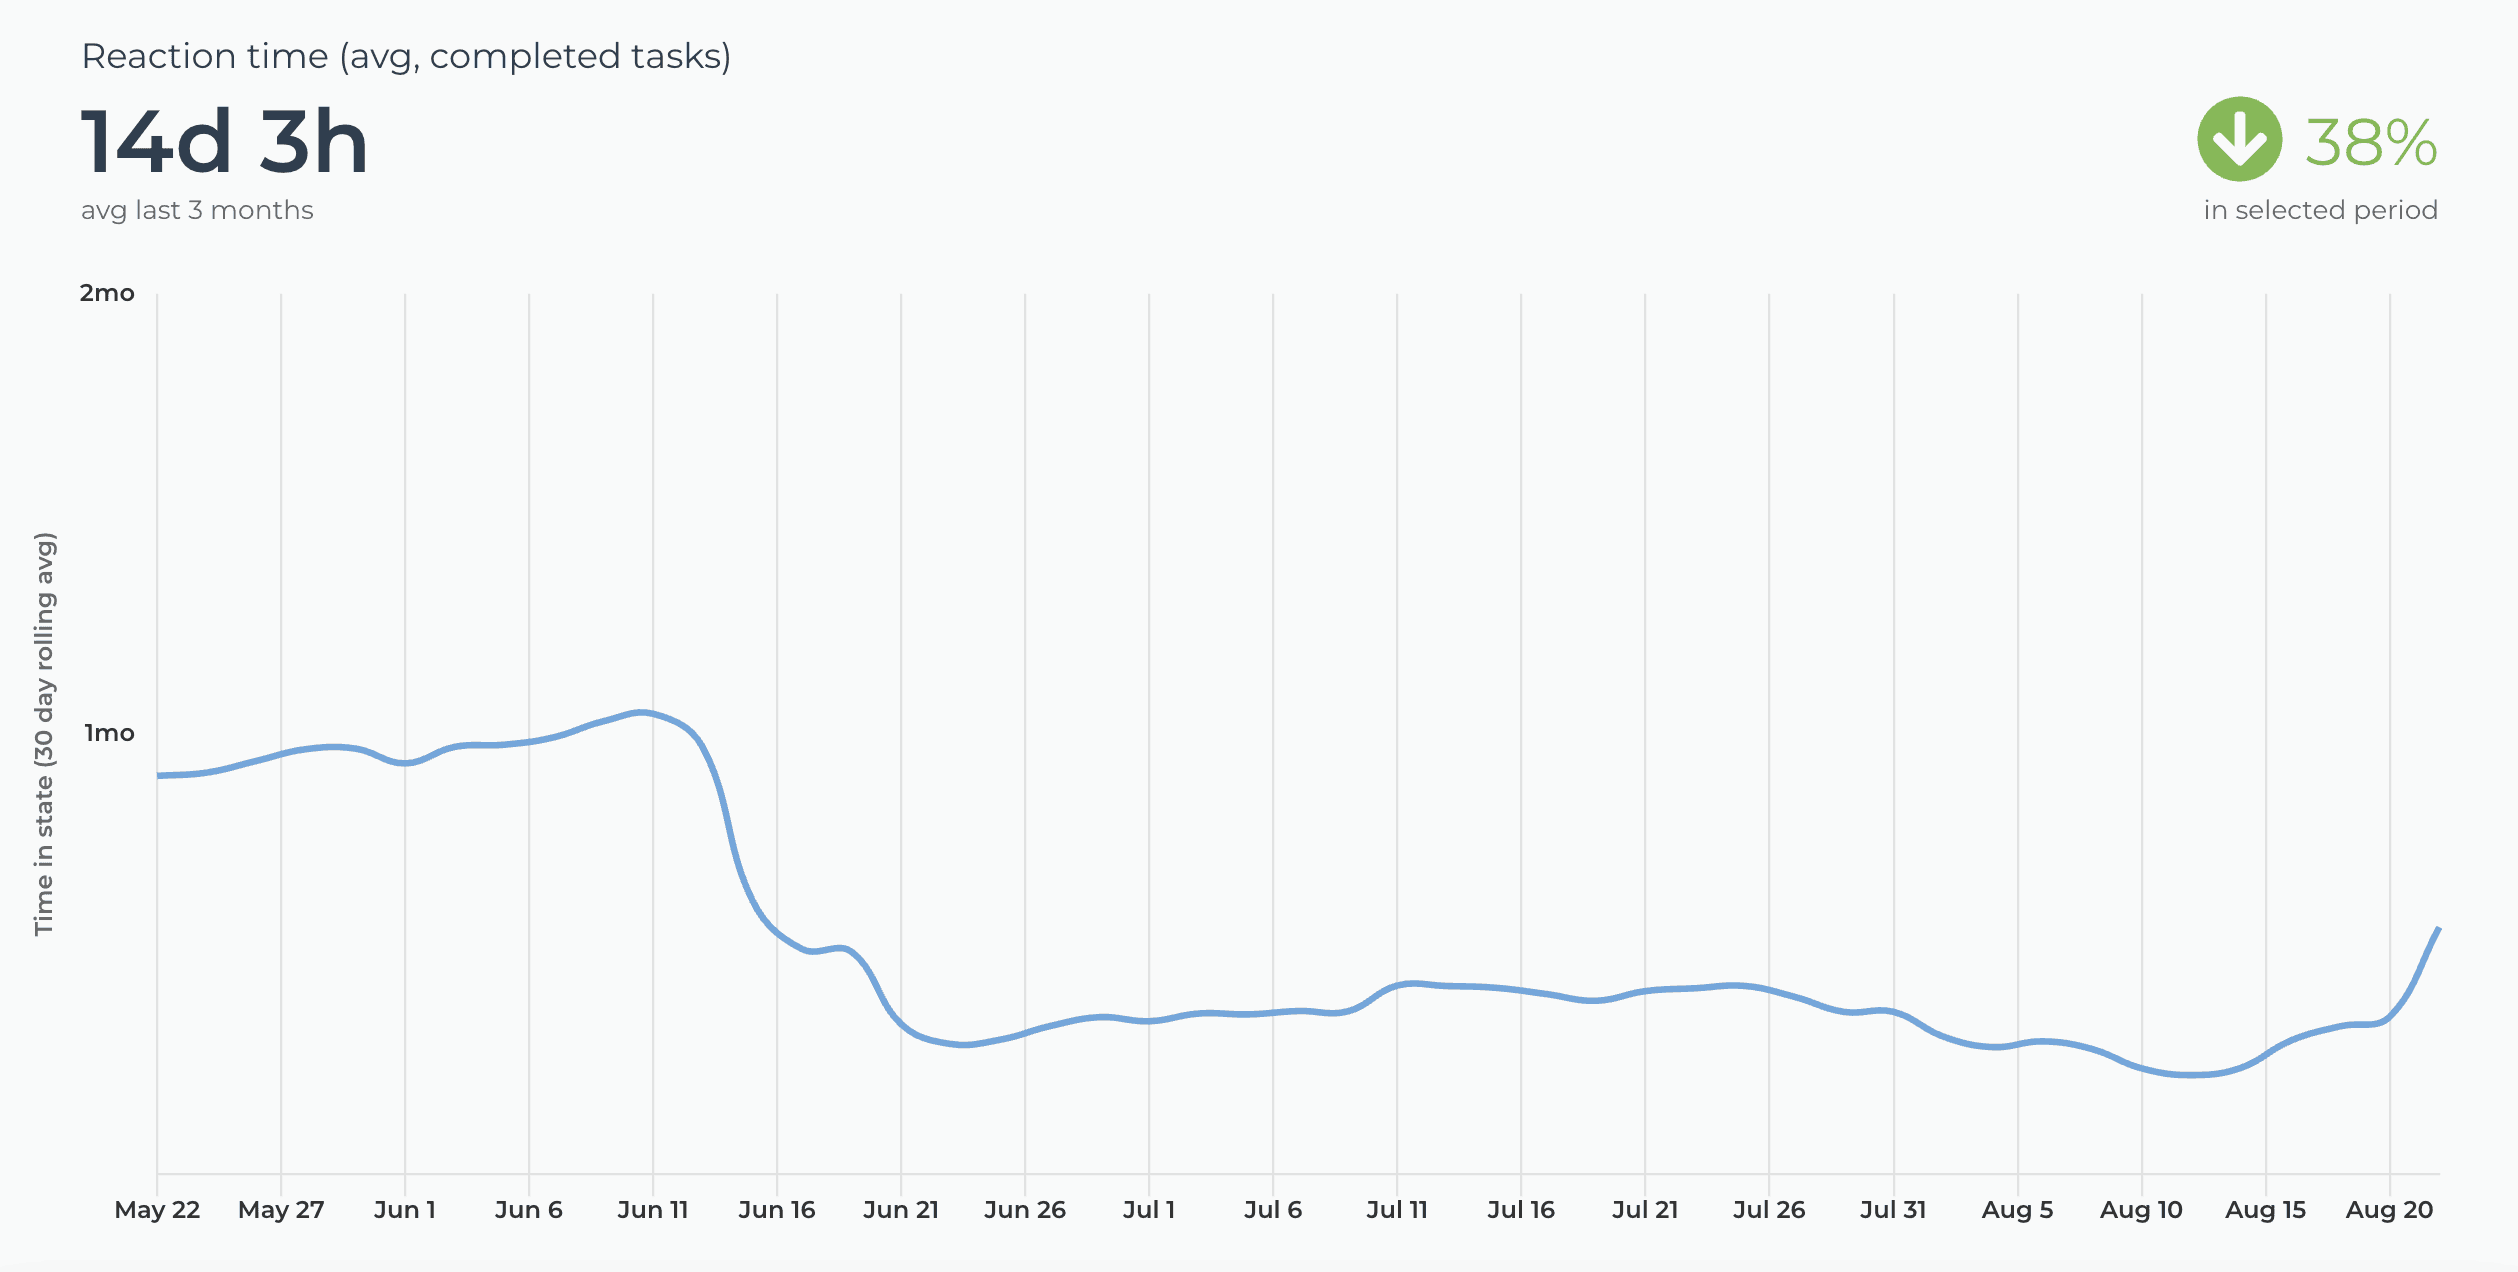
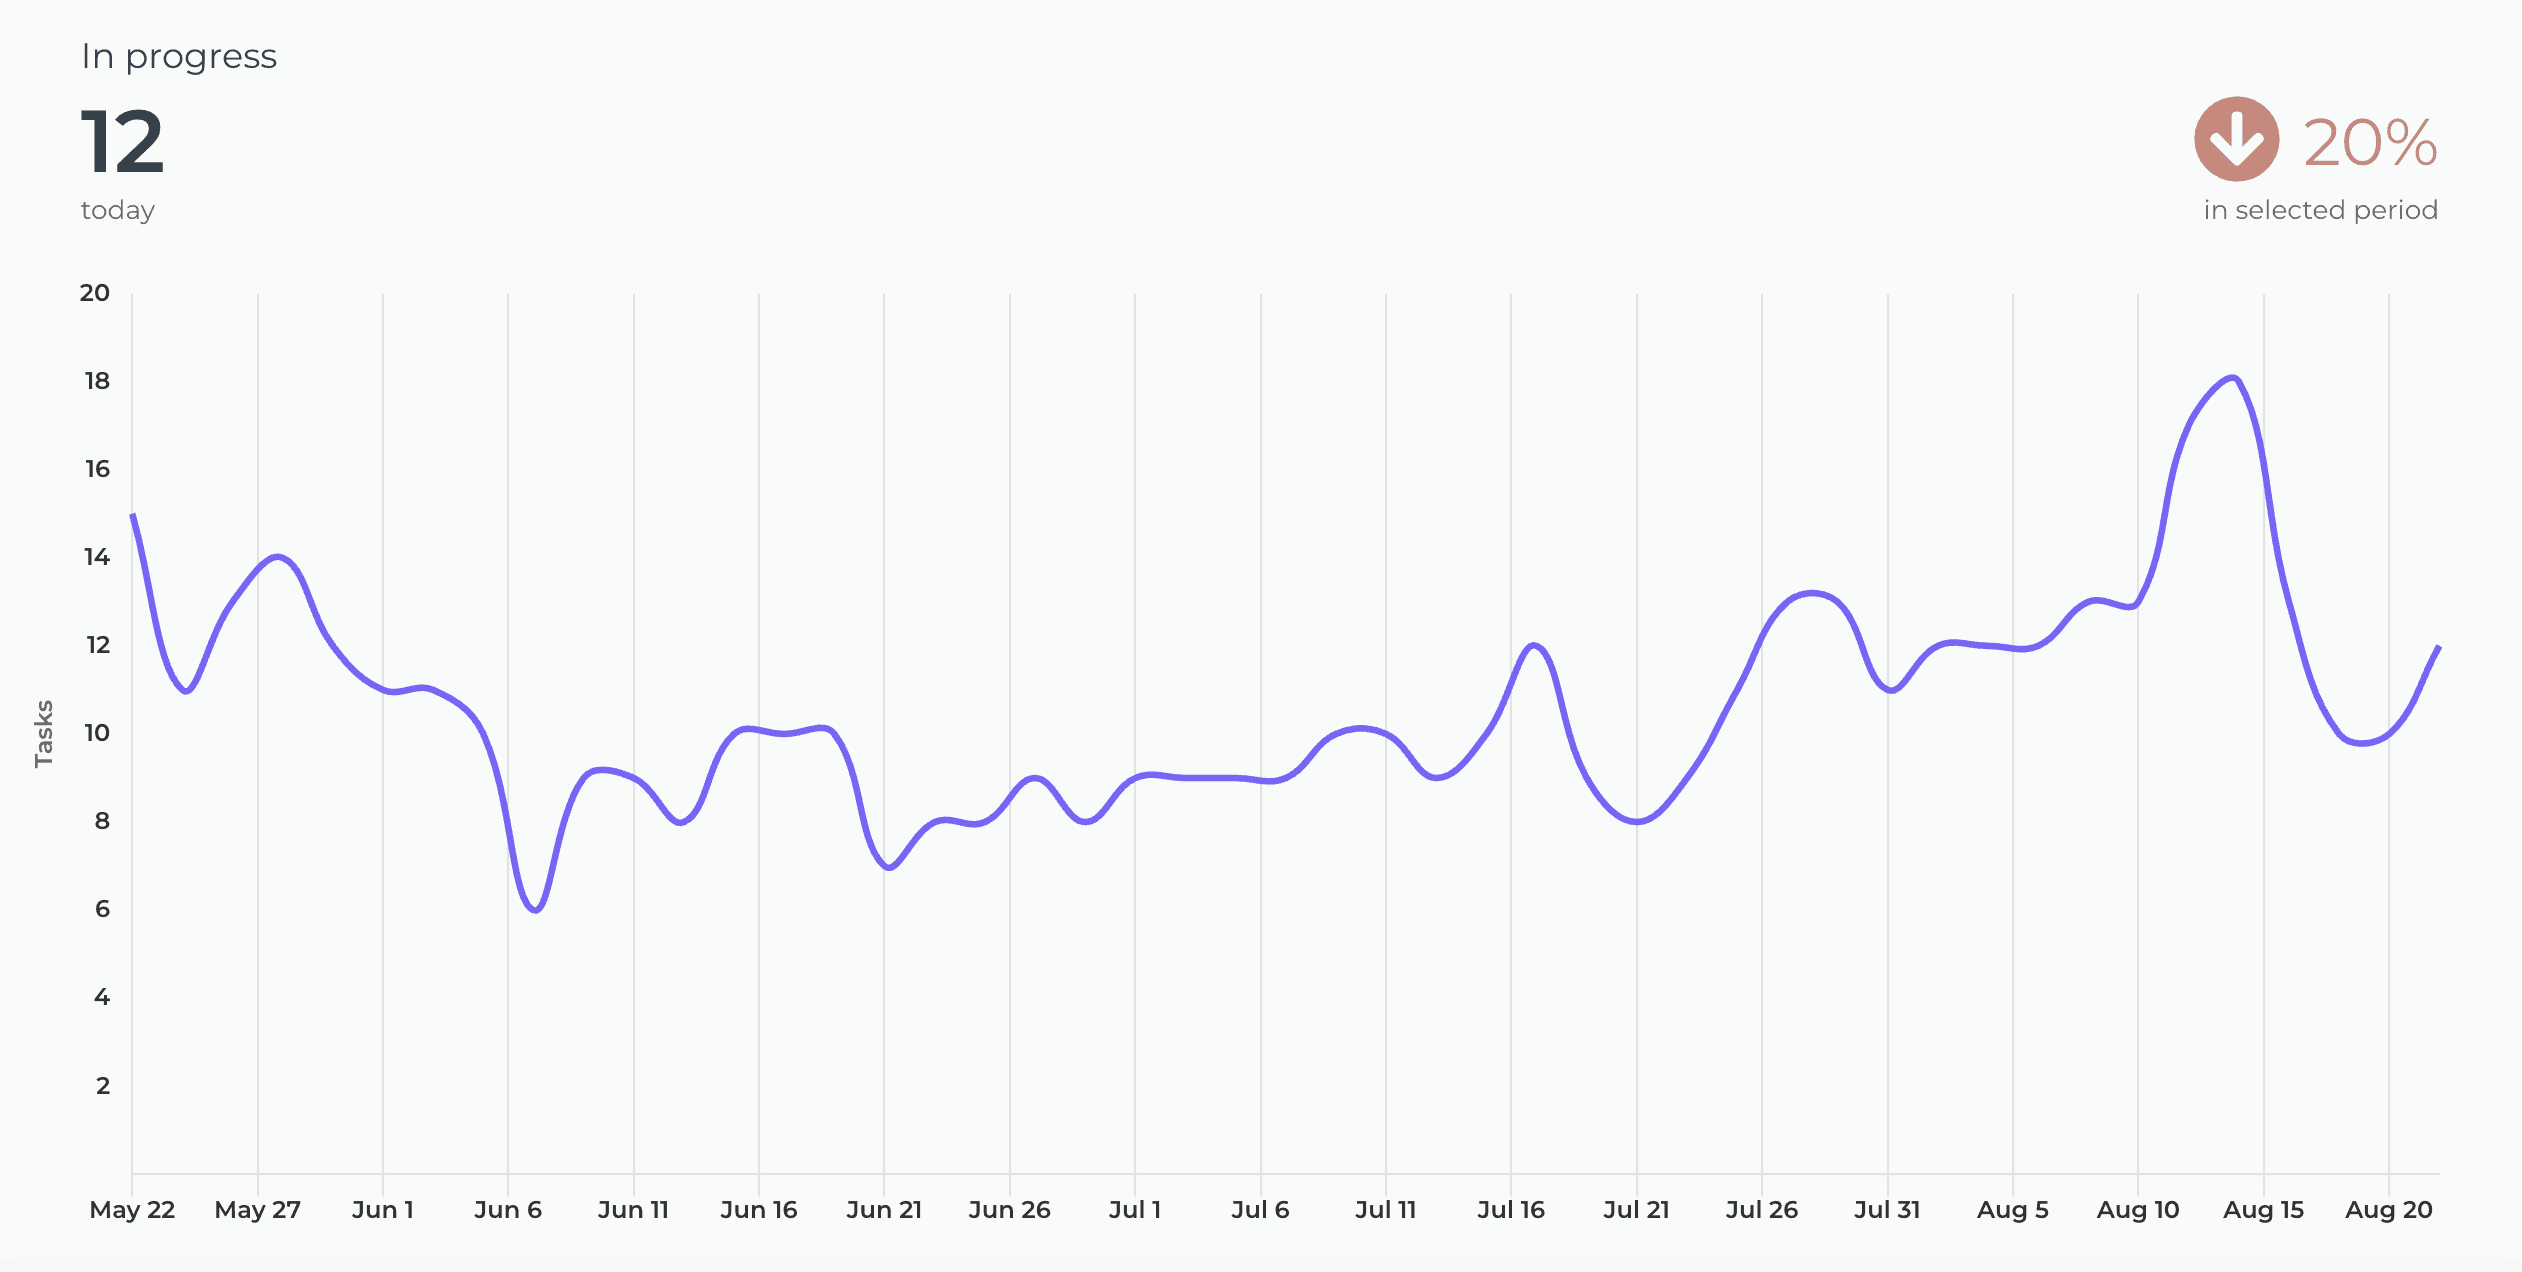
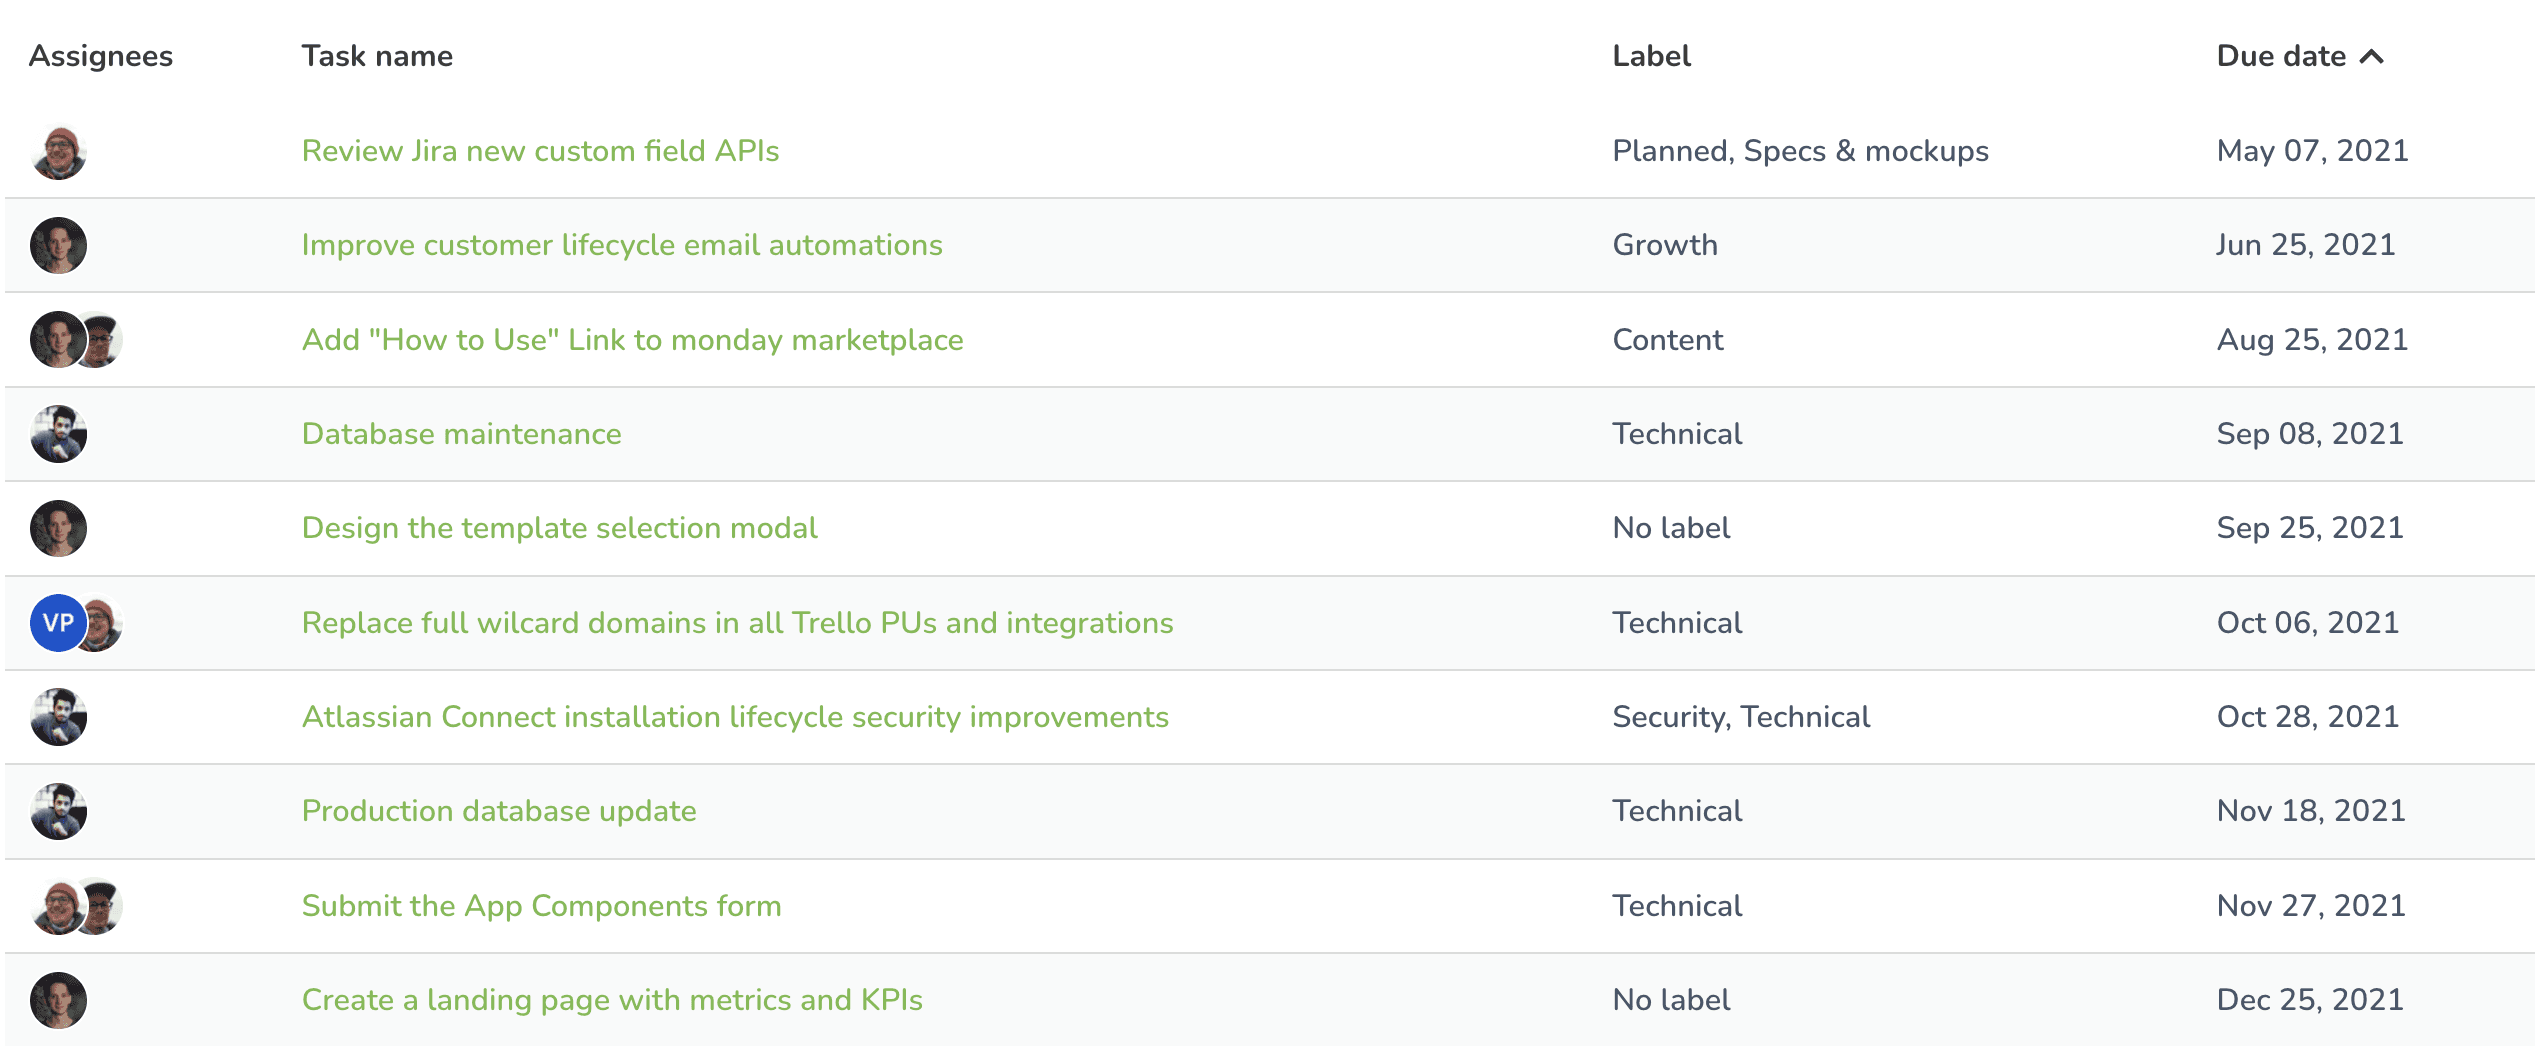
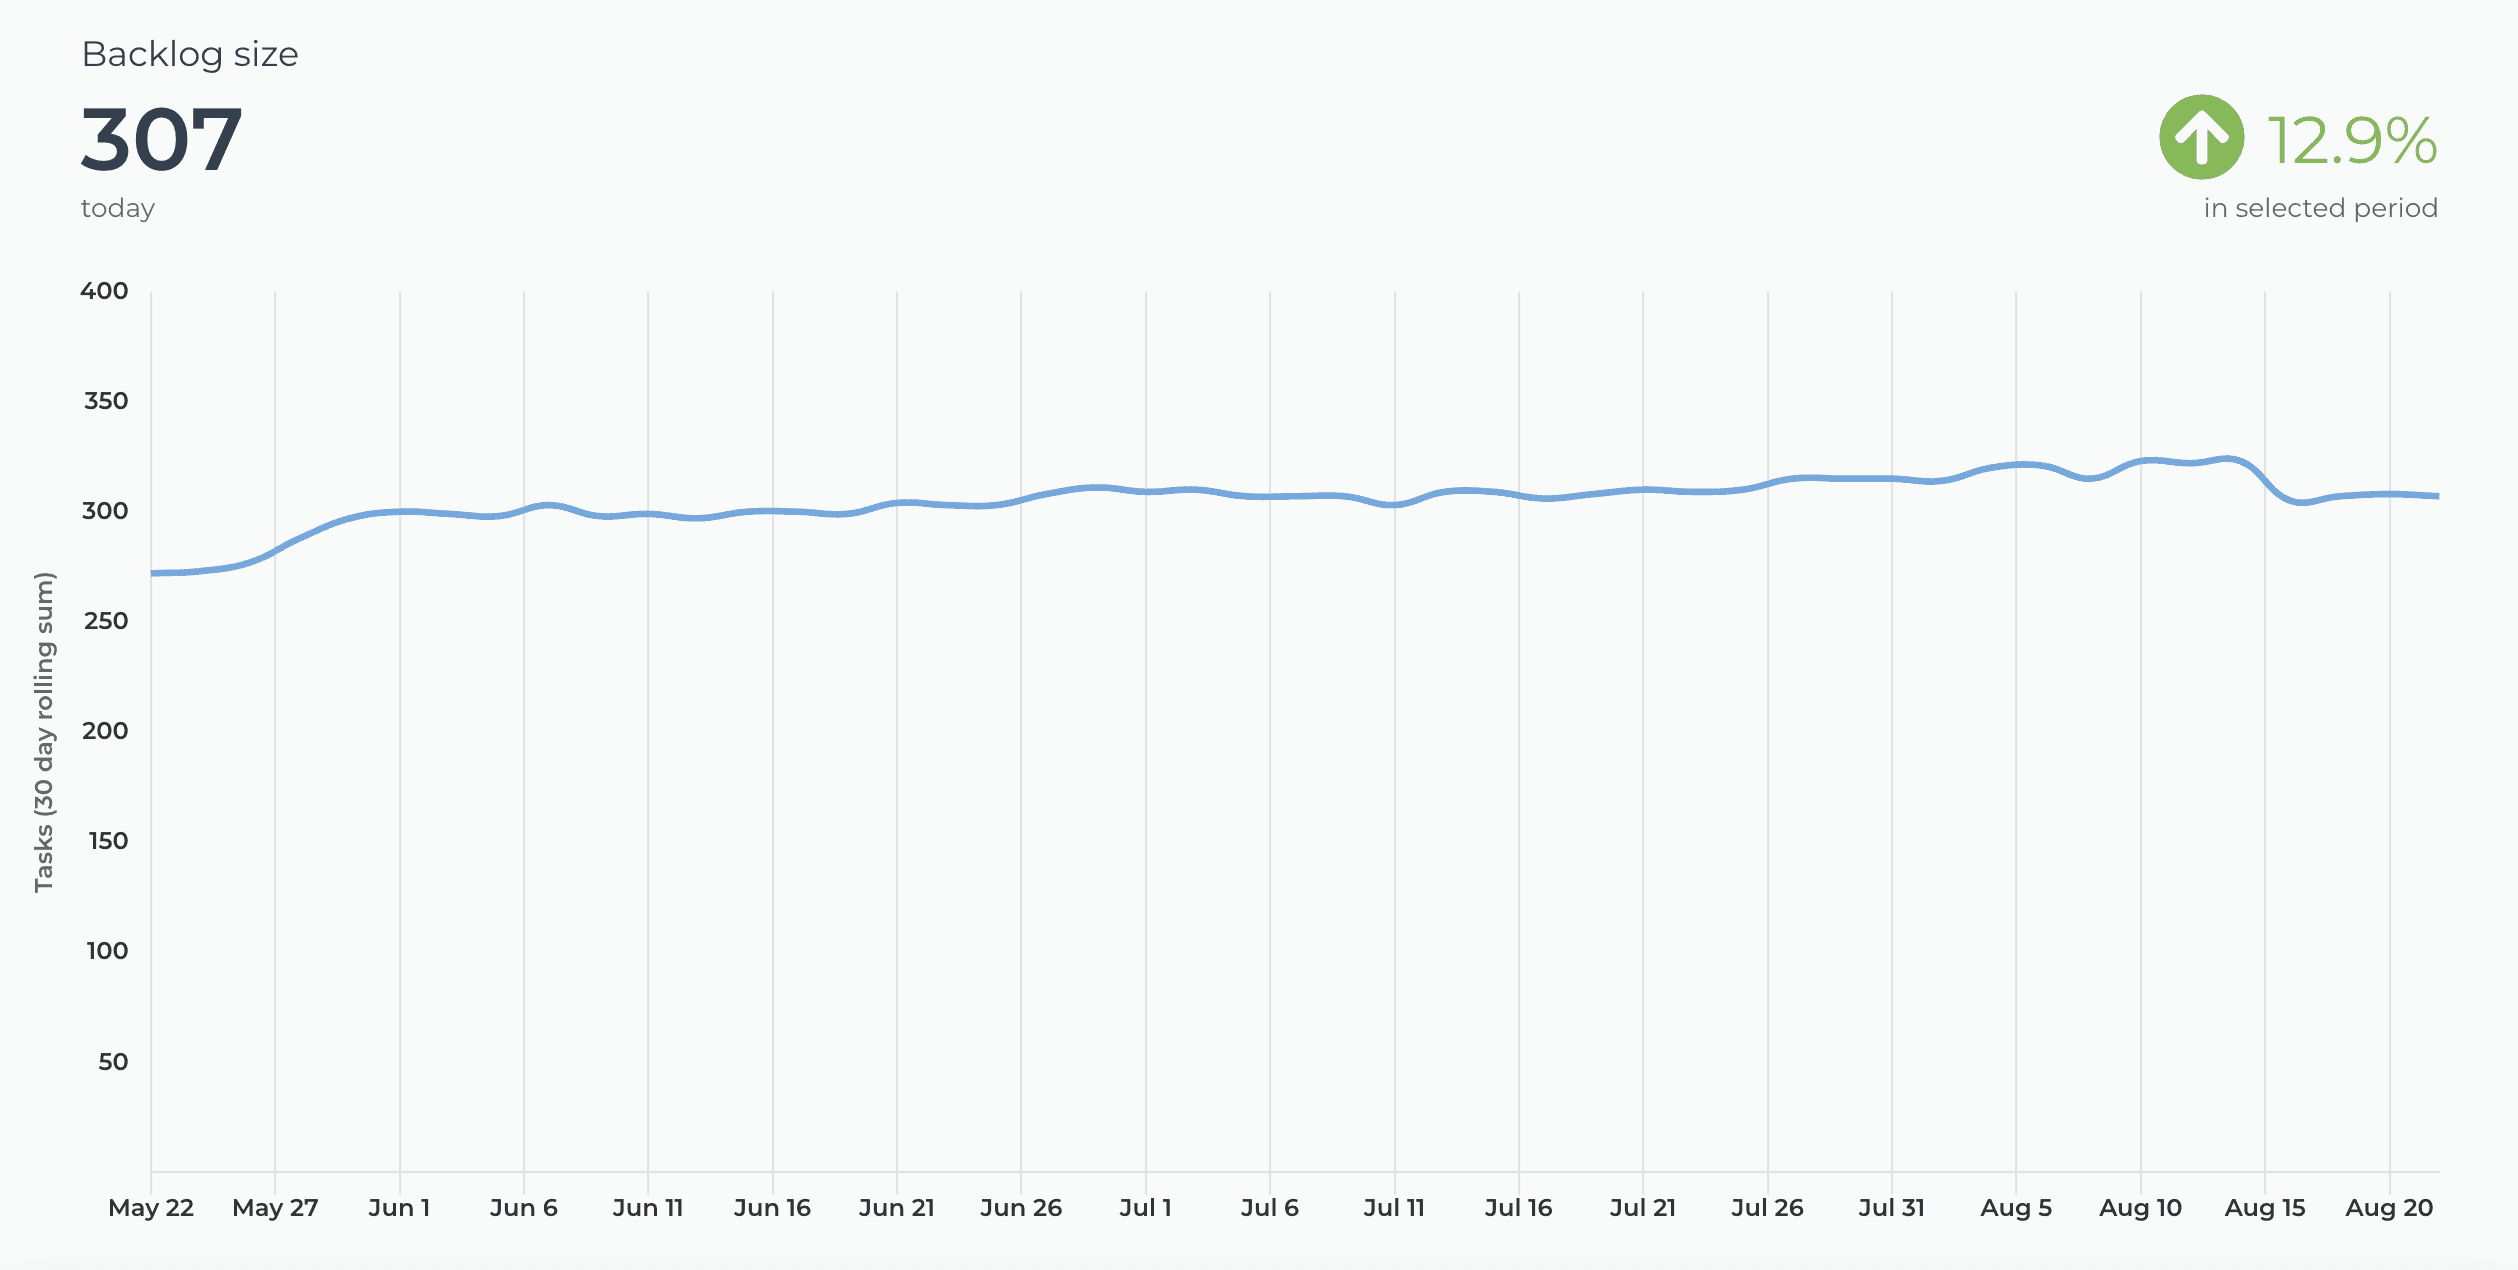
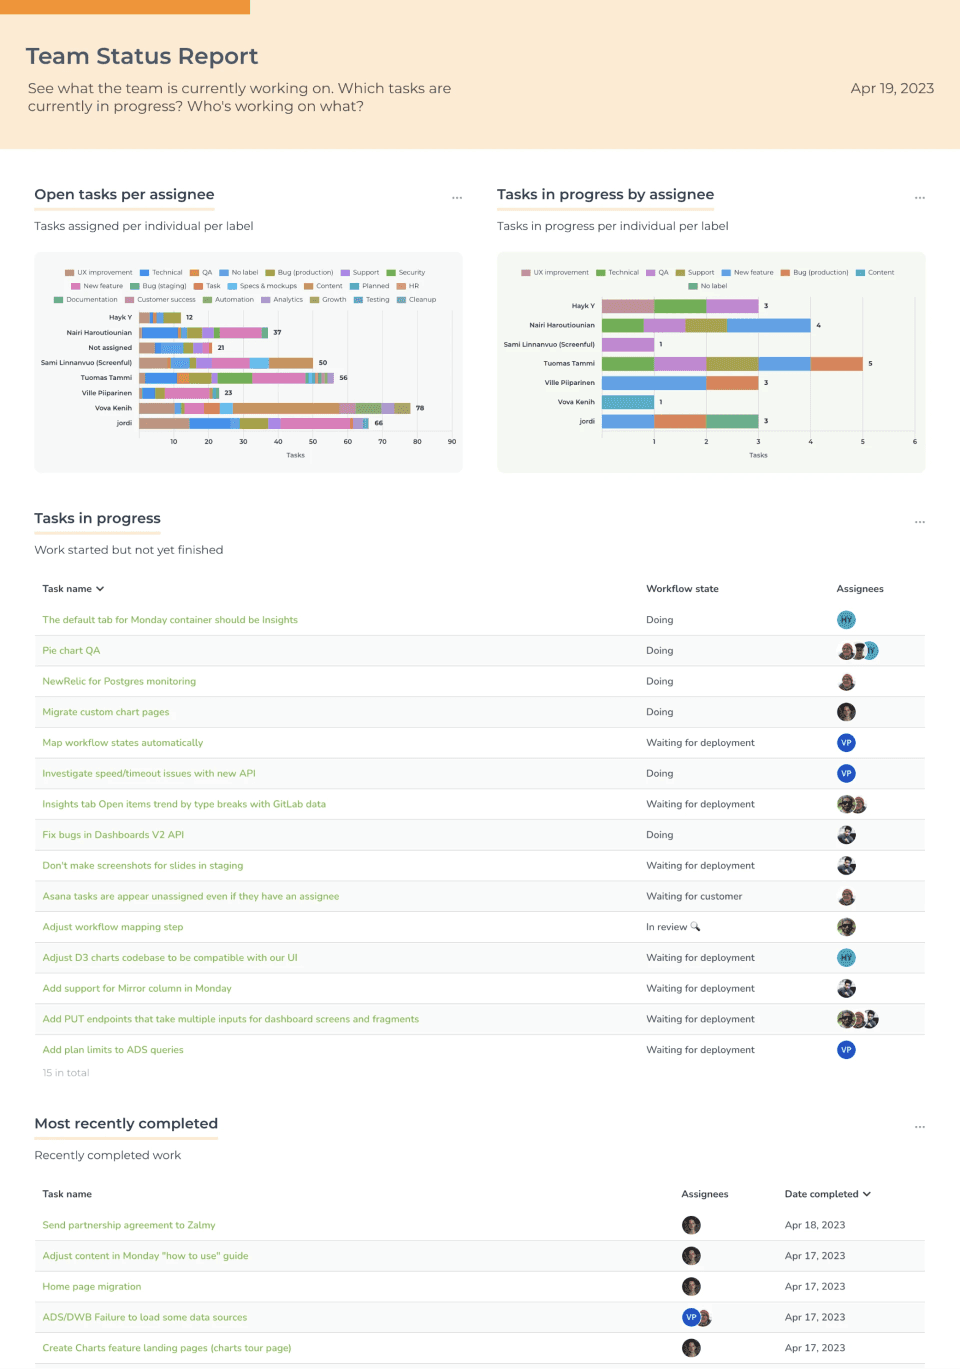
Obtenga información práctica de monday.com con informes automatizados y gráficos personalizables.
Apreciado por líderes de la industria


"Really good looking views and easy setup. Ideal for providing open visibility for the progress across the company."


Learn how to automate your GitHub reporting
Browse our recent blog posts and product updates


kit completo
De cero a valor en minutos con plantillas probadas
De cero a valor en minutos con plantillas probadas


FAQ
Preguntas comunes
Do you support GitHub Projects?
Yes, we support both user-owned and organization-wide project boards as well as repository project boards. You can import both classic and new projects.
Notice that we cannot measure the cycle time by workflow state for the new GitHub projects due to a lack of API support. The state transition history is provided for classic projects but not for new projects. You can learn more and upvote the issue in the GitHub forum.
Do you provide code level metrics?
We don't access your source code and therefore don't support any code level metrics (line count, code churn etc.).
We don't access your source code and therefore don't support any code level metrics (line count, code churn etc.).
How can I view only issues or pull requests?
When you import a data source, all data is imported and made available for reporting. You can narrow the data to any subset by setting a filter. For example, you can filter out issues or pull request by using 'Type' filter.
When you import a data source, all data is imported and made available for reporting. You can narrow the data to any subset by setting a filter. For example, you can filter out issues or pull request by using 'Type' filter.
What access does your GitHub App require?
The Analytics & Reports GitHub App requires read-only access to issues, members, metadata, organization administration, organization projects, pull requests, and repository projects.
The Analytics & Reports GitHub App requires read-only access to issues, members, metadata, organization administration, organization projects, pull requests, and repository projects.
What access does your OAuth app require?
The Analytics & Reports OAuth app requires these OAuth scopes:
"read:org"
"repo" or "public_repo" (depending on whether user selects "authorise public repos only" or "authorize public and private repos”
An OAuth token will share the permissions of the user that authorized the application. That means, if your account authorizes the application and has 'write' permission to a repository, the token will also have 'write' permission to that repository. This is how OAuth tokens work in the GitHub platform.
From a security point of view, we recommend using the GitHub app instead of the OAuth app.
Can I switch my current OAuth app to GitHub App?
You can’t switch an existing Screenful account from OAuth to GitHub App. To use the GitHub App, you need to create a new Screenful account.
You can’t switch an existing Screenful account from OAuth to GitHub App. To use the GitHub App, you need to create a new Screenful account.
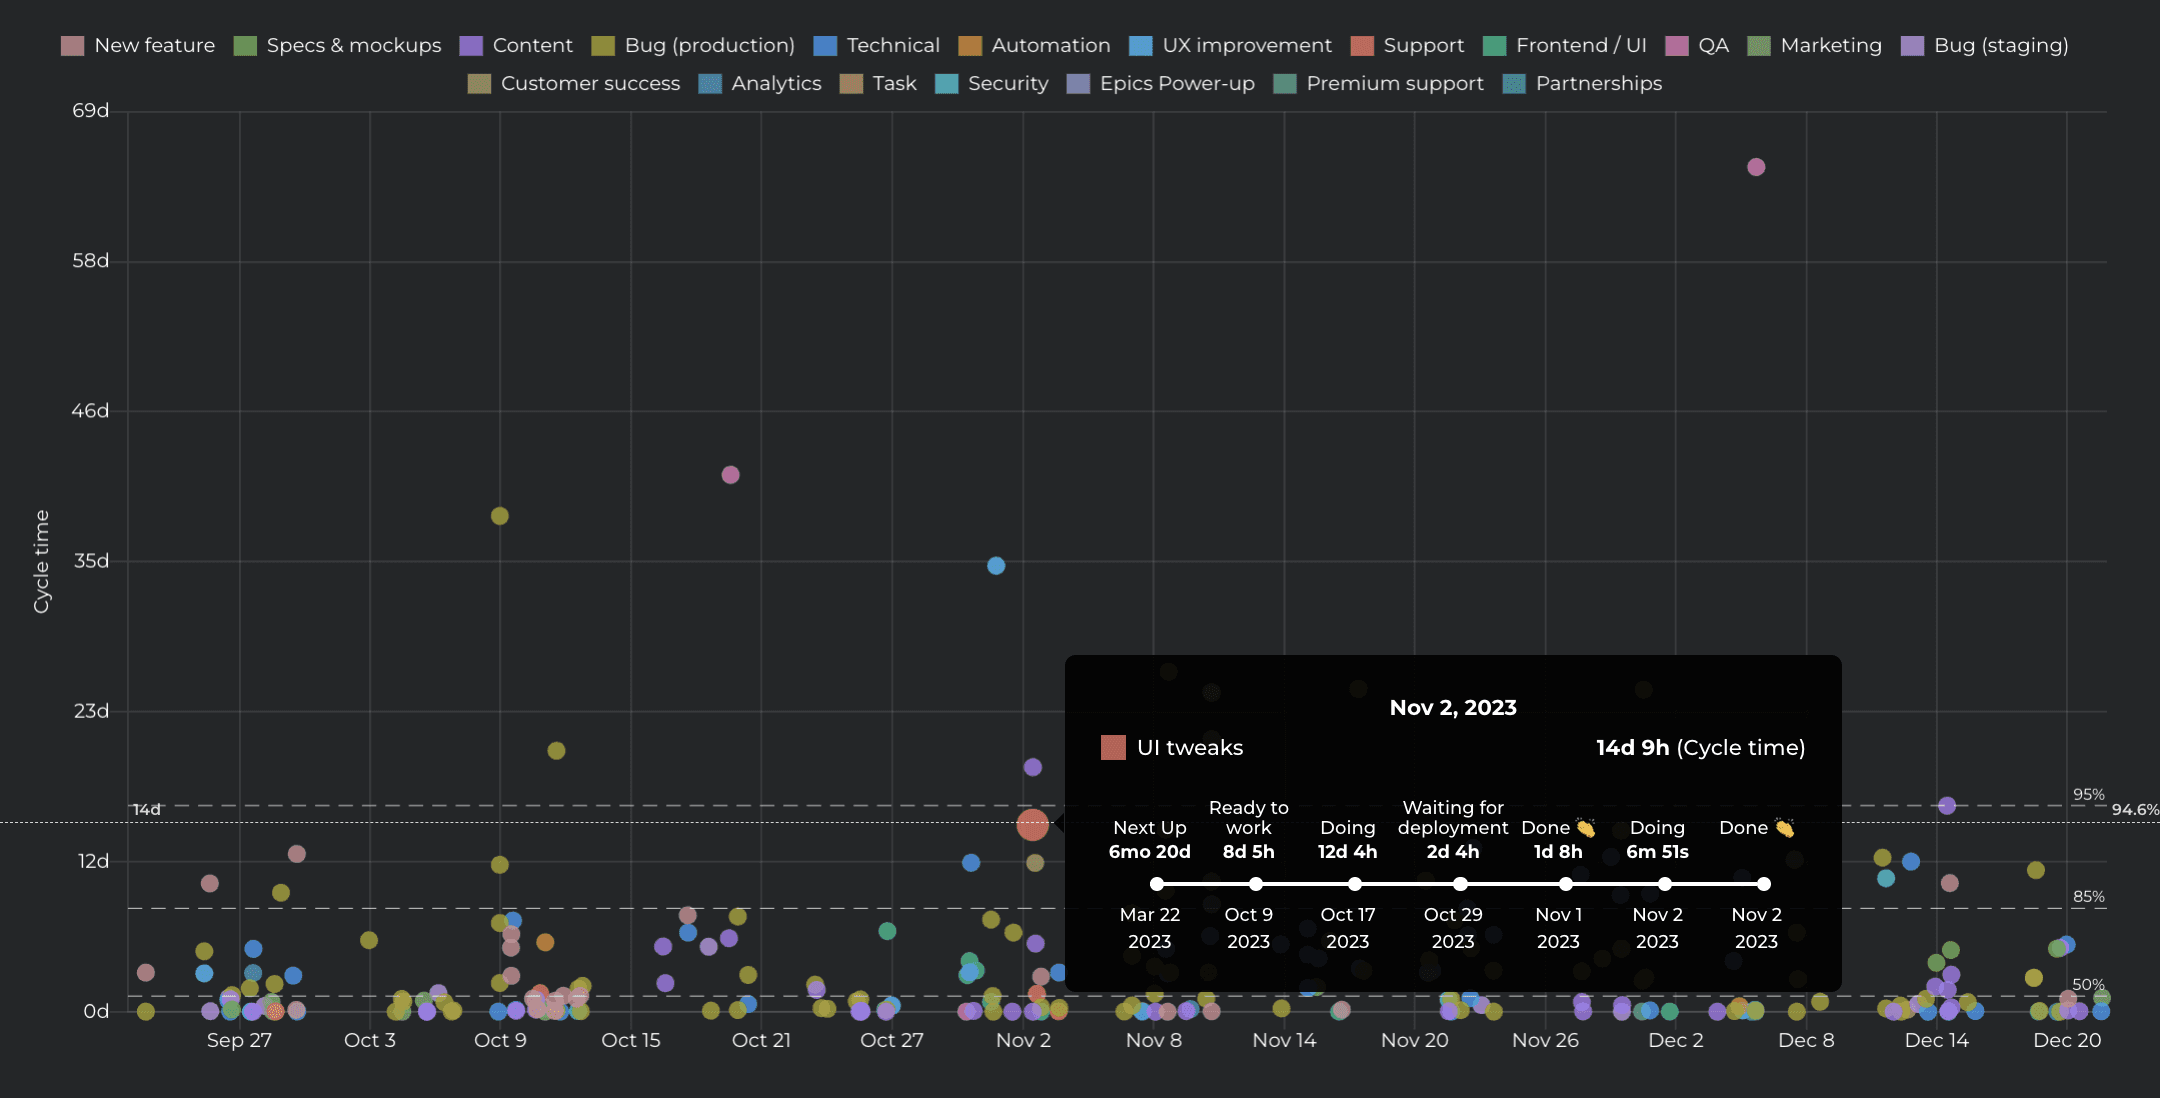
How are the lead and cycle times calculated in GitHub?
When importing project boards, you can specify your workflow based on the columns on the board which you can configure in the workflow settings. You can learn more from the Lead Time FAQ.
When importing repositories, the timing metrics are calculated as follows:
Lead time starts when an issue is created
Cycle time starts when the issue is assigned to a person, or when pull request is opened
Lead & cycle time is stopped when the issue is closed, or the pull request merged
Solución de problemas
Why can't I see timings per workflow state?
Currently, we cannot measure the cycle time by workflow state for the new GitHub projects due to a lack of API support. The state transition history is provided for classic projects but not for new projects. You can learn more and upvote the issue in the GitHub forum.
Currently, we cannot measure the cycle time by workflow state for the new GitHub projects due to a lack of API support. The state transition history is provided for classic projects but not for new projects. You can learn more and upvote the issue in the GitHub forum.
Why can’t I see all my repositories?
You can pull metrics from repositories that you own, you have contributed to, or that are in your organisation. If your organisation has applied special restrictions on 3rd party access you need to grant access to the Screenful app first.
You can pull metrics from repositories that you own, you have contributed to, or that are in your organisation. If your organisation has applied special restrictions on 3rd party access you need to grant access to the Screenful app first.
How can I switch my GitHub account (e.g. from personal account to company account)?
Go to the Applications settings in GitHub and remove Screenful form the authorised OAuth applications. After that, you can add a new data source under General Settings ► Integrations tab using a different account.
Go to the Applications settings in GitHub and remove Screenful form the authorised OAuth applications. After that, you can add a new data source under General Settings ► Integrations tab using a different account.