Tracking completions based on Date completed
Let's assume you have a custom date field Date completed on your board. You can create a chart that shows how many items have the date in the past by selecting by Date completed as the metric for the chart.
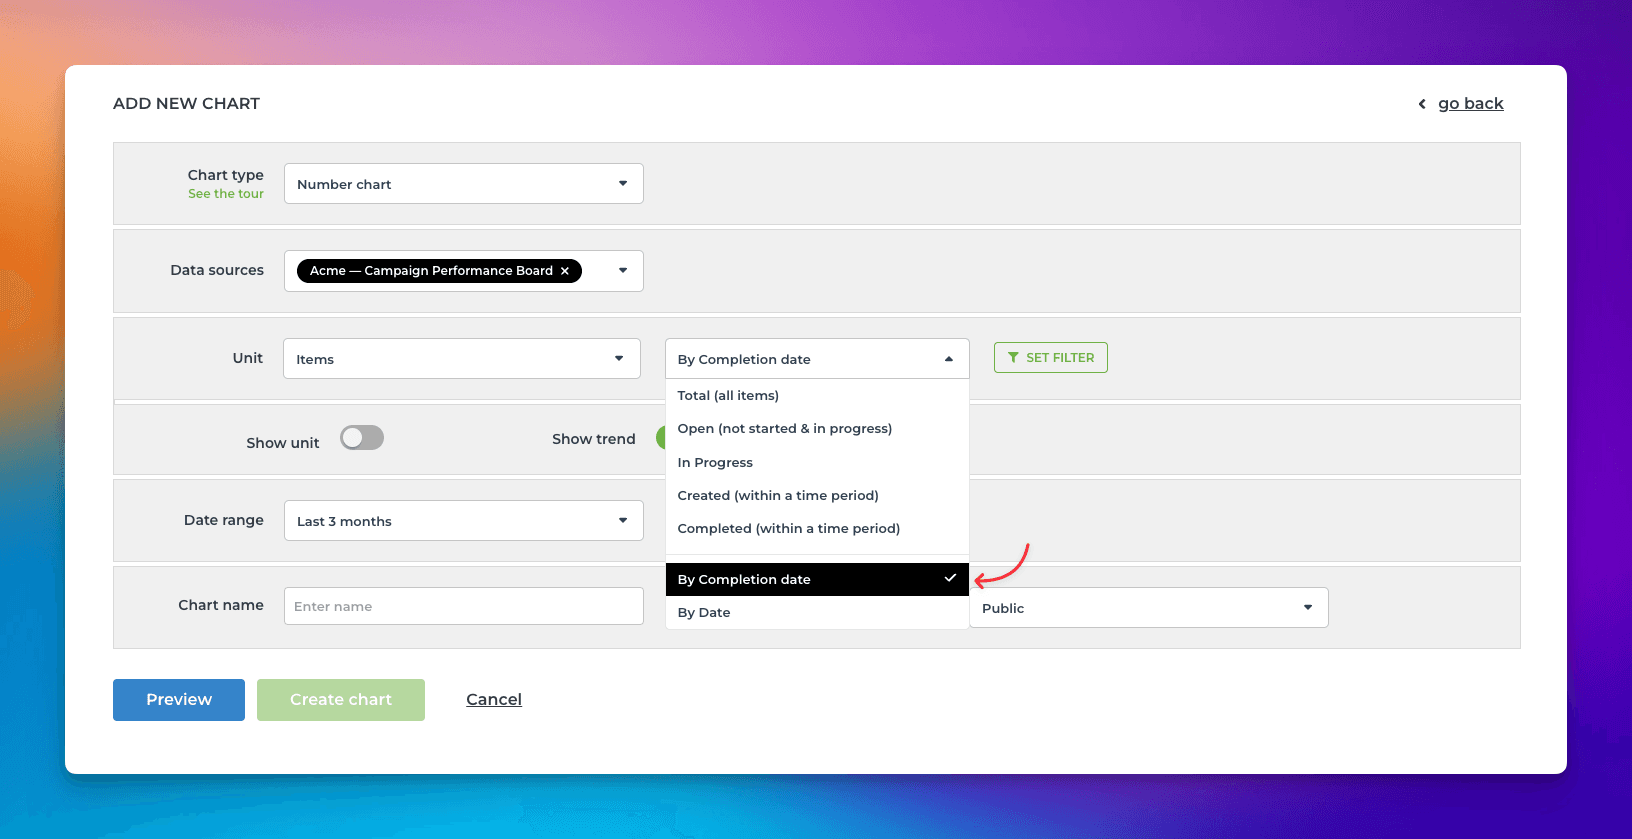
That will work the same way as if you had selected Completed (within date range), except that it will only look at the value in the date field. If the date is in the past, it is considered completed, regardless of the workflow state of that item. It is an alternative way of tracking work completions.
Here's the resulting chart:

Creating a bar chart of work due
When you create a bar chart, you have your date columns available in the metrics menu:
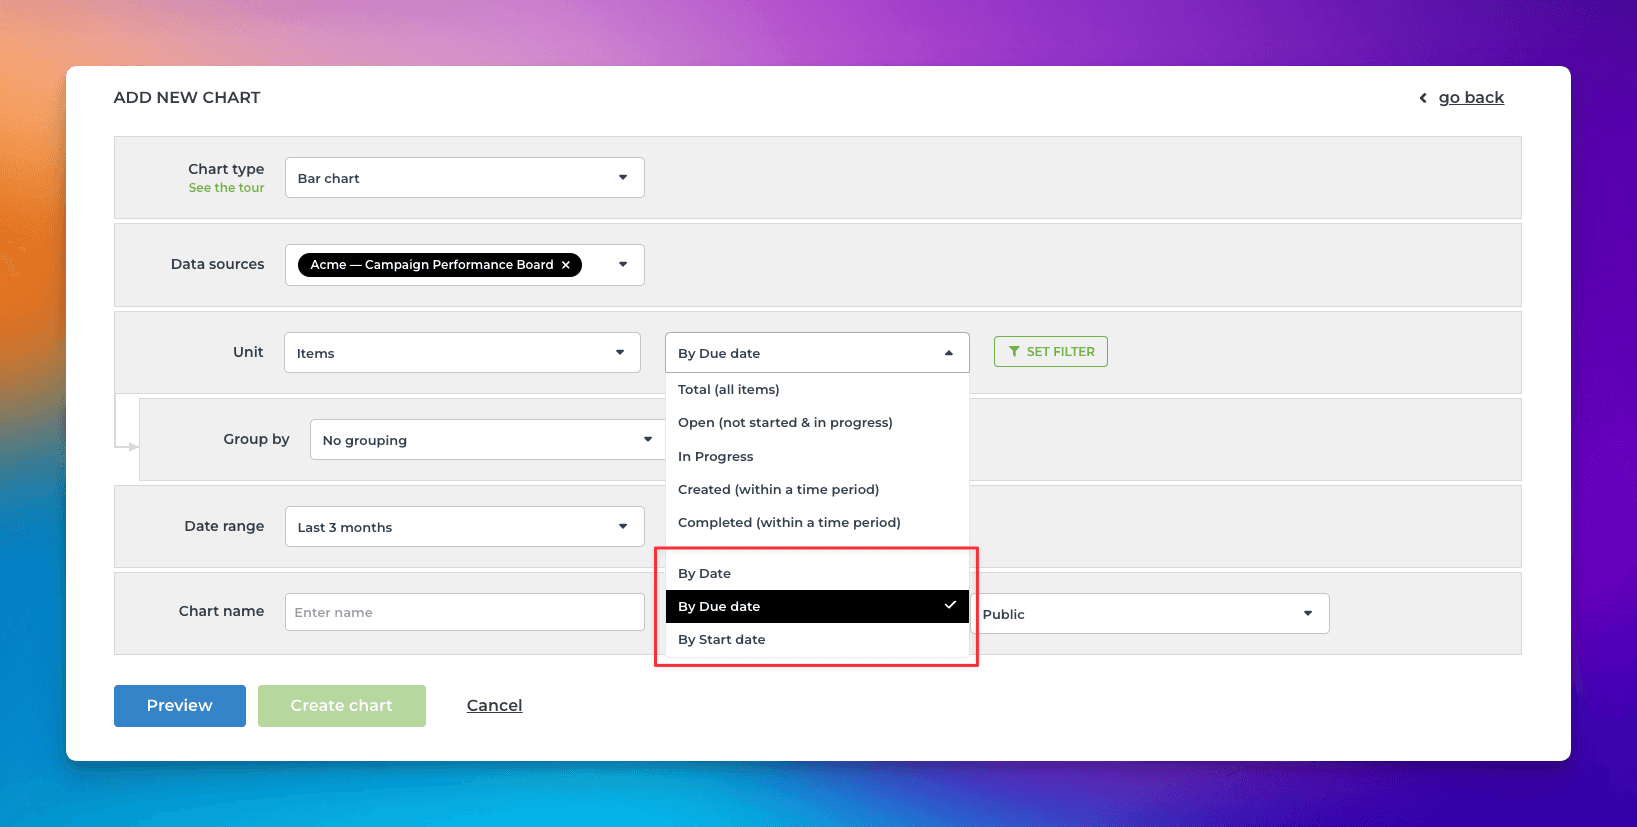
Selecting by Due date, generates a bar chart showing how many items have a due date in the past.
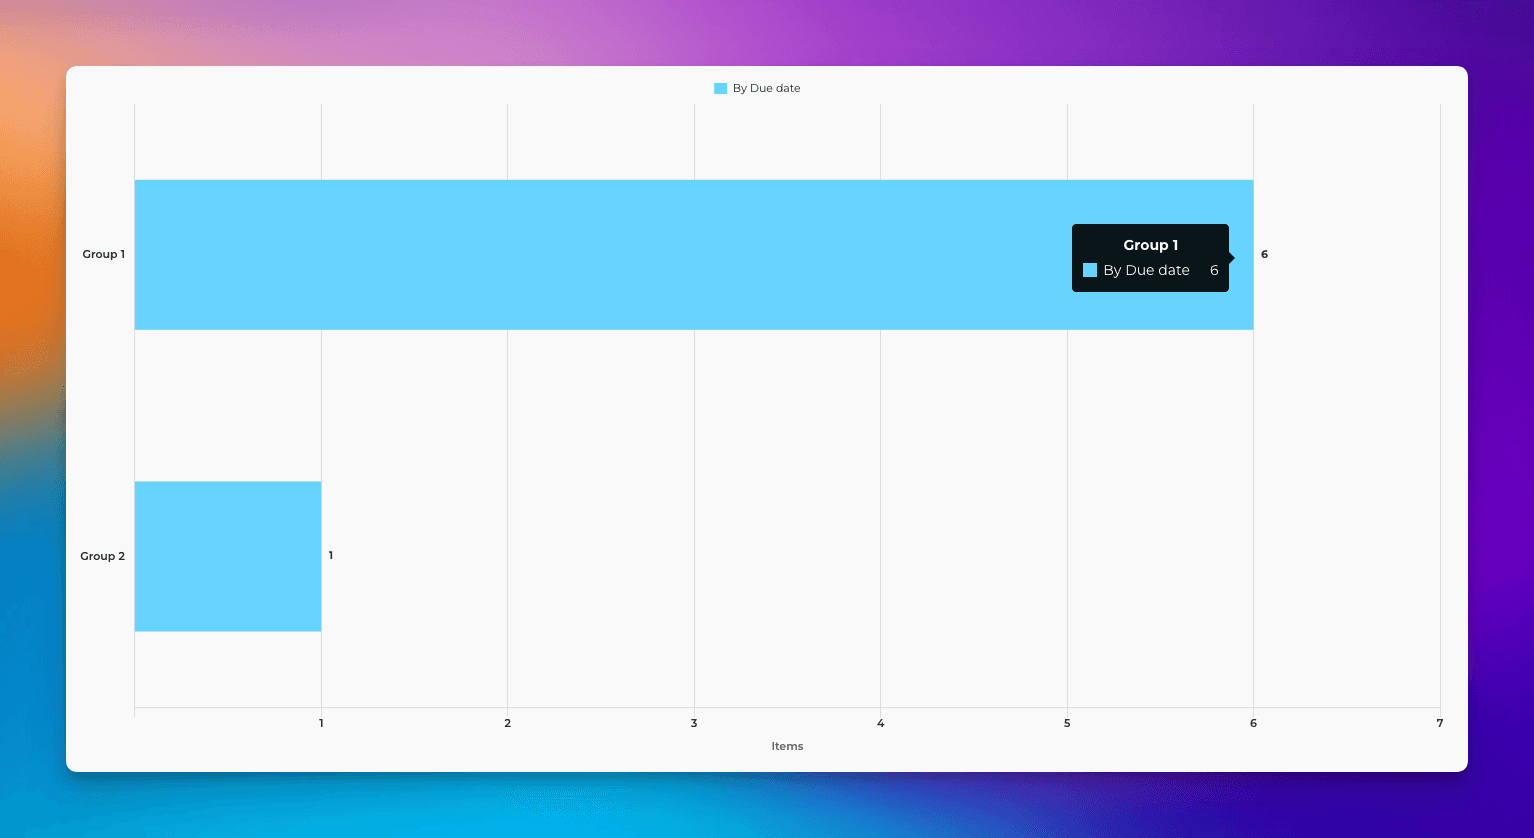
Creating a line chart based on Start date
When creating a line chart, you can pick a date field from the metrics menu:
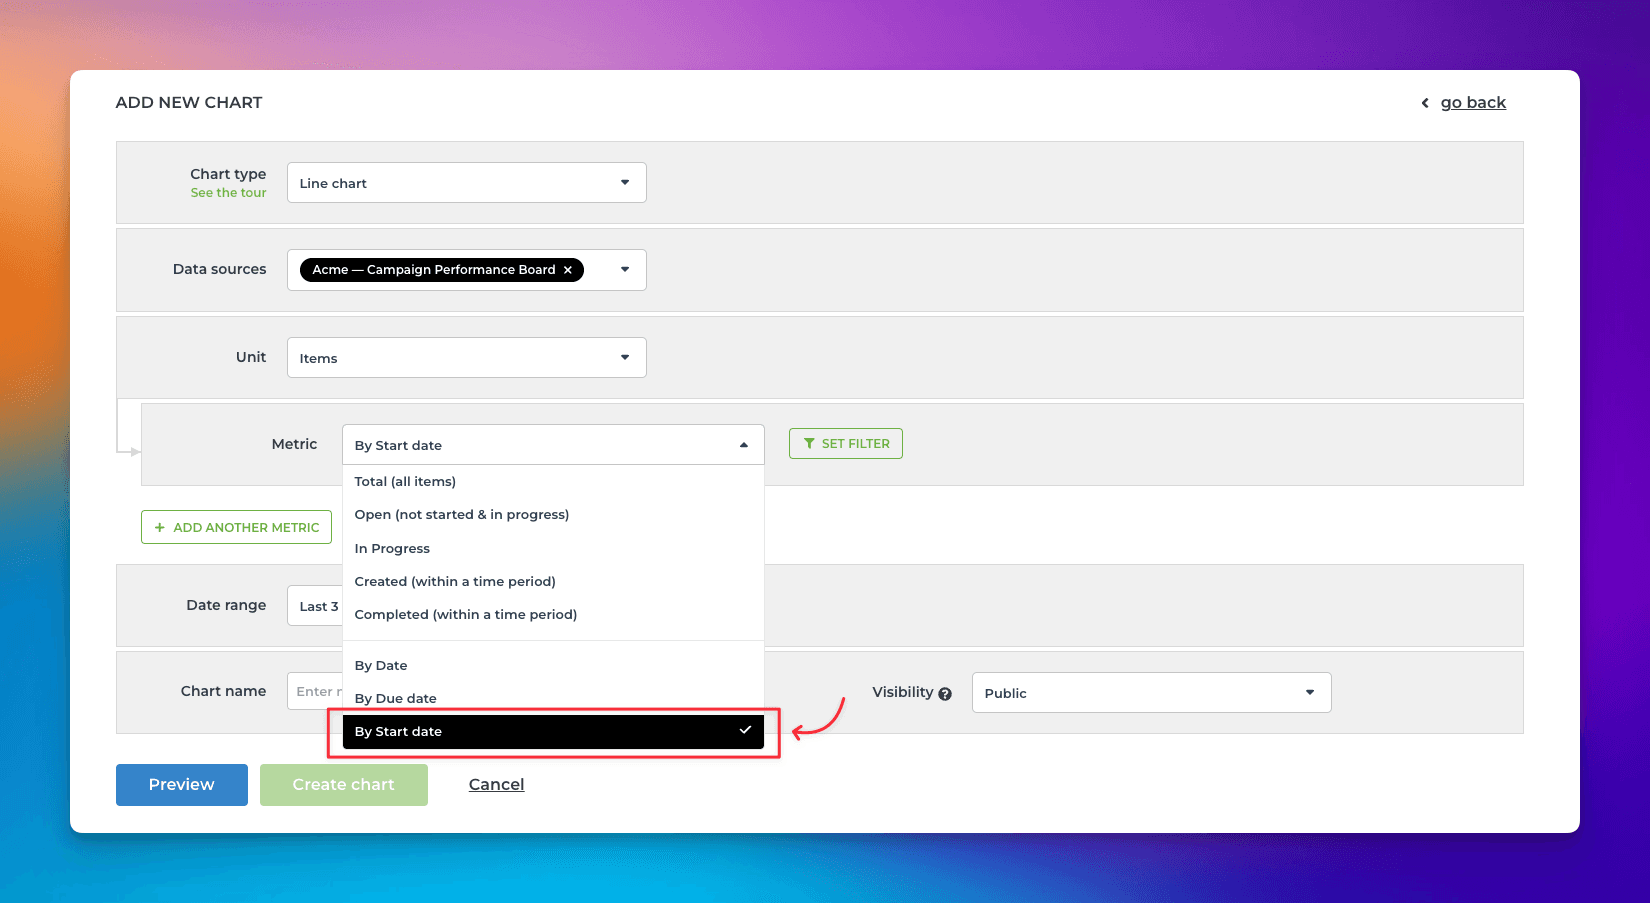
Selecting Start date, generates a line chart showing how many items have start date in the past.
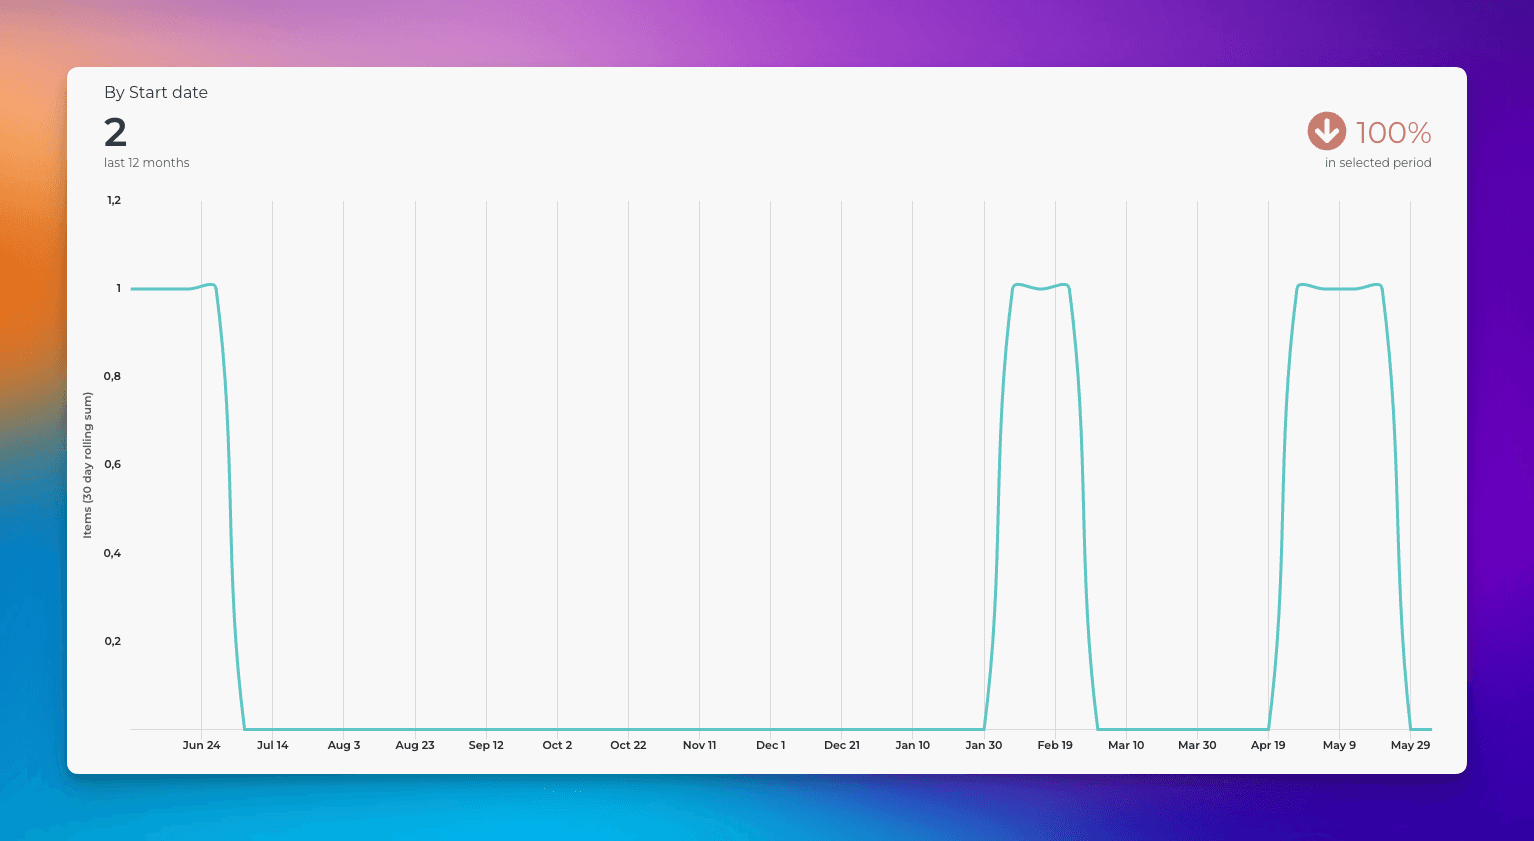
Tracking custom units by date
You can track any unit, such as Total page views, by any date fields. Like previously, you can pick a unit from the Unit menu:
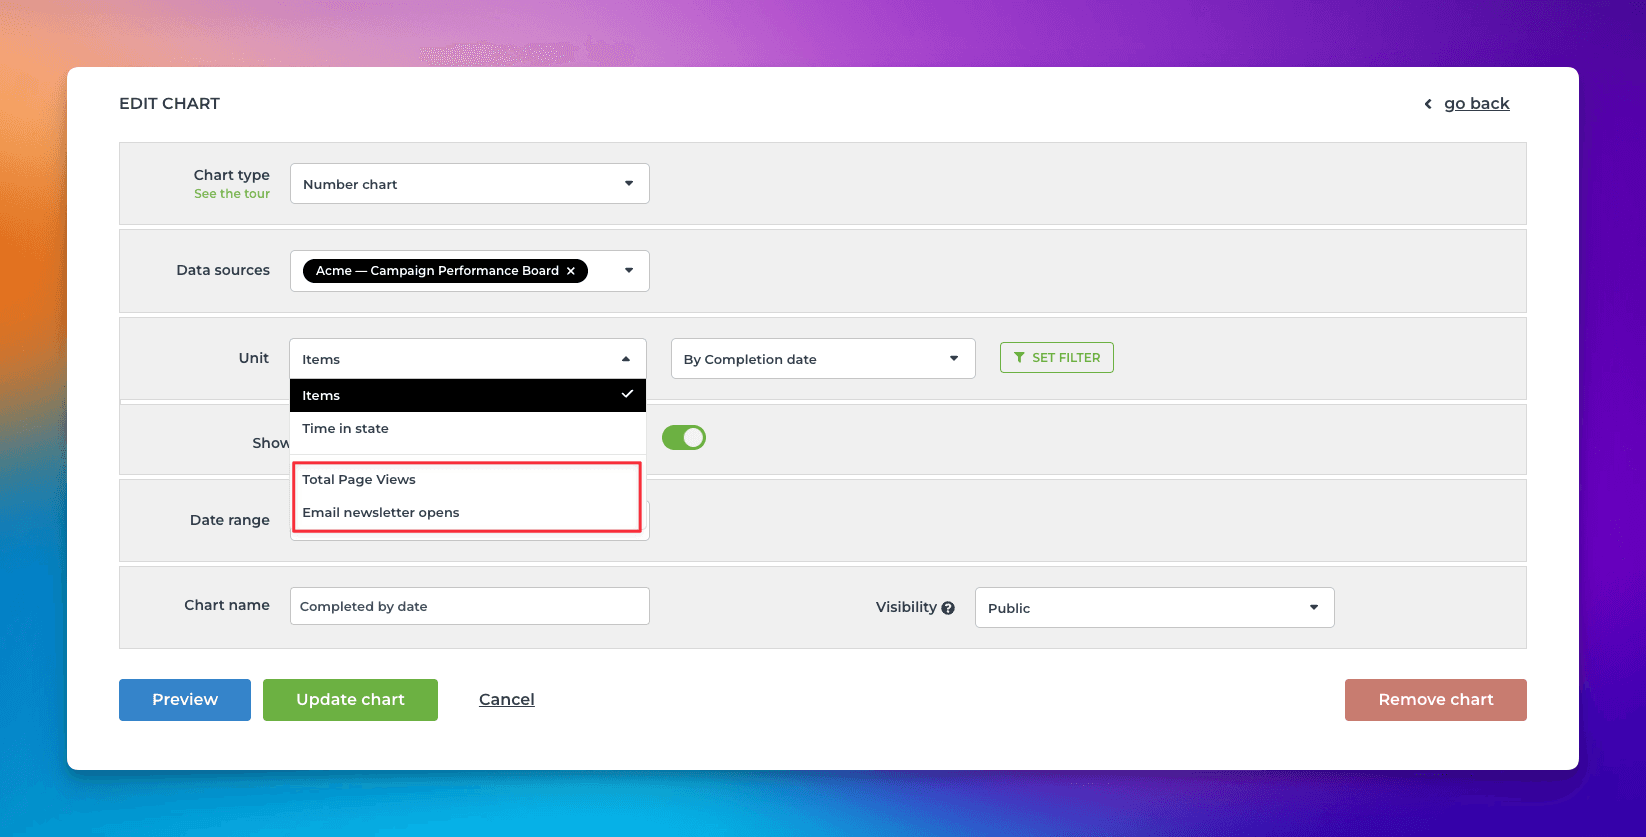
In this example, I have selected Total page views as the unit for the chart. Here's the resulting chart:

Any of your number fields can be used as a unit in the charts. You can also map your drop down fields as units in the custom fields mapping. You can learn more from this guide.