Where to find the velocity metrics?
The Insights tab allows you to explore and learn about the data before creating any of your own charts (you can create charts under the Charts tab). It consists of pre-generated charts divided into four sections: Open items, Completed, Timings, and Forecasts. You can access it from the top navigation:
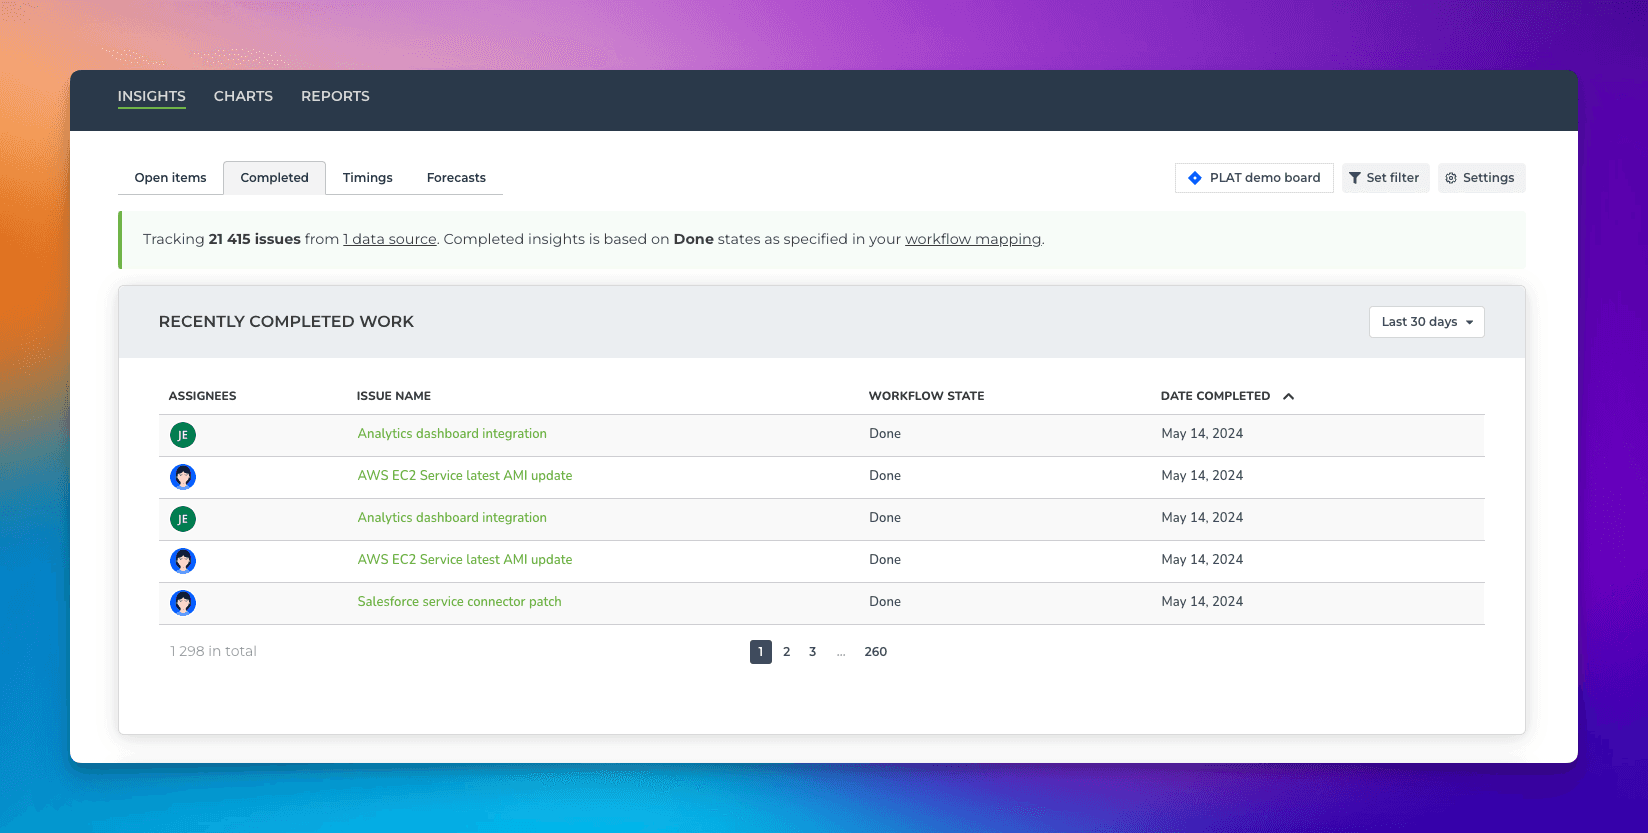
Click the Insights ► Completed tab to see your velocity and trends. The topmost list shows the most recently completed items. Clicking the item name opens the corresponding item in the underlying board.
See the distribution of work done per work type
The type of work completed chart shows the number of tasks/points completed during the selected date range. It tells you what kind of activities are taking most of your time. This chart shows how much work was completed by sprint, epic, label, group, tag, etc.
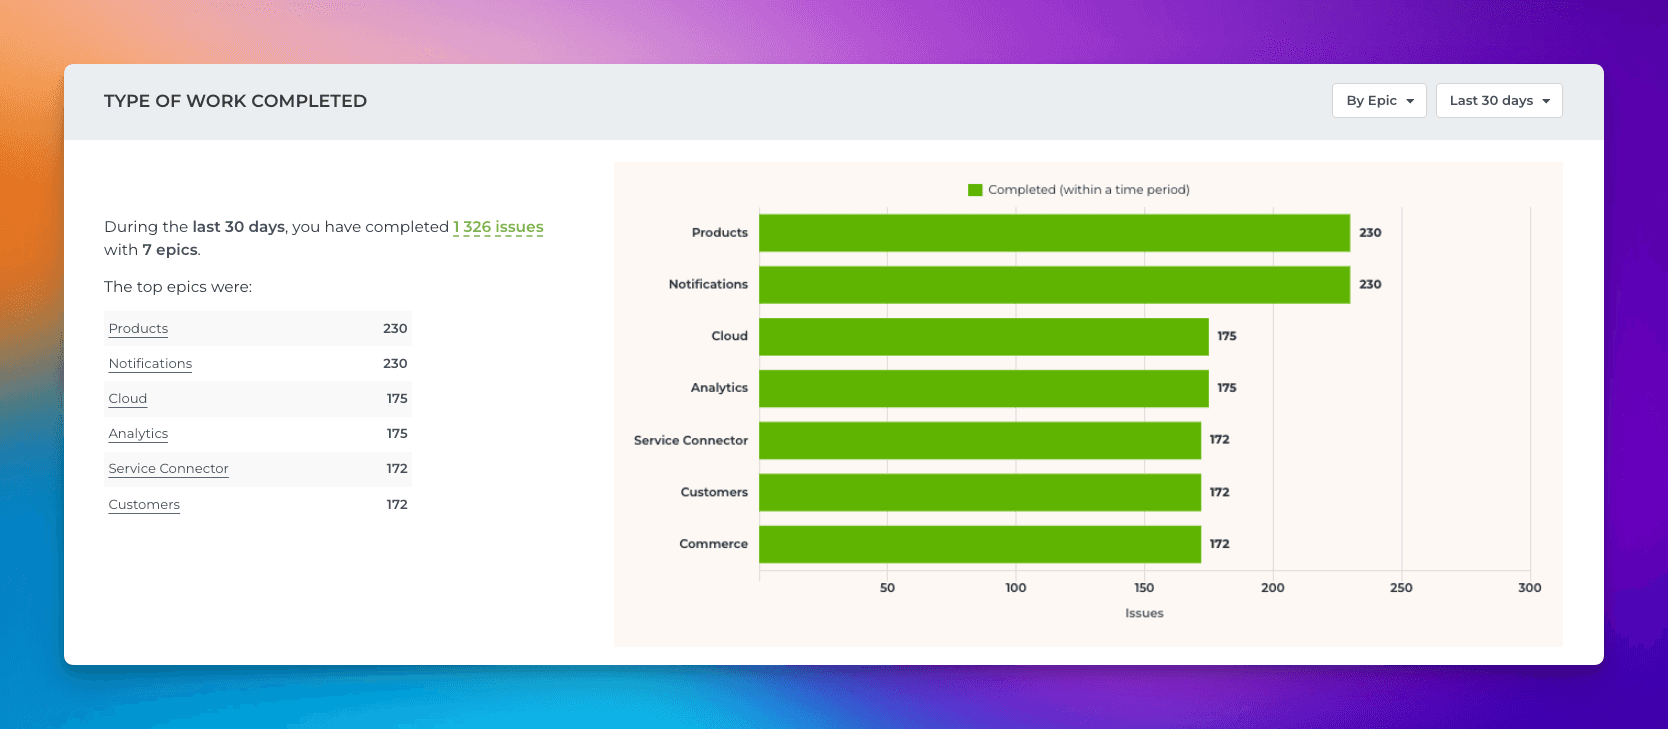
You can change the grouping from the quick menu in the top right corner.
See the trend of completed work per work type
The completed tasks trend shows the trend of different activities over time. Are you spending more time on meaningful activities and less time on doing rework or fixing bugs?
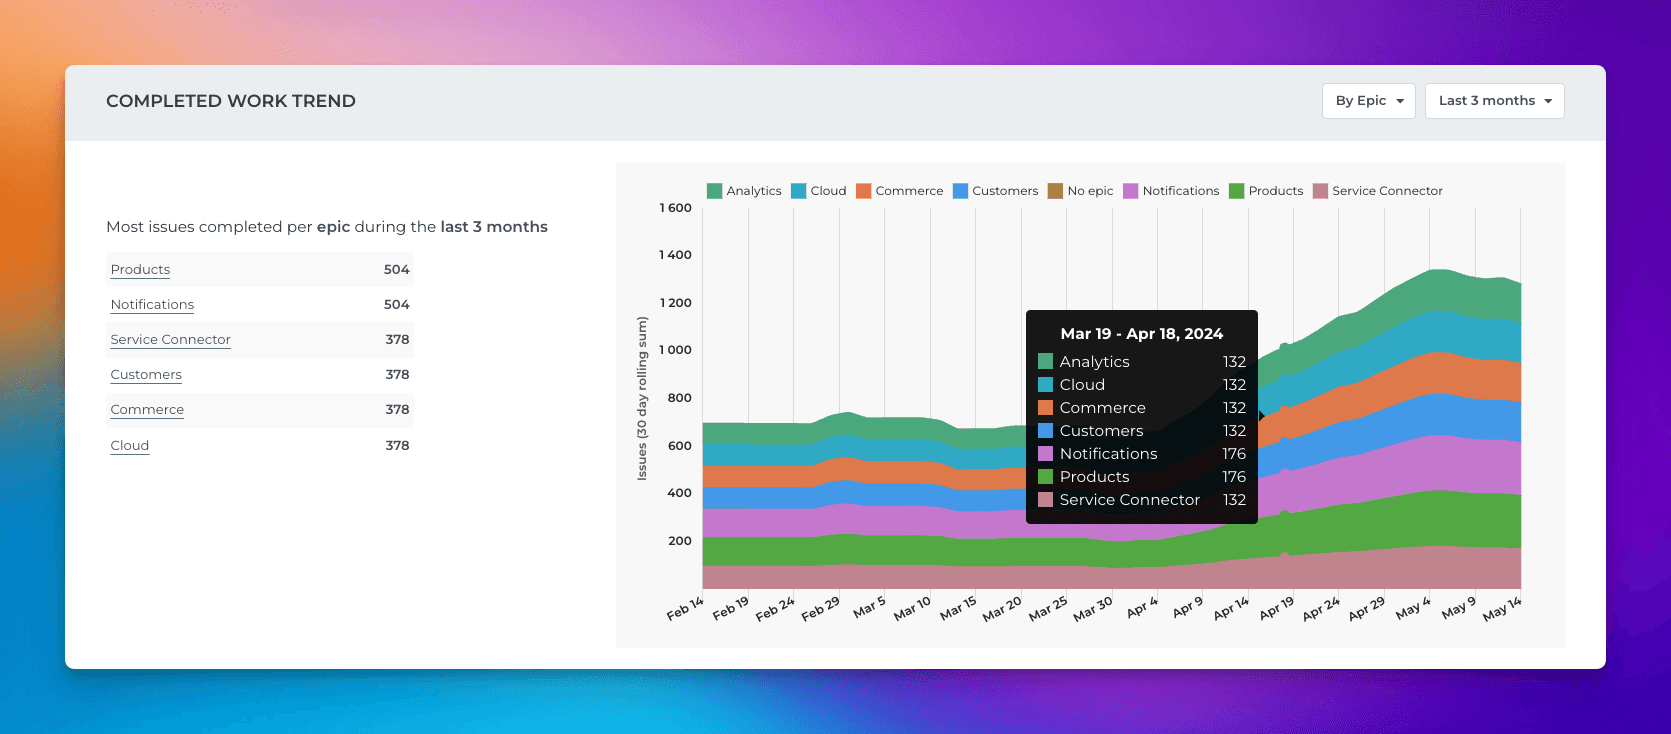
Looking at the trends lets you see whether you are completing more work than in the past.
See the weekly, monthly, and quarterly breakdown
You can quickly see how many tasks/points have been completed per week, month, or quarter. You can further slice and dice to what types of tasks those were and who they were assigned to.
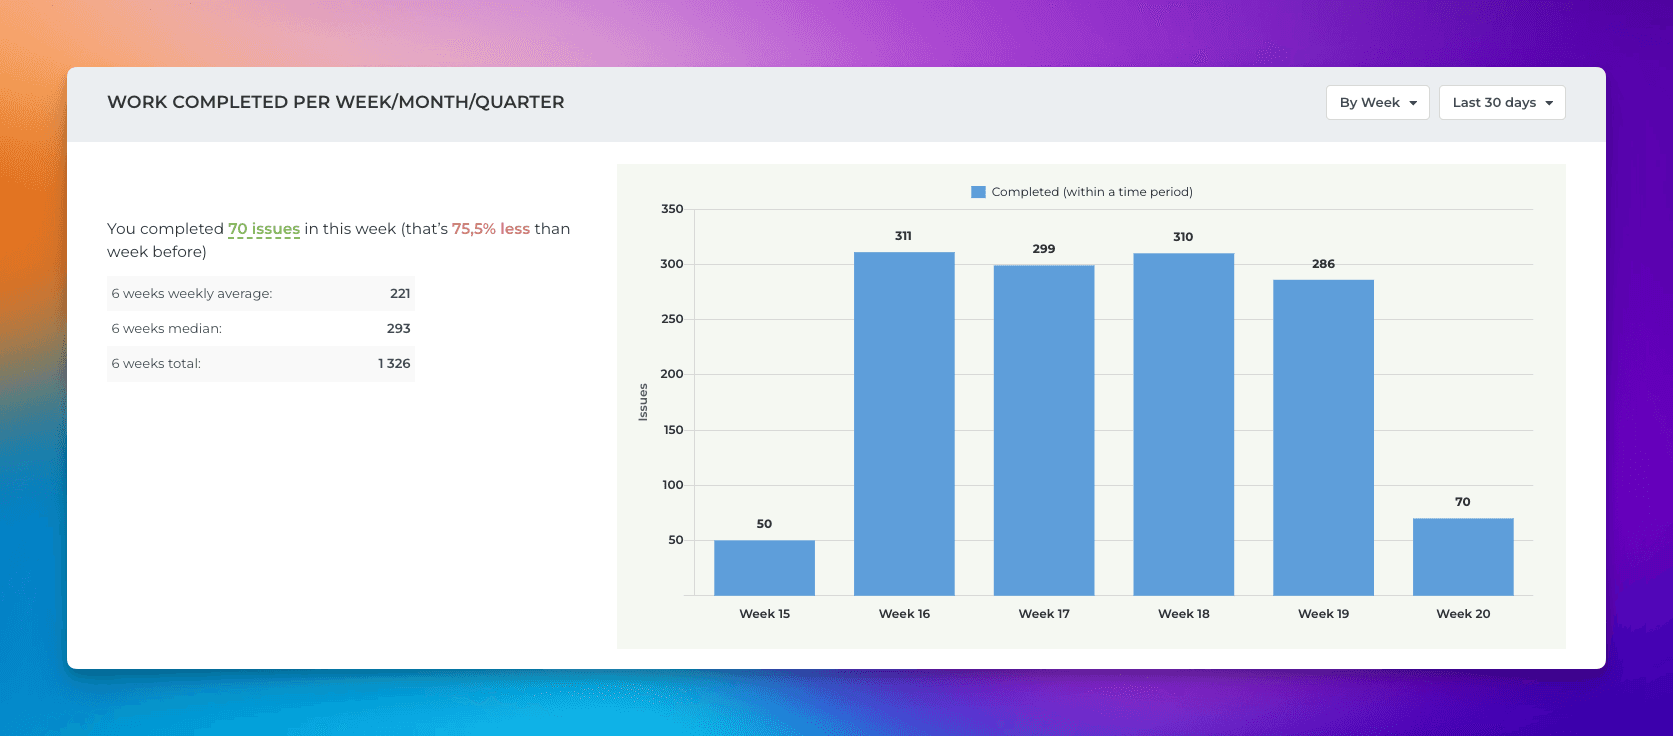
The numbers in the chart are item counts, but you can change the unit to any number field on your board. For example, if you have set estimates in story points, you can switch the chart to display total amounts in story points.
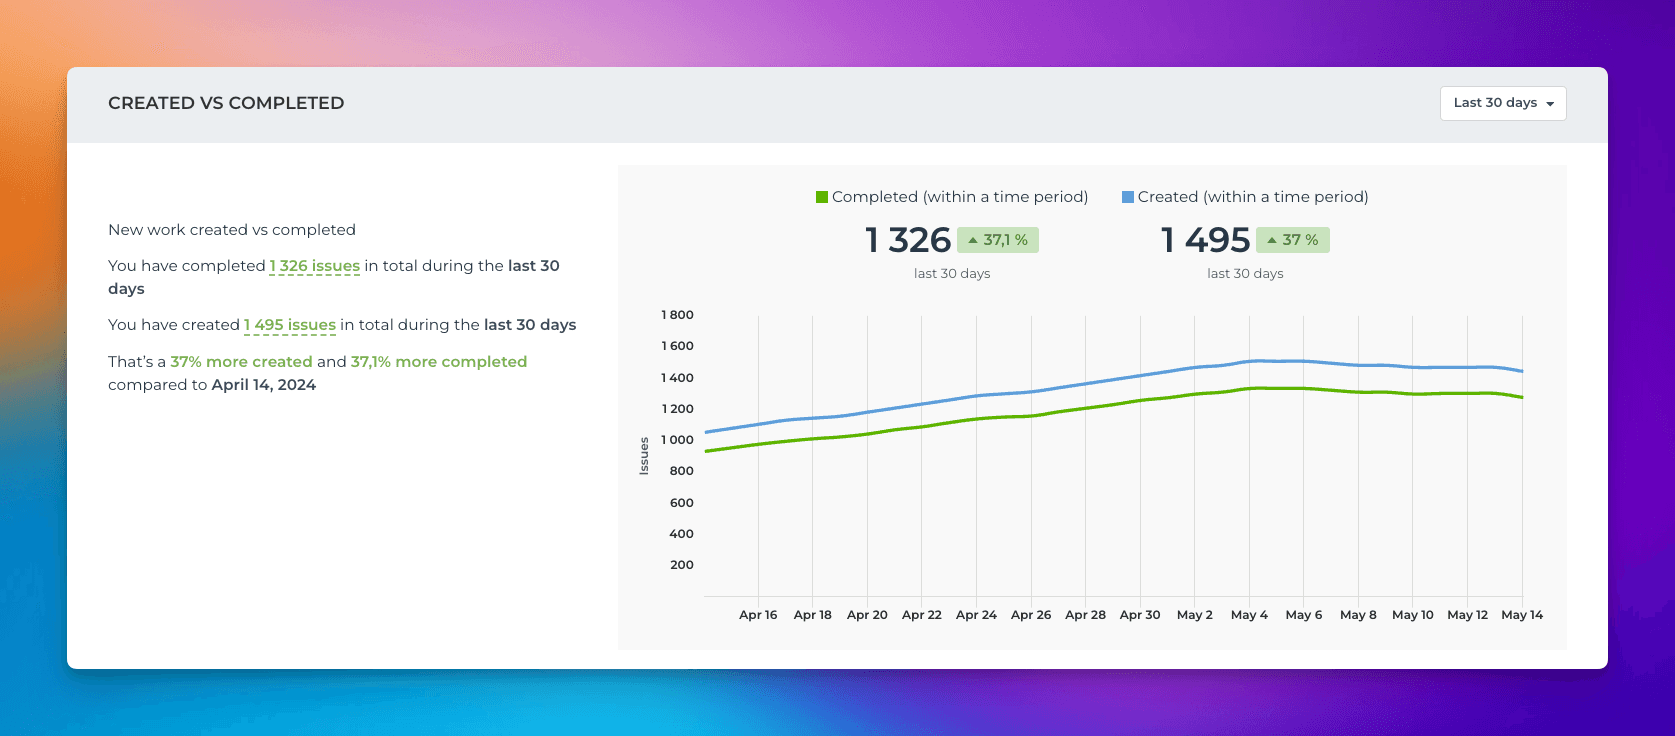
Compare created vs completed tasks trends
See how much work was completed vs new work created. Are you completing more work than what is being added to the project? The Created vs Completed chart that shows the number of tasks created vs new tasks created over the selected date range.
You can adjust the charts by selecting the data sources, filters, and other settings at the top of the page. When you master those, you'll likely get most of your questions answered about the velocity without having to create a custom chart for it!