Multi-bar chart
The multi-bar chart allows for the comparison of multiple number fields in a single chart. Eeah bar represents a single unit (number field). Compare two or more numeric custom fields in a single chart.
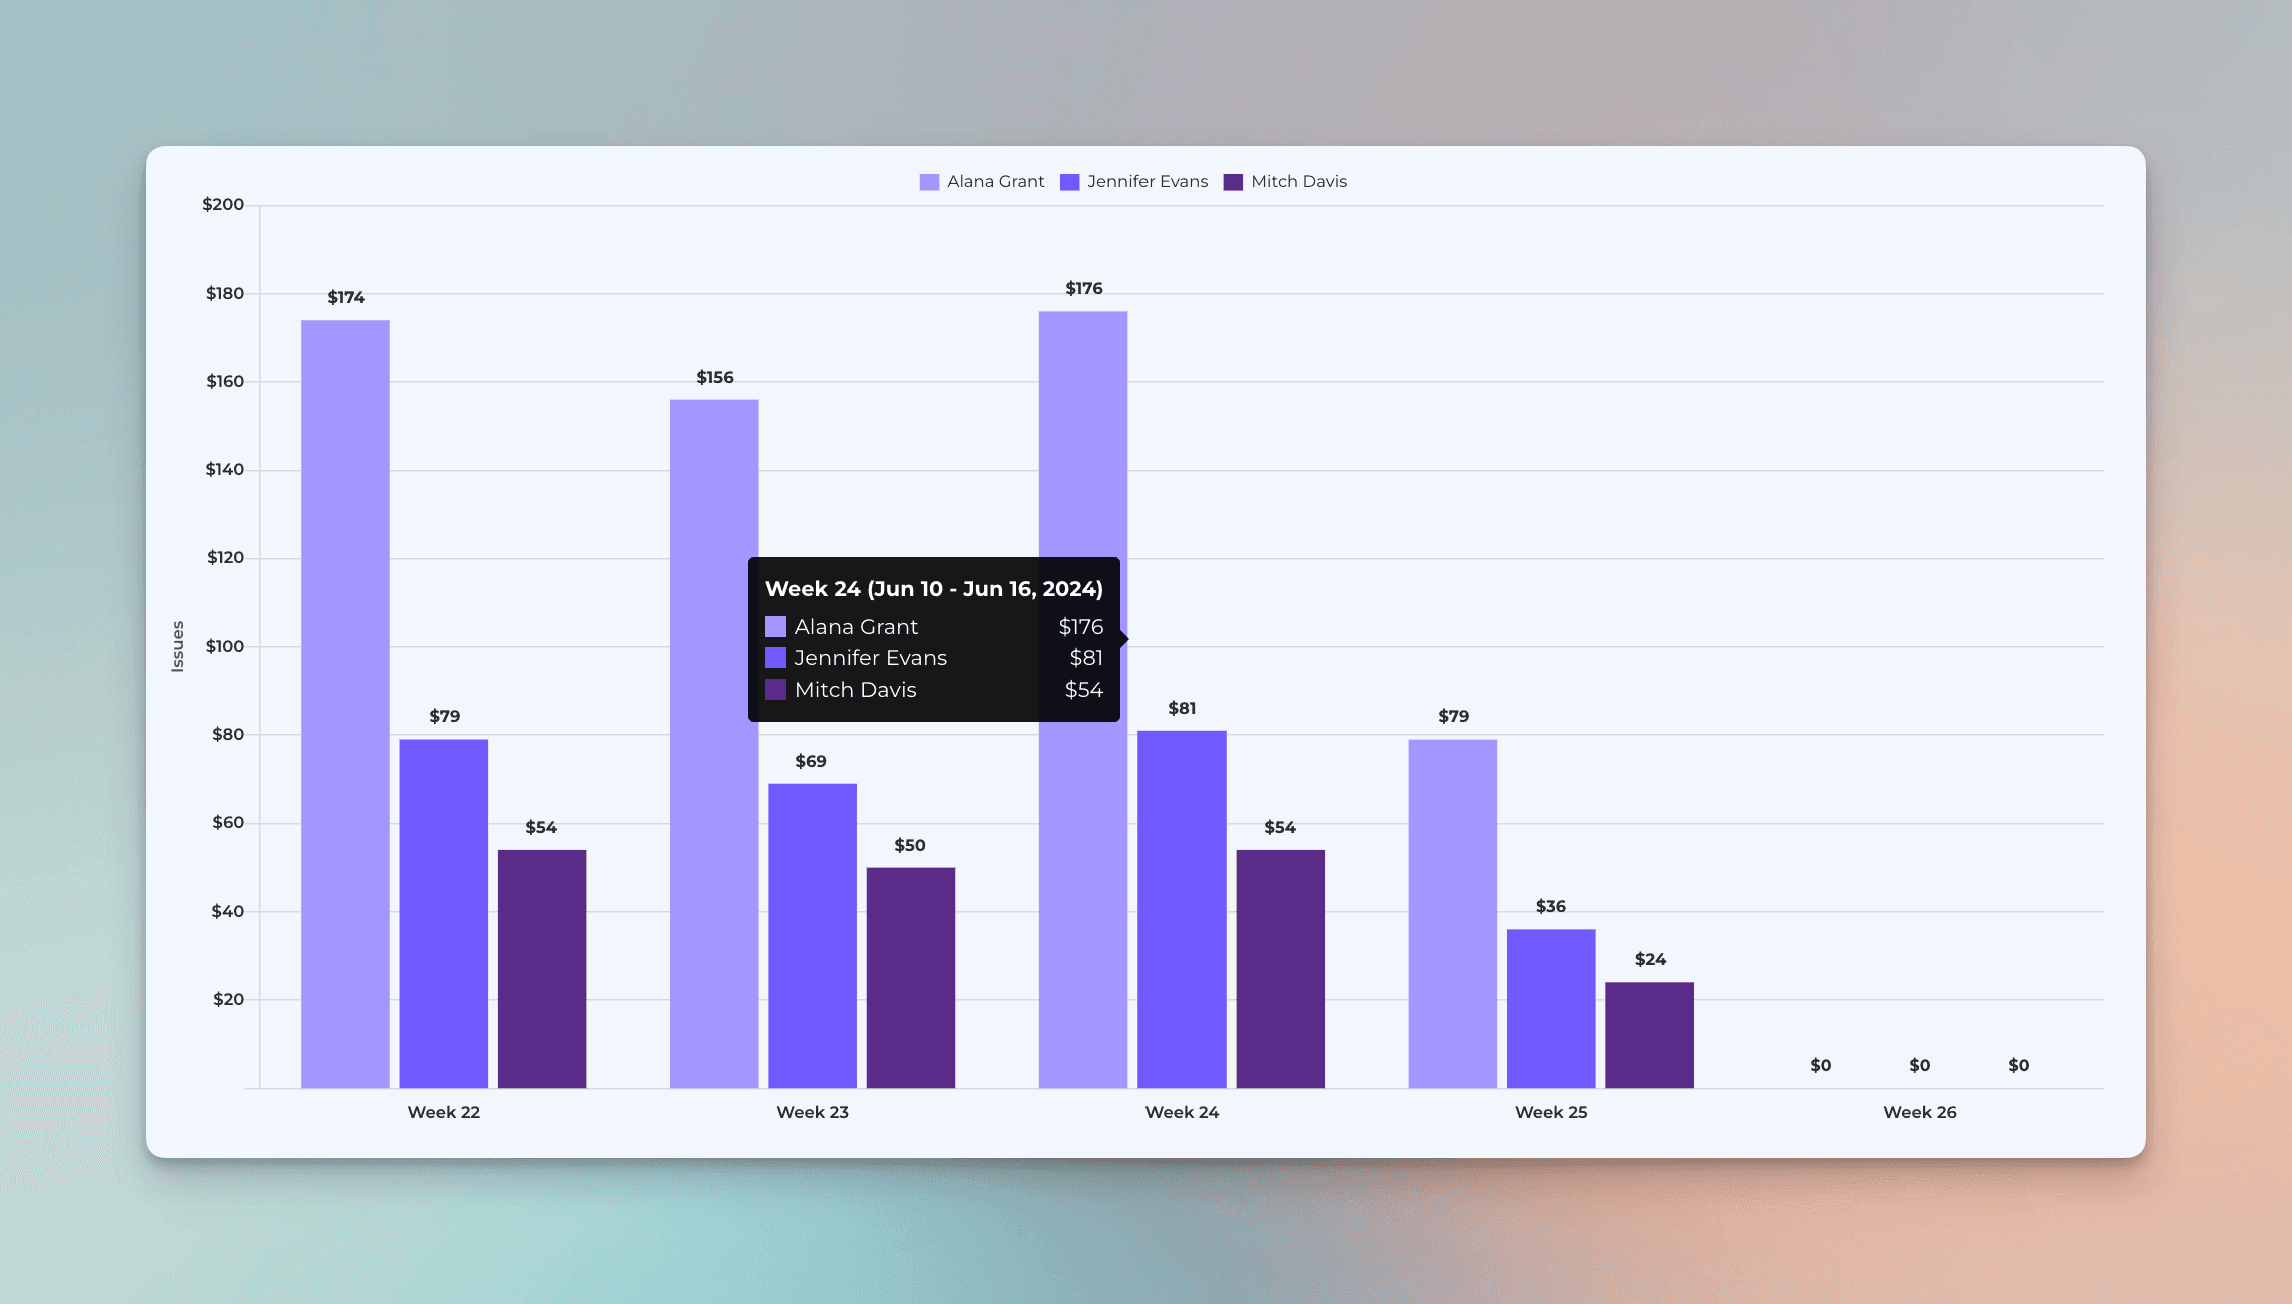
Compare multiple metrics with the multi-bar chart
The Multi-bar chart is a graph that shows one bar per selected unit (number field). You can group the bars by any property, such as assignee, label, or project. You can compare the trends over time when you group by week, month or quarter.
Create from template and customize
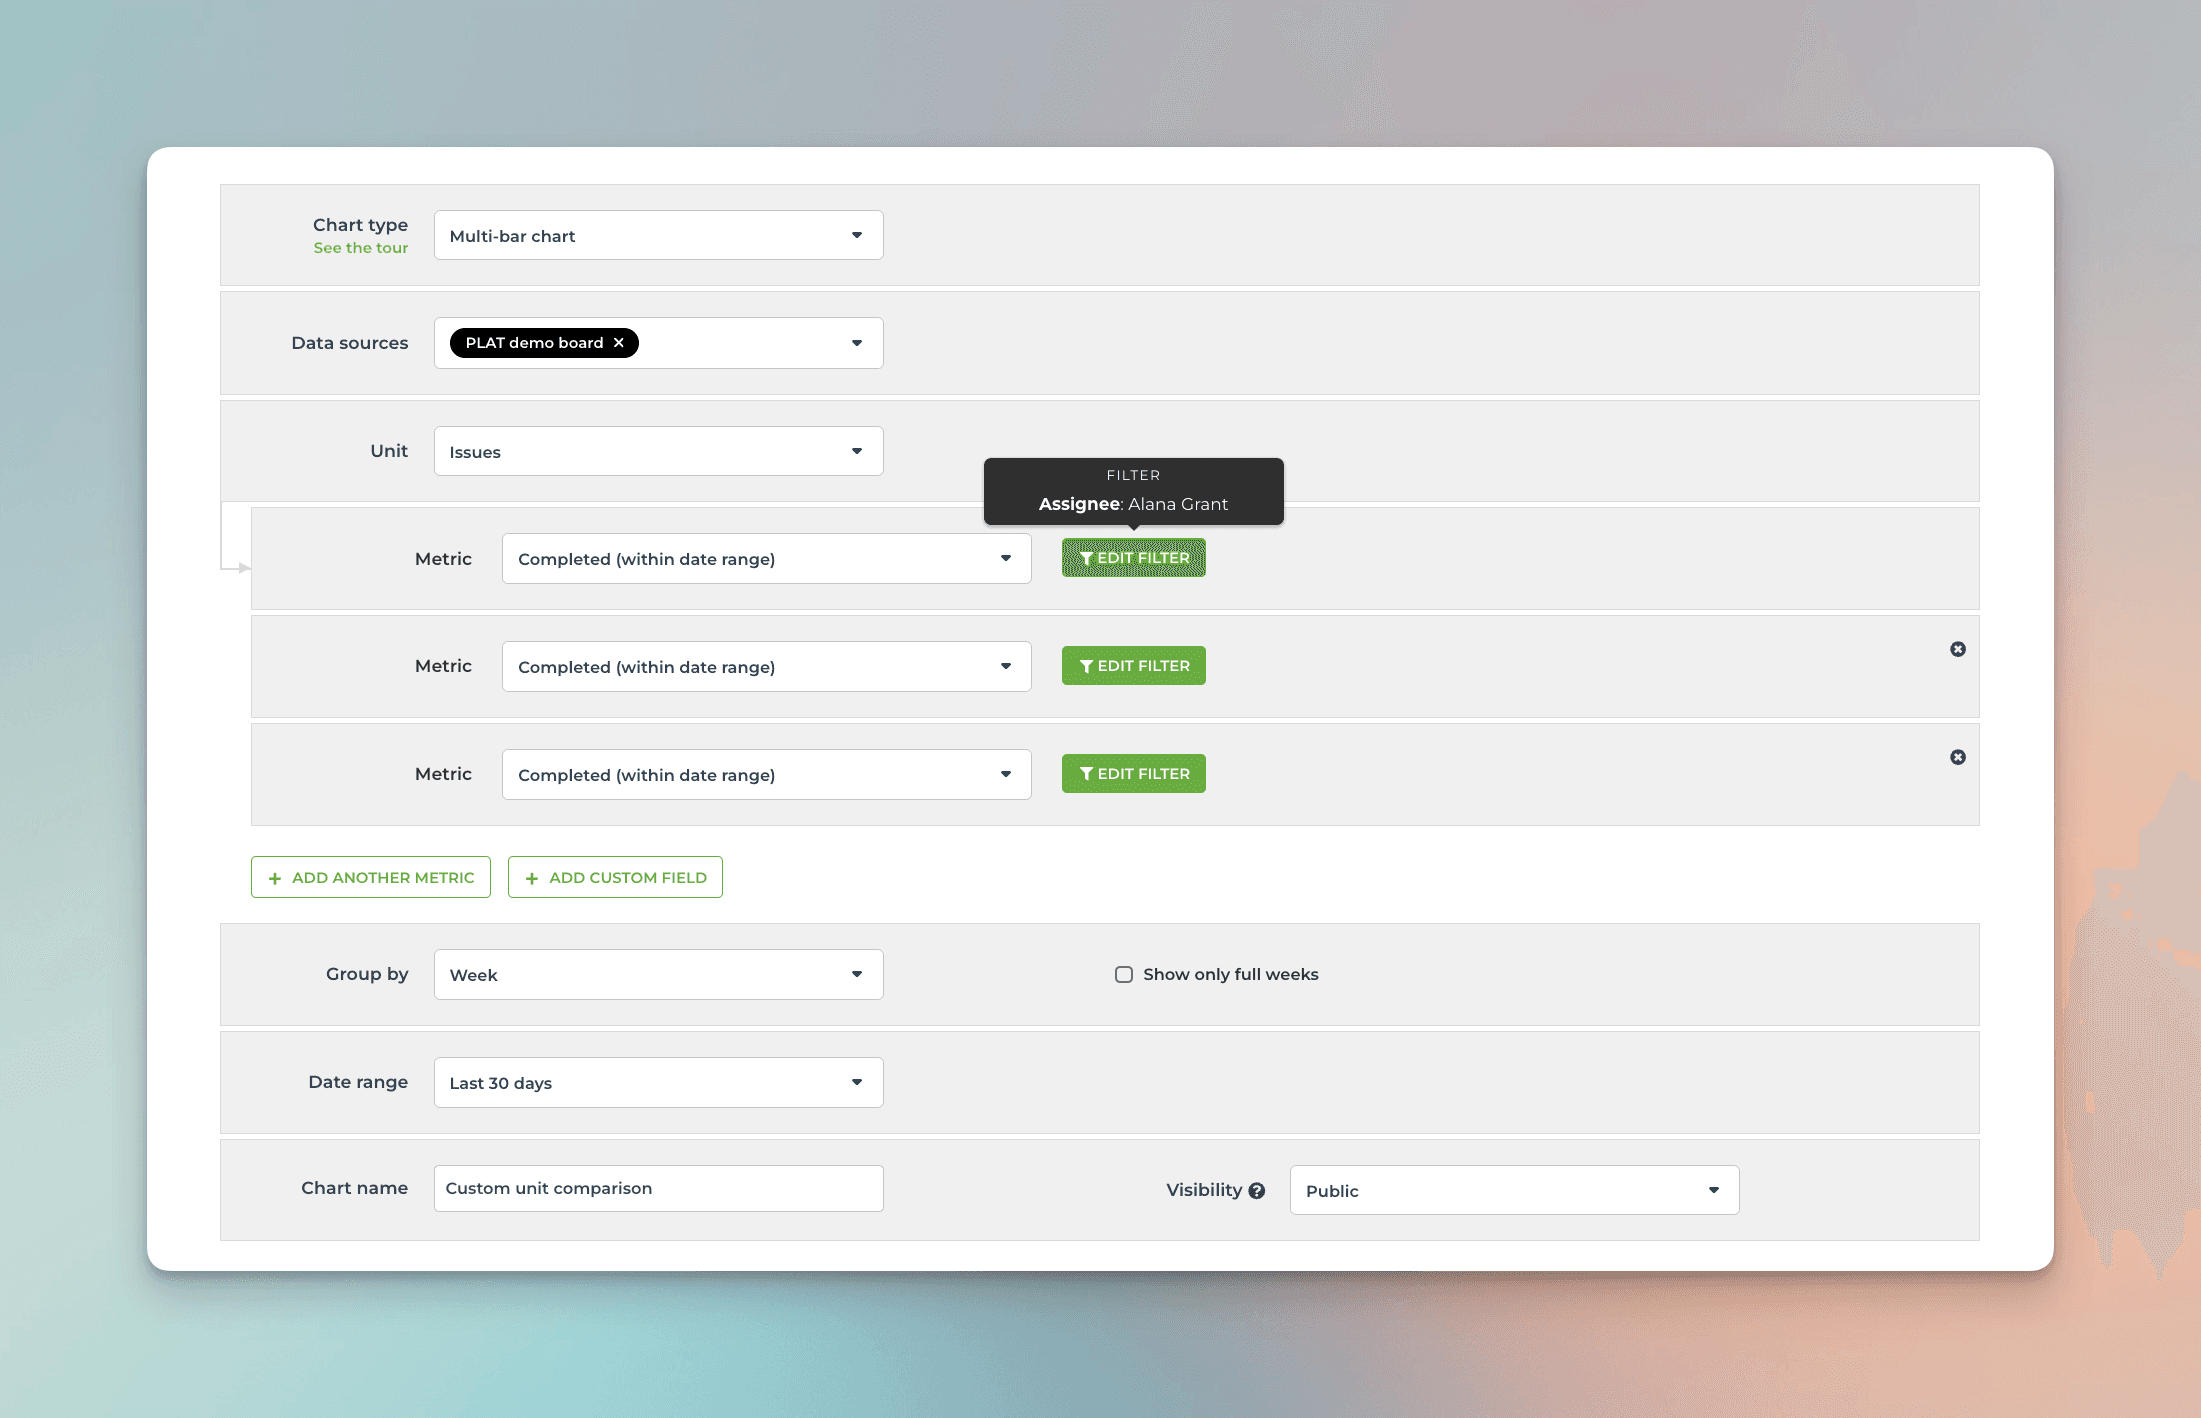
You can create this chart with just a few clicks using a template. Then, you can customize it further using the chart editor and adjusting the chart settings.
Compare multiple number fields in a single chart
Filter by any property and set a quick filter for quick comparison
Use data from any of your custom fields
Rename labels to your liking
Set the format of the numbers (currency, number format)
Select light mode or dark mode
Export to CSV or JSON