Visualize your data like never before


Certified GitLab Technology partner
Analytics & Reports
Transform your data into actionable insights. Identify trends, optimize workflows, and boost performance with a unified view of your key metrics.
Automated project reporting made easy for everyone


"Really good looking views and easy setup. Ideal for providing open visibility for the progress across the company."
Learn how to automate your GitLab reporting
Browse our recent blog posts and product updates


Zero to value in minutes
Streamline your reporting process with Screenful. Say goodbye to manual busywork so you can focus on delivering value.


FAQ
Common questions
Yes except that you won’t be able to use data from epics or issue weights since those are available only in a paid GitLab plans.
Yes except that you won’t be able to use data from epics or issue weights since those are available only in a paid GitLab plans.
The timings are based on your workflow settings. You can learn more from the Lead Time FAQ.
The timings are based on your workflow settings. You can learn more from the Lead Time FAQ.
Yes, you can filter the data shown so that either issues, merge requests, or both are included in the stats by setting a filter.
Yes, you can filter the data shown so that either issues, merge requests, or both are included in the stats by setting a filter.
Yes, you can track GitLab epics with Screenful. You can use "Epic" as a filter in a chart. For the chart that supports grouping (bar charts, pie chart, stacked area chart), you can group data by epic. You can also filter charts by "Item type"->"Epic". That will include only epics in the chart.
Yes, you can track GitLab epics with Screenful. You can use "Epic" as a filter in a chart. For the chart that supports grouping (bar charts, pie chart, stacked area chart), you can group data by epic. You can also filter charts by "Item type"->"Epic". That will include only epics in the chart.
Yes, you can group and filter data by iterations. You can also create a burndown chart for tracking a Gitlab iteration.
Yes, you can group and filter data by iterations. You can also create a burndown chart for tracking a Gitlab iteration.
You can manage the subscription in the billing settings. The location of the billing settings depends on the product you are subscribed to. You can learn more by following the instructions in this guide.
You can manage the subscription in the billing settings. The location of the billing settings depends on the product you are subscribed to. You can learn more by following the instructions in this guide.
We do not make changes to your data. We only read it via the API of your tool. Screenful is only for reporting and analytics. It does not update any data within your tools.
We do not make changes to your data. We only read it via the API of your tool. Screenful is only for reporting and analytics. It does not update any data within your tools.
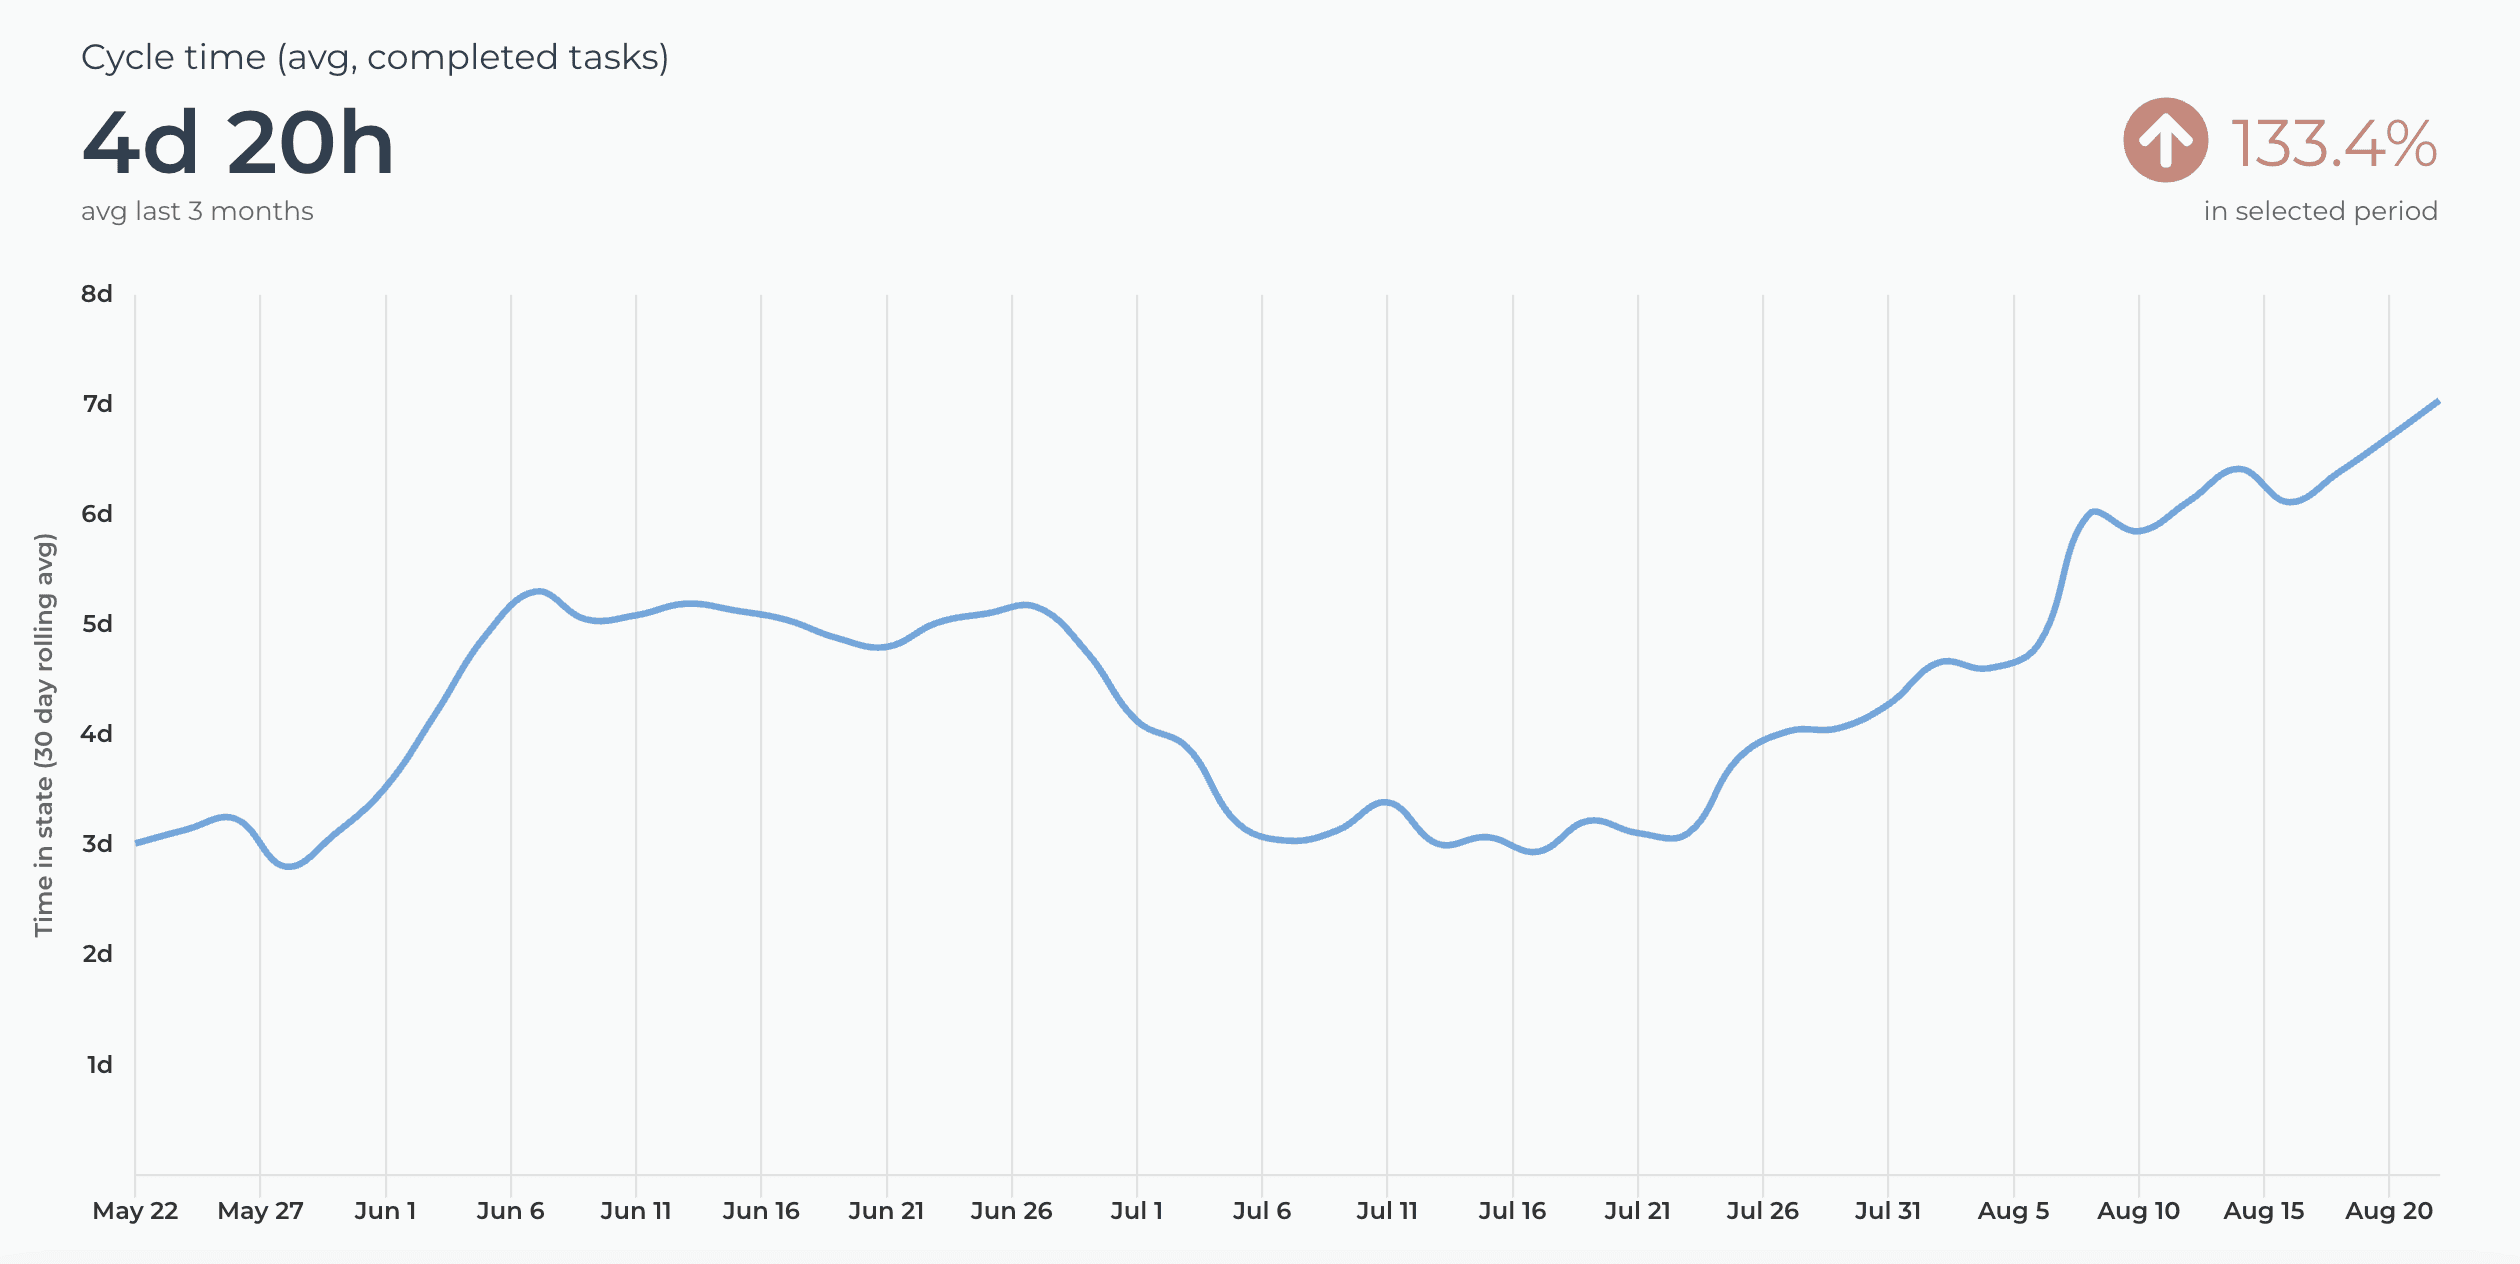
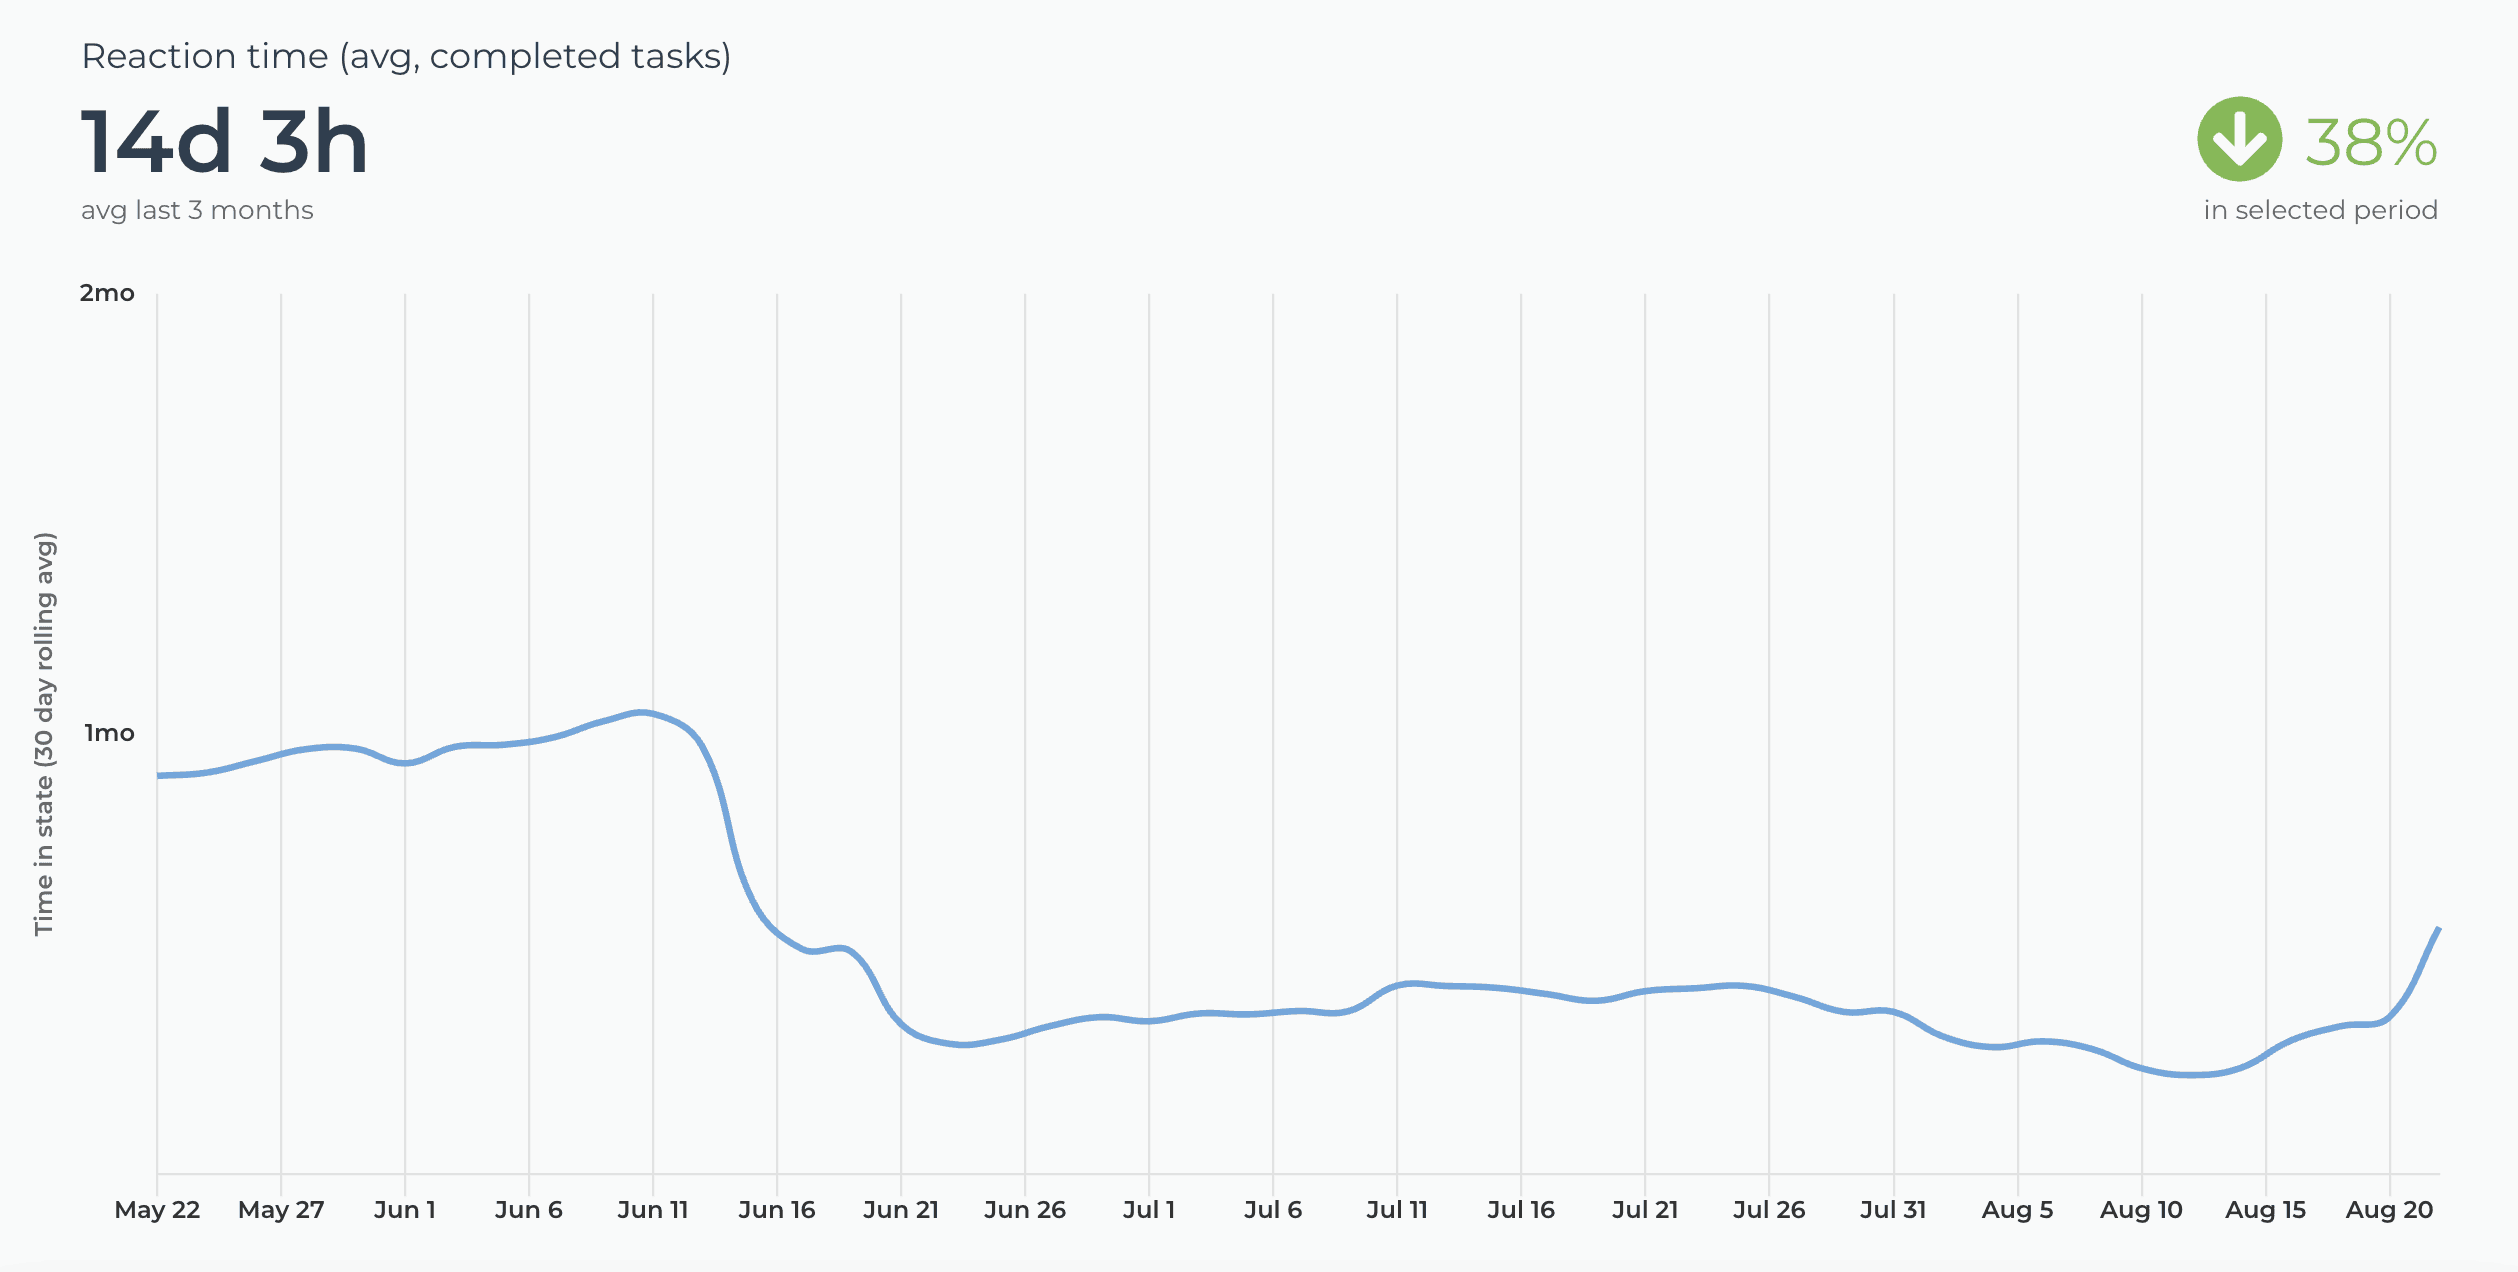
What is the difference between these metrics?
Reaction time = time before the work was started
Cycle time = time from start to completion
Lead time = Reaction time + Cycle time
Timing metrics explained: Lead time vs Cycle time
How is the reaction time calculated?
Reaction time starts running when a task is moved into a state that is mapped to the "Not started" in the workflow mapping. The reaction time stops when the task is moved out from that state. If the task is never placed into a state that is mapped to the “Not started” workflow state, then the reaction time is zero.
What if tasks skip lists/columns, or there is no sequential workflow?
The timing information is based on how long items stay in the workflow states that are mapped to "In progress" in the workflow mapping. There is no need for sequential progress, and it is totally fine if tasks skip some of the workflow steps.
What if a task is moved from the “not started” state directly to “done” without going through any of the “in progress” states?
In that case, the cycle time will be zero.
How does the cycle time work if a task is moved into "in progress" and then back to "not started yet"? Similarly, what happens if a card is archived while it's in progress?
Cycle time is calculated only for completed tasks, so in both of those cases, cycle time would be undefined.
If a task is moved from "in progress" to "done", but then back to "in progress" again for additional work would this time be added to the cycle time?
Cycle time is counted only when the task is in progress, so the time spent in the "done" state is not included in the calculation.
When is a task created? Does the clock start when a task is created or when it is put in the "next" state (or equivalent)?
The clock starts when a task is moved to a workflow state that is mapped to the "not started" or "in progress" workflow state.
Are weekends included in the cycle time calculations?
Weekends are included in the calculations by default, but you can change that in the chart settings by selecting 'Exclude non-business hours. See How to set weekend days and office hours
By default yes, but you can specify your working hours and days in the Account Settings.
By default yes, but you can specify your working hours and days in the Account Settings.
Yes, you can filter out individual items by name, or you can assign a label for a set of items and filter by that label. You can learn more from this guide:
Yes, you can filter out individual items by name, or you can assign a label for a set of items and filter by that label. You can learn more from this guide:
Does this support my specific workflow or do I have to use some specific states like "open", "in progress" and "done"?
You are not limited to any specific set of states or a workflow. You can configure your own workflow, if such exists, and you can use that in your reporting. It's also ok if you don't have any workflow in your boards, as can create reports based on any other criteria by setting a filter.
You are not limited to any specific set of states or a workflow. You can configure your own workflow, if such exists, and you can use that in your reporting. It's also ok if you don't have any workflow in your boards, as can create reports based on any other criteria by setting a filter.
All data sources are synced automatically once per hour. Changing settings or configuration will trigger additional sync so your data is at most one hour old. You can sync data manually at any time in the sync settings.
All data sources are synced automatically once per hour. Changing settings or configuration will trigger additional sync so your data is at most one hour old. You can sync data manually at any time in the sync settings.
You can embed any custom chart or report to any web page using the embed code. Learn more about the sharing feature from the online guide.
You can embed any custom chart or report to any web page using the embed code. Learn more about the sharing feature from the online guide.
The Getting Started Guide contains Instructions for setting up Screenful.
See also our Accounts & Pricing FAQ.
Check out our how-to and video tutorials, or get in touch by emailing support@screenful.com
The Getting Started Guide contains Instructions for setting up Screenful.
See also our Accounts & Pricing FAQ.
Check out our how-to and video tutorials, or get in touch by emailing support@screenful.com
Troubleshooting
Screenful connects to the GitLab board, not a project or group, so the first thing would be to check that the missing issues or pull requests are visible on that board.
Screenful connects to the GitLab board, not a project or group, so the first thing would be to check that the missing issues or pull requests are visible on that board.
While both the public and private channels are shown in the menu, you won’t receive the report to a private channel without explicitly adding the Screenful app to that channel. Learn how to enable sending to a private Slack channel.
There can also be restrictions on who can install apps to your Slack. Learn how to manage app approval in your Slack workspace.
Some browser plugins may interfere with the authorization process. If you see an empty page during the authorization or the list of channels is empty, you should try with another browser (or ask your colleague to do the Slack authorization).
Filter options are derived from task data, which means that if you recently added some properties, such as labels, but haven't yet assigned them to any tasks, they won't show up in the filter options. As soon as you assign them to tasks, they will show up in the filter options from then on.
Filter options are derived from task data, which means that if you recently added some properties, such as labels, but haven't yet assigned them to any tasks, they won't show up in the filter options. As soon as you assign them to tasks, they will show up in the filter options from then on.
If you or your colleague didn't receive the user invitation email, you can go to the user settings and click the Copy invitation link button to copy the link to the clipboard. After that, you can share the link via any channel (email, Slack, Teams, etc). You can learn more from the user invitation guide.
If you or your colleague didn't receive the user invitation email, you can go to the user settings and click the Copy invitation link button to copy the link to the clipboard. After that, you can share the link via any channel (email, Slack, Teams, etc). You can learn more from the user invitation guide.