This guide shows how to select items for a ClickUp chart. The selection can be based on any of the fields on your board, including Status filed, Date fields, or the Time spent field.
Select items based on Status field
The Status field is special because it is used as a source of your workflow. When you import a board to Screenful, you are asked to pick the status column that contains your workflow. The stages in your workflow are mapped to Not started, In progress, and Done. That allows Screenful to understand your data better and calculate metrics automatically.
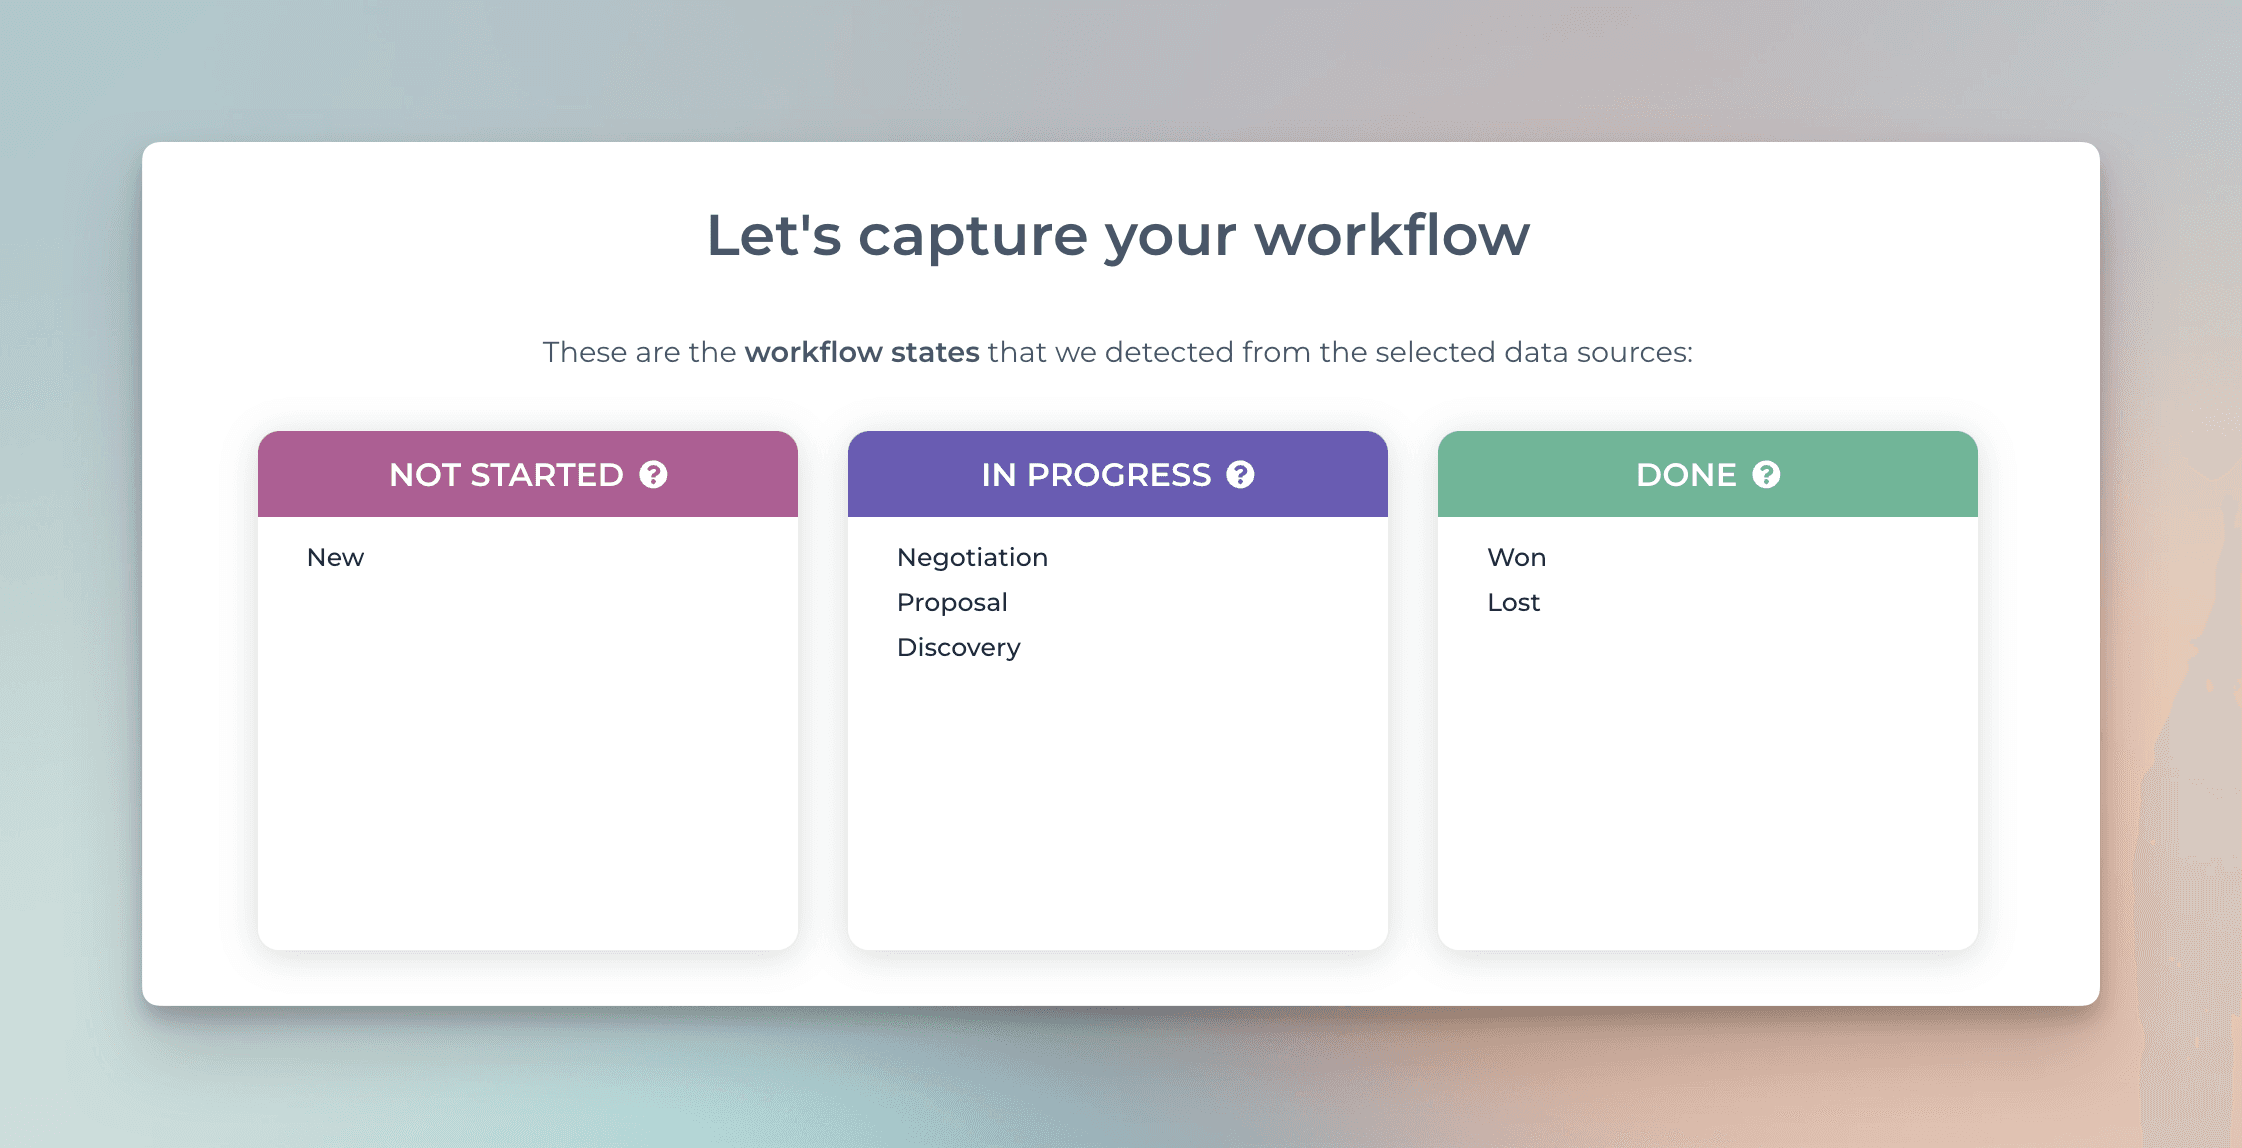
These settings are used when you select items based on their Not started", "In progress", or "Completed" status. These are useful shortcuts to set a correct filter when you are not interested in the individual statuses within these boxes. It also allows aggregating data across multiple ClickUp spaces into one chart, even when their workflows are different.
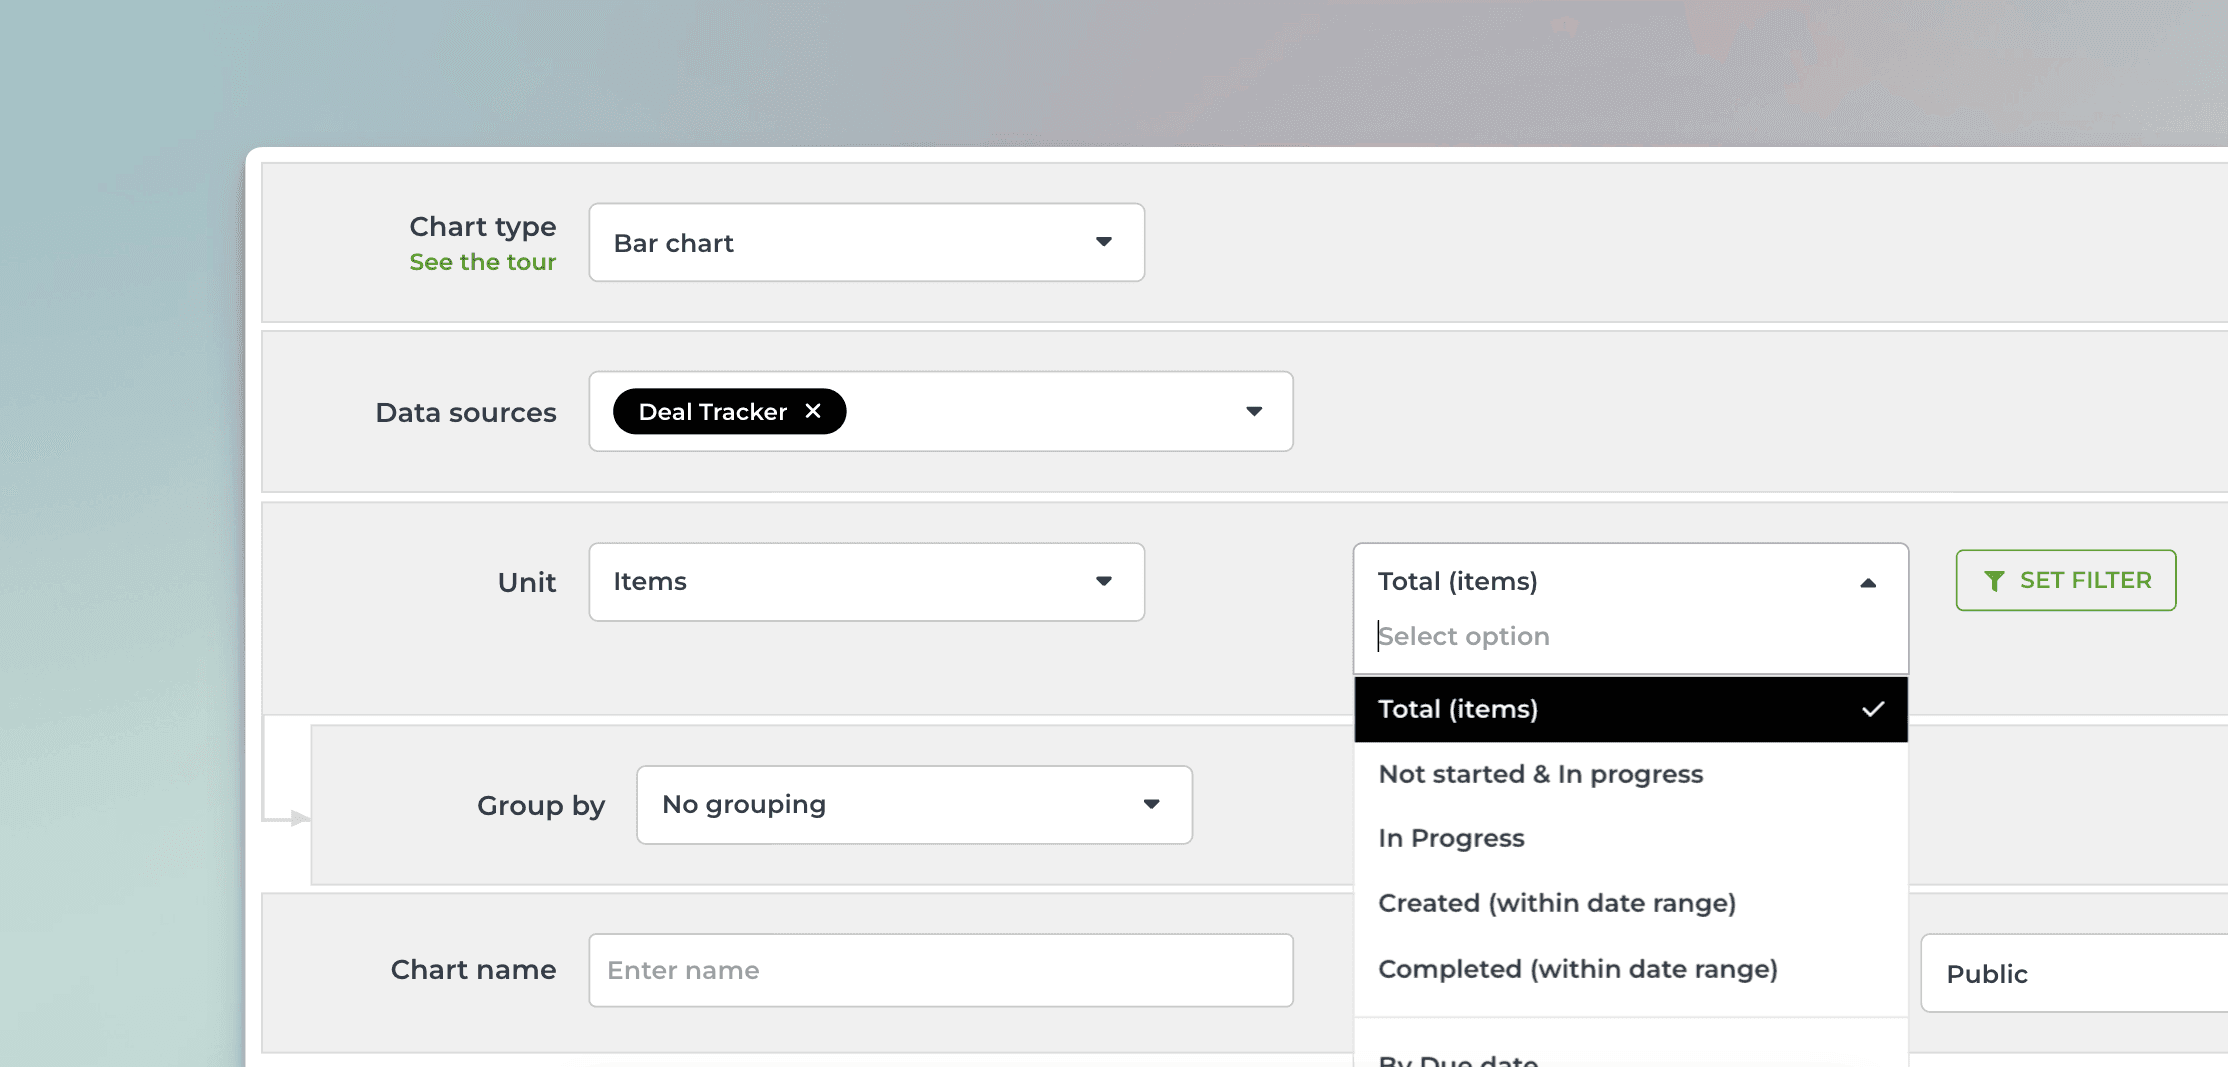
The options in the menu filters the items as follows:
Total (items) -> Include all items
Not started & In progress -> Include items that are in the stages mapped to Not started or In progress
In progress -> Include items that are in the stages mapped to In progress
Created -> Include all items created within a date range, regardless of stage
Completed -> Include all items moved to a stage mapped to Done within a date range.
The content in the Insights section is generated according to the selected status column. Learn more about workflow mapping from this guide.
Select items based on Date fields
You can track work based on any of your Date fields. When you create a custom chart, you can pick a date field instead of status as the primary filter. Let's assume you have a field Close date on your board. When you select by Close date, the chart will include tasks that have the close date within the selected date range:
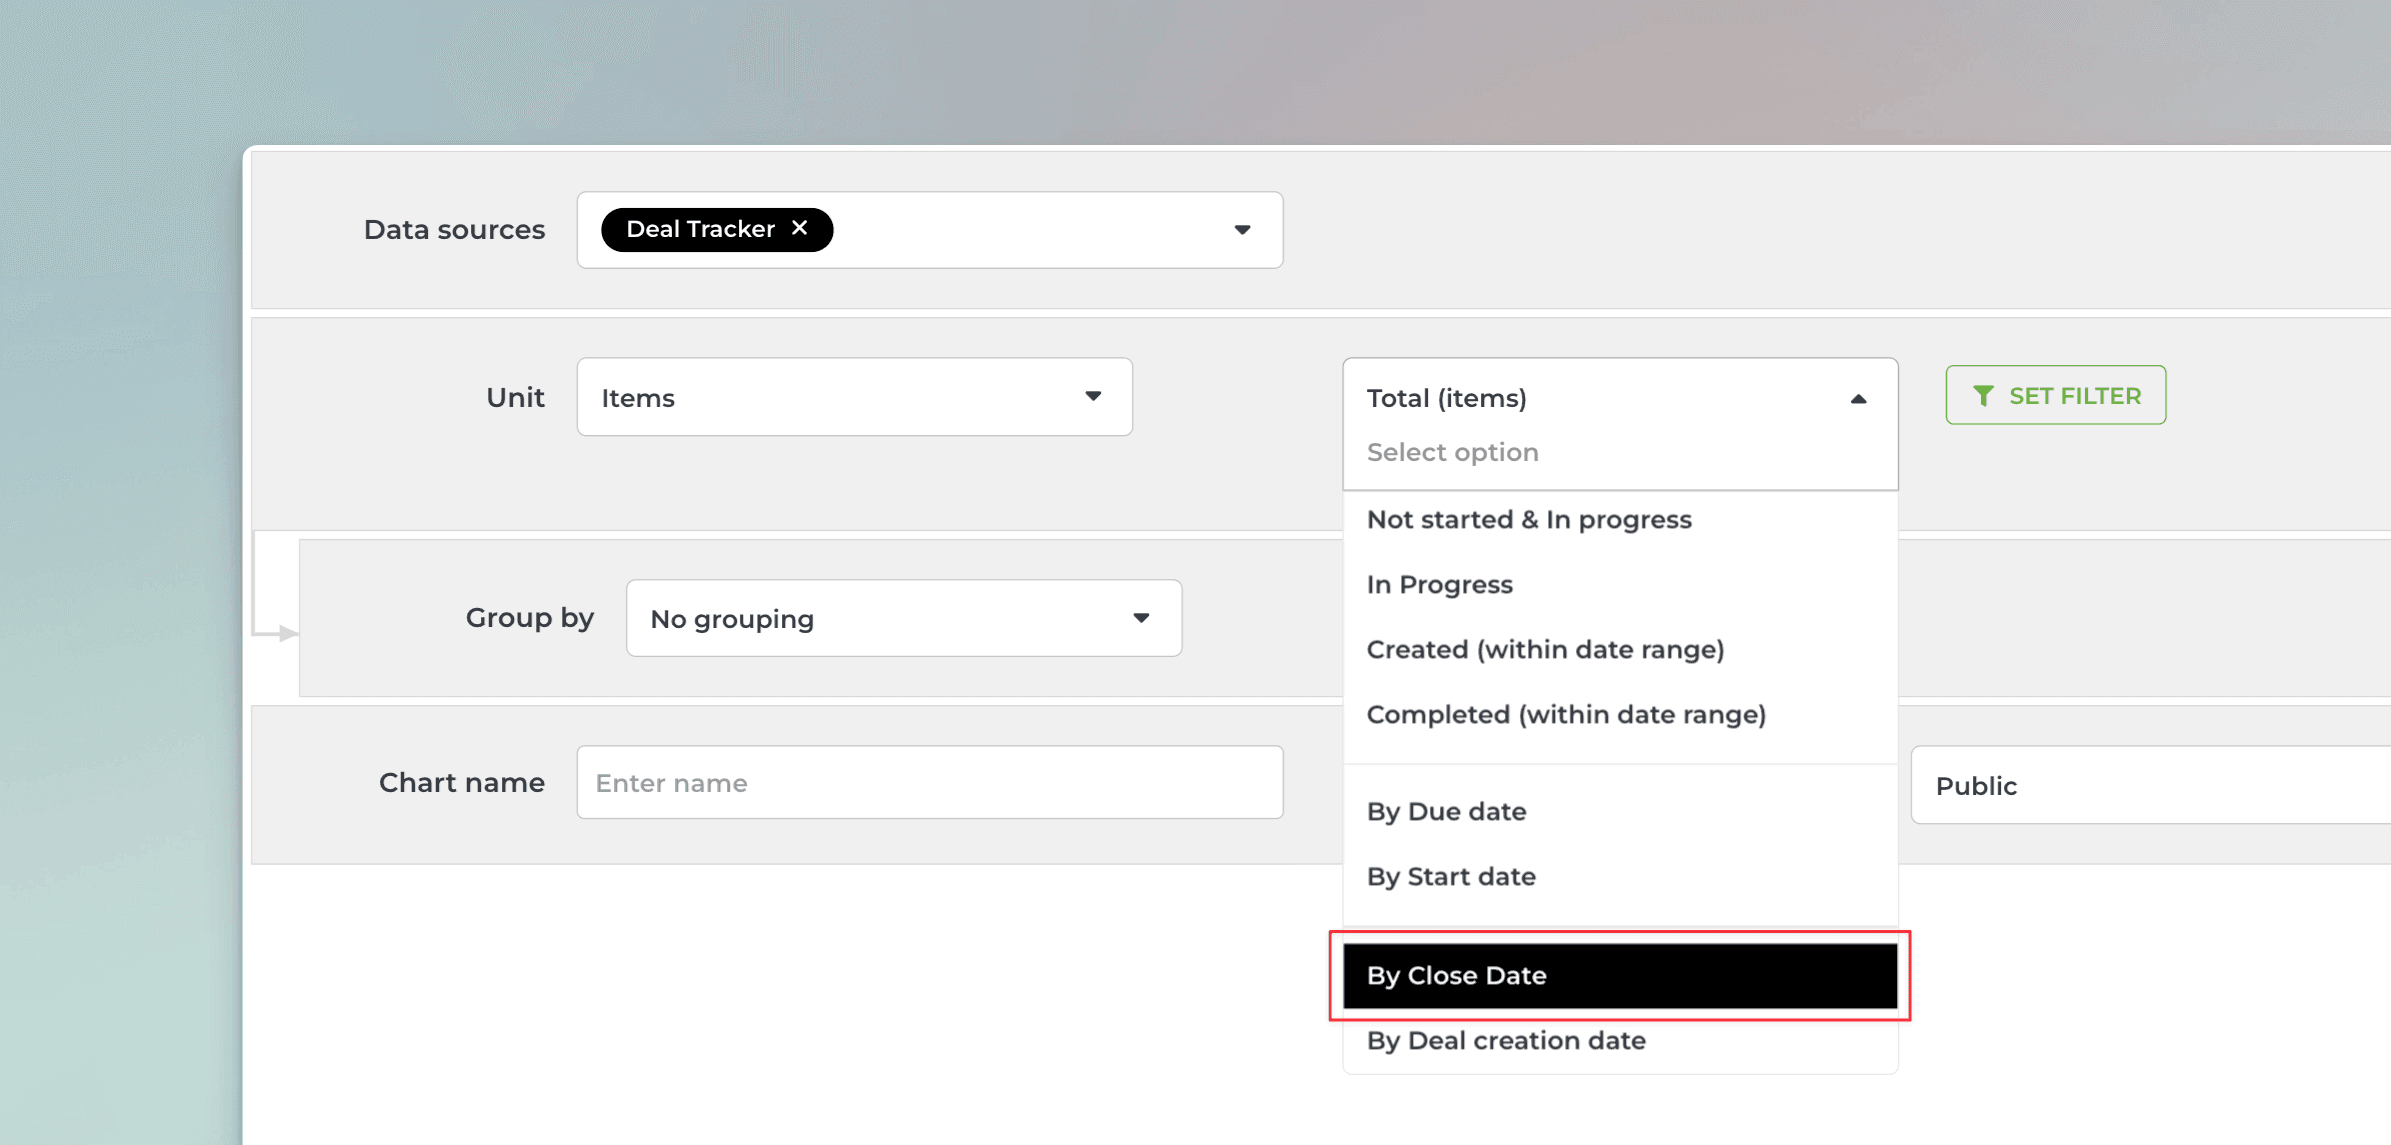
That will work the same way as if you had selected Completed (within date range), except that it will only look at the value in the date column. If the date is within the date range, it is included, regardless of the workflow state of that item.
Select items based on Time tracking columns
You can select items for a chart based on when the time was logged on them. You can select items based on their time tracking entries by picking
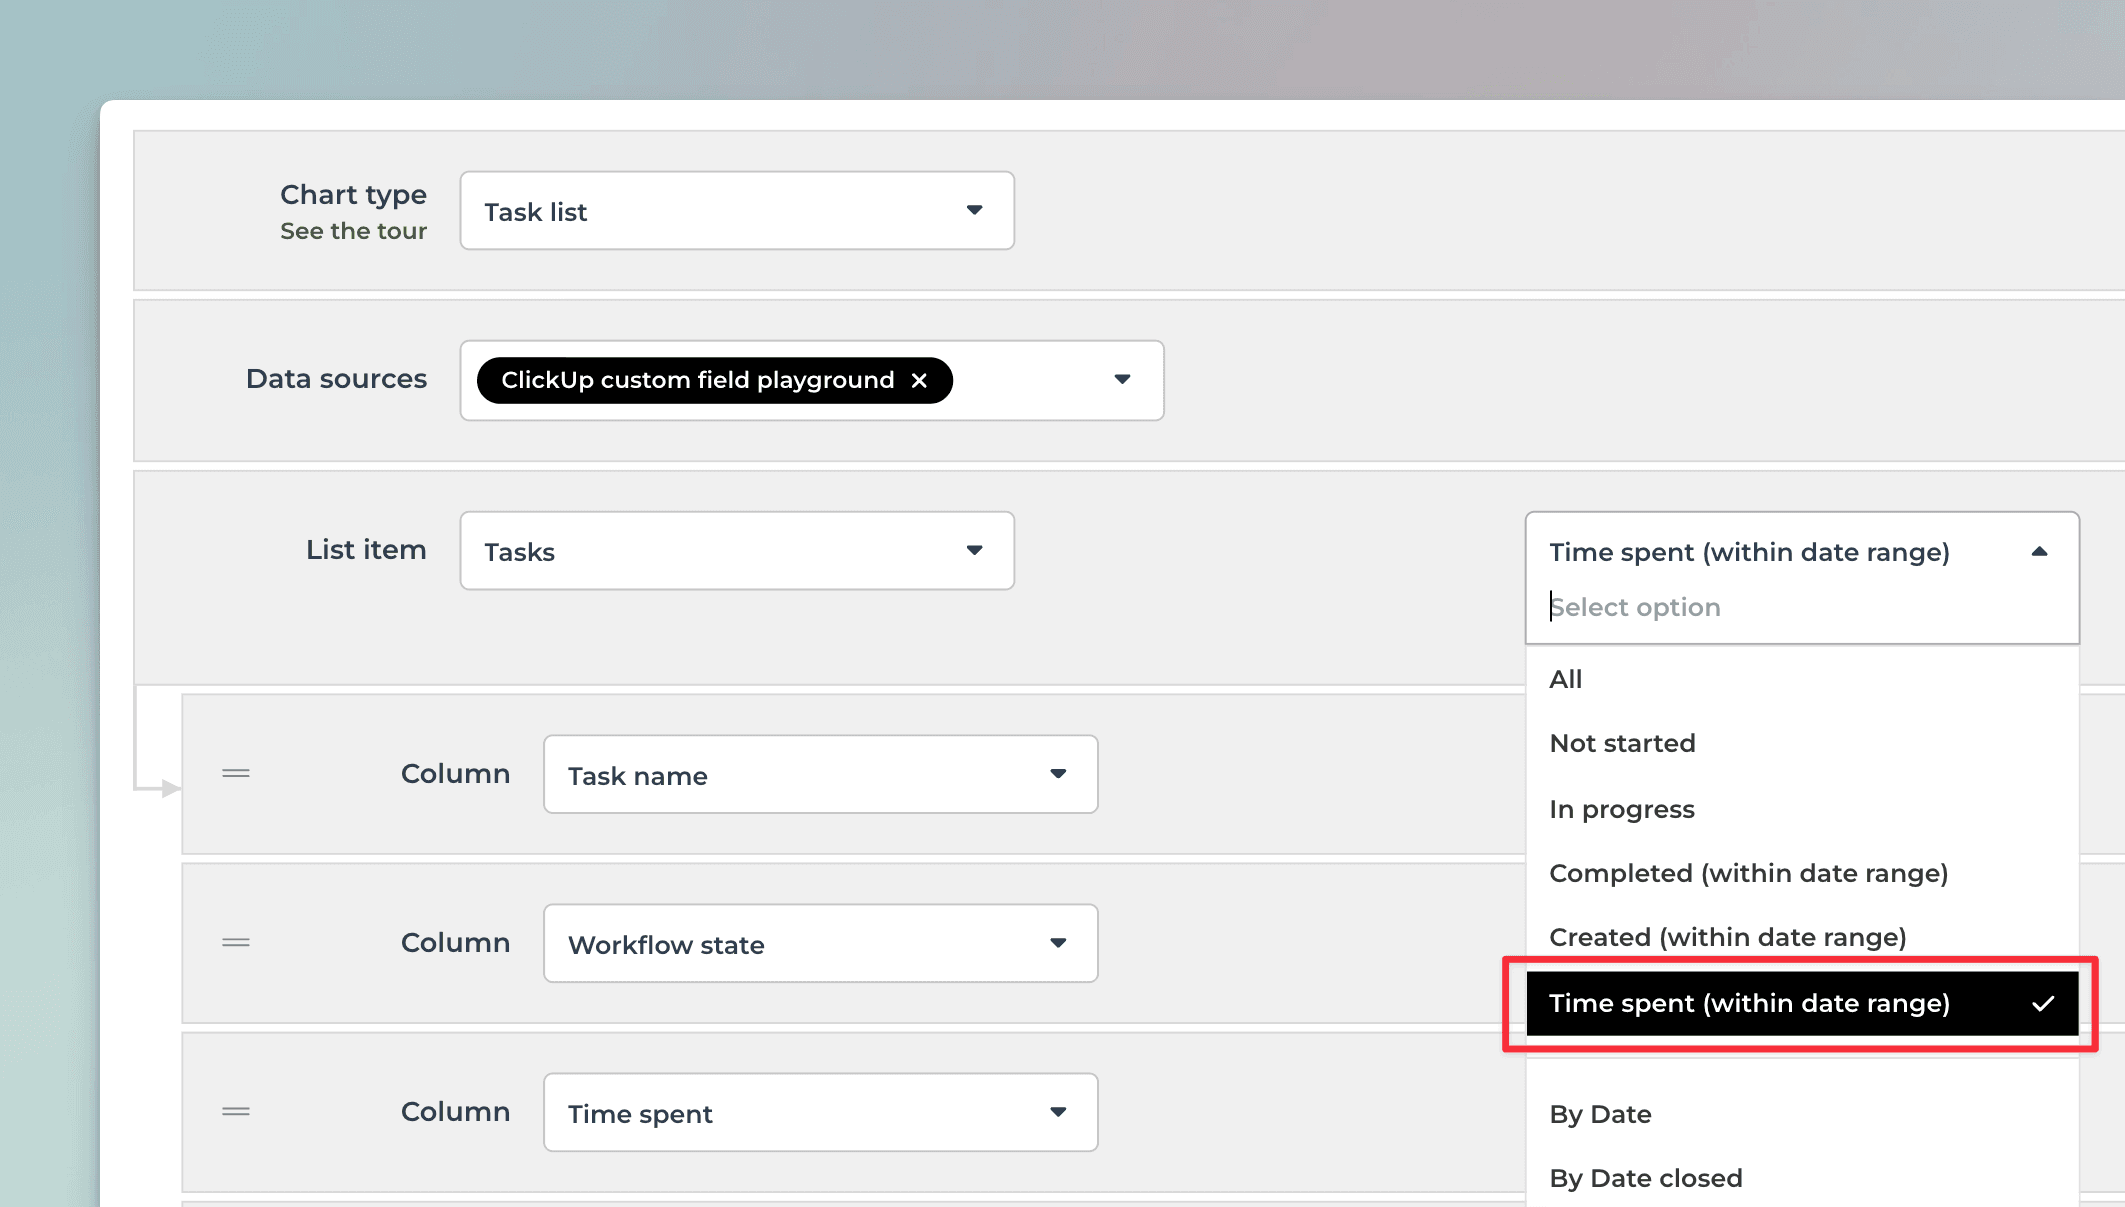
When you select a Time spent (within date range) from the menu, a date range menu appears at the bottom:
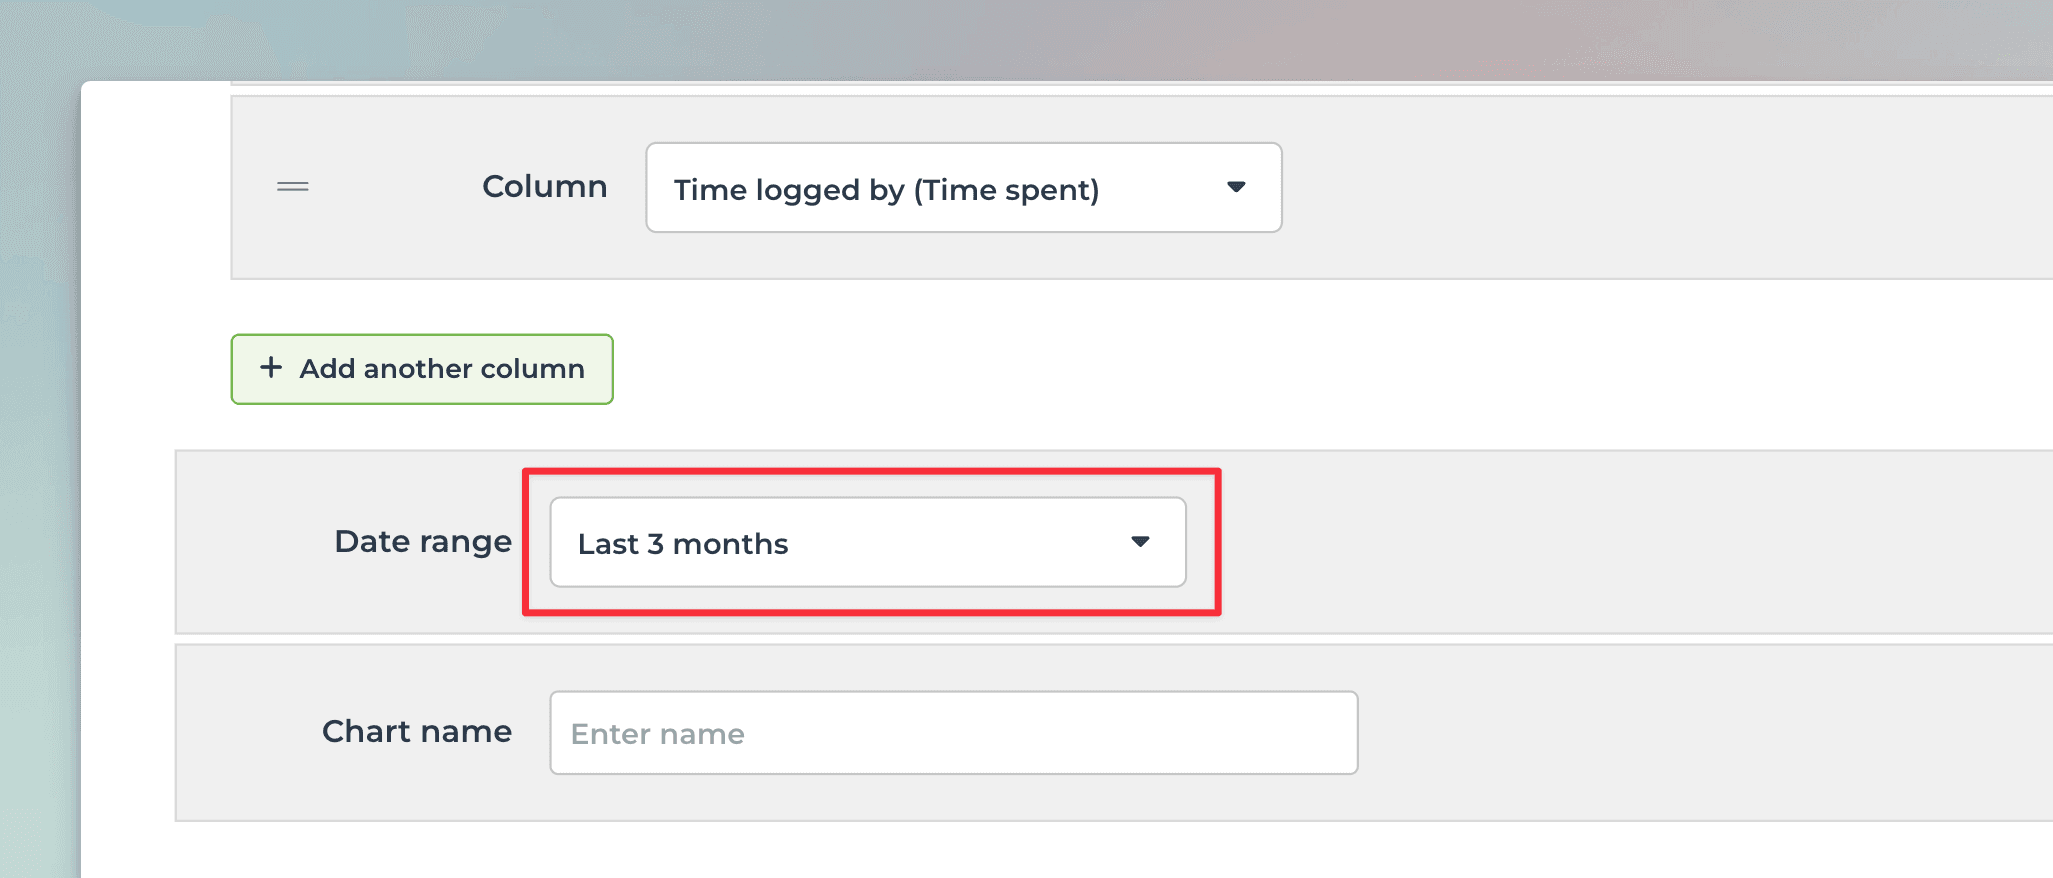
The Date range refers to when the hours were logged. The tasks included in the chart are the ones that have time tracking entries within the selected date range.
Select items based on other columns
Even if you don't have any Status, Date, or Timeline columns on your board, you can still create charts with Screenful. In the chart editor, simply select Total (items):

Then narrow it down to any subset by setting a filter. First, click the filter button next to the menu:

Then select the property you want to filter the data by:

The filter menu contains all the properties that are available for filtering. You can learn more from the filtering guide.
About Screenful
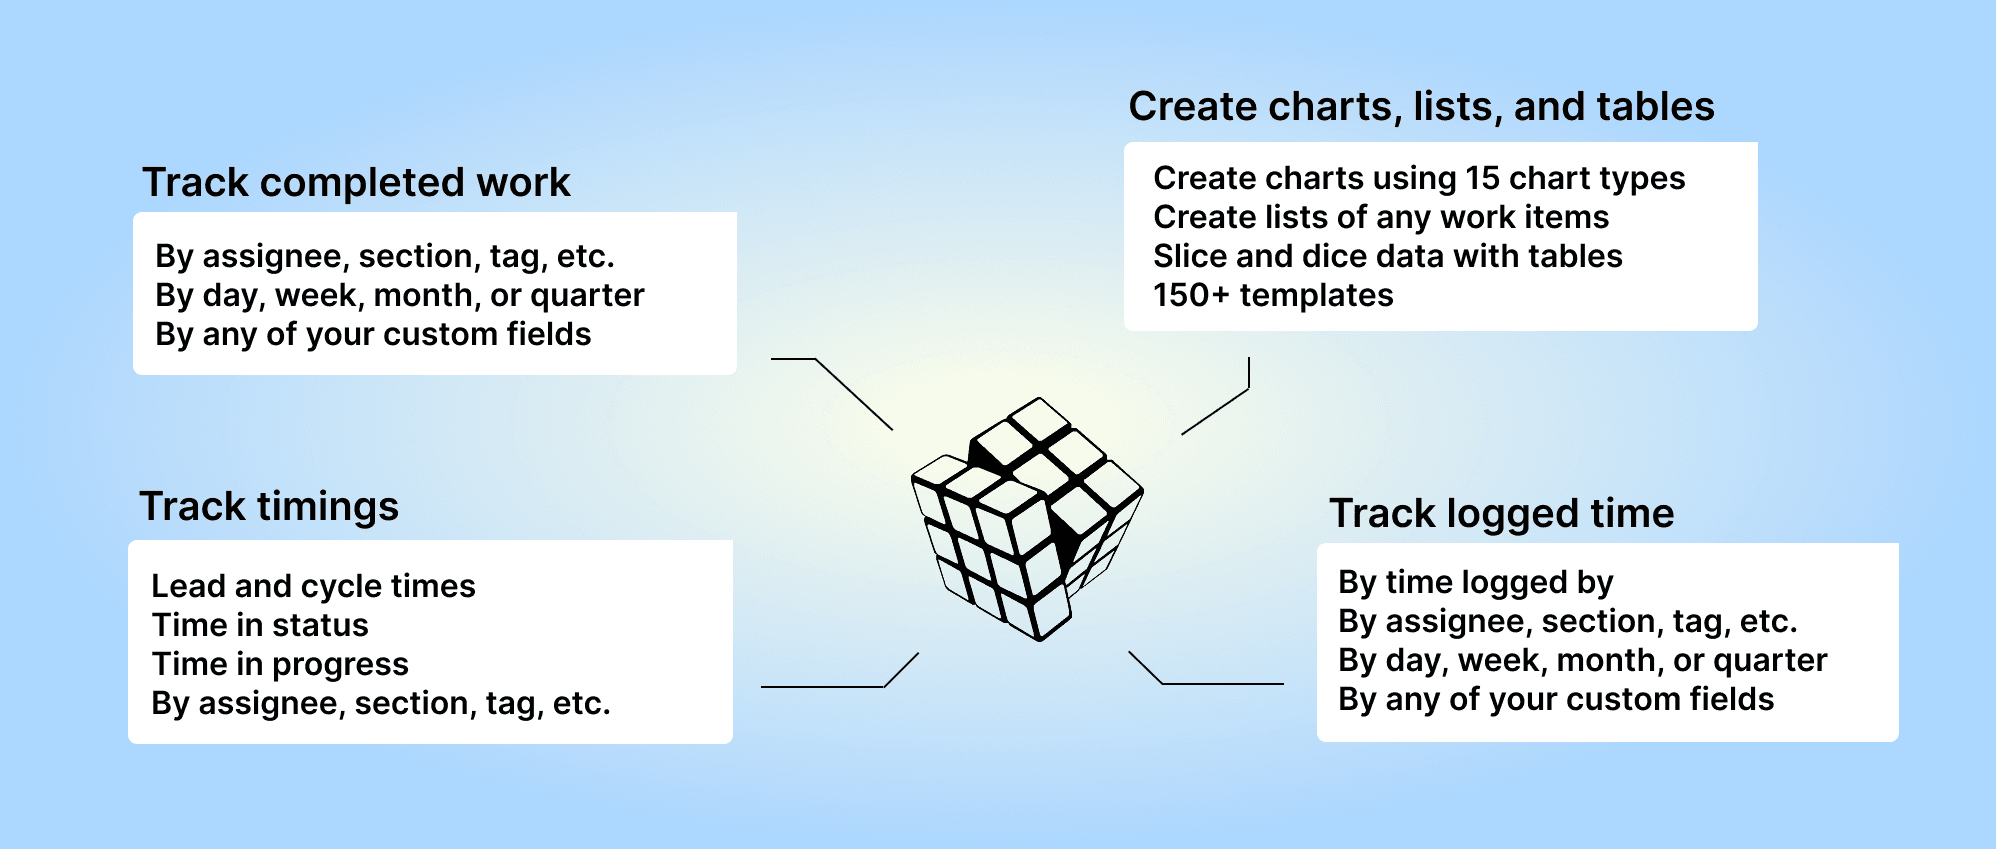
Screenful provides AI-assisted analytics for data in ClickUp. You can slice & dice your data with 15 different chart types, and click through to drill into details.
Learn more
Book a free onboarding call
Need help with setting up your charts and reports? Don't find a metric you are looking for? Book a call with our expert. We'd love to help you supercharge your reporting!