Importing subtasks
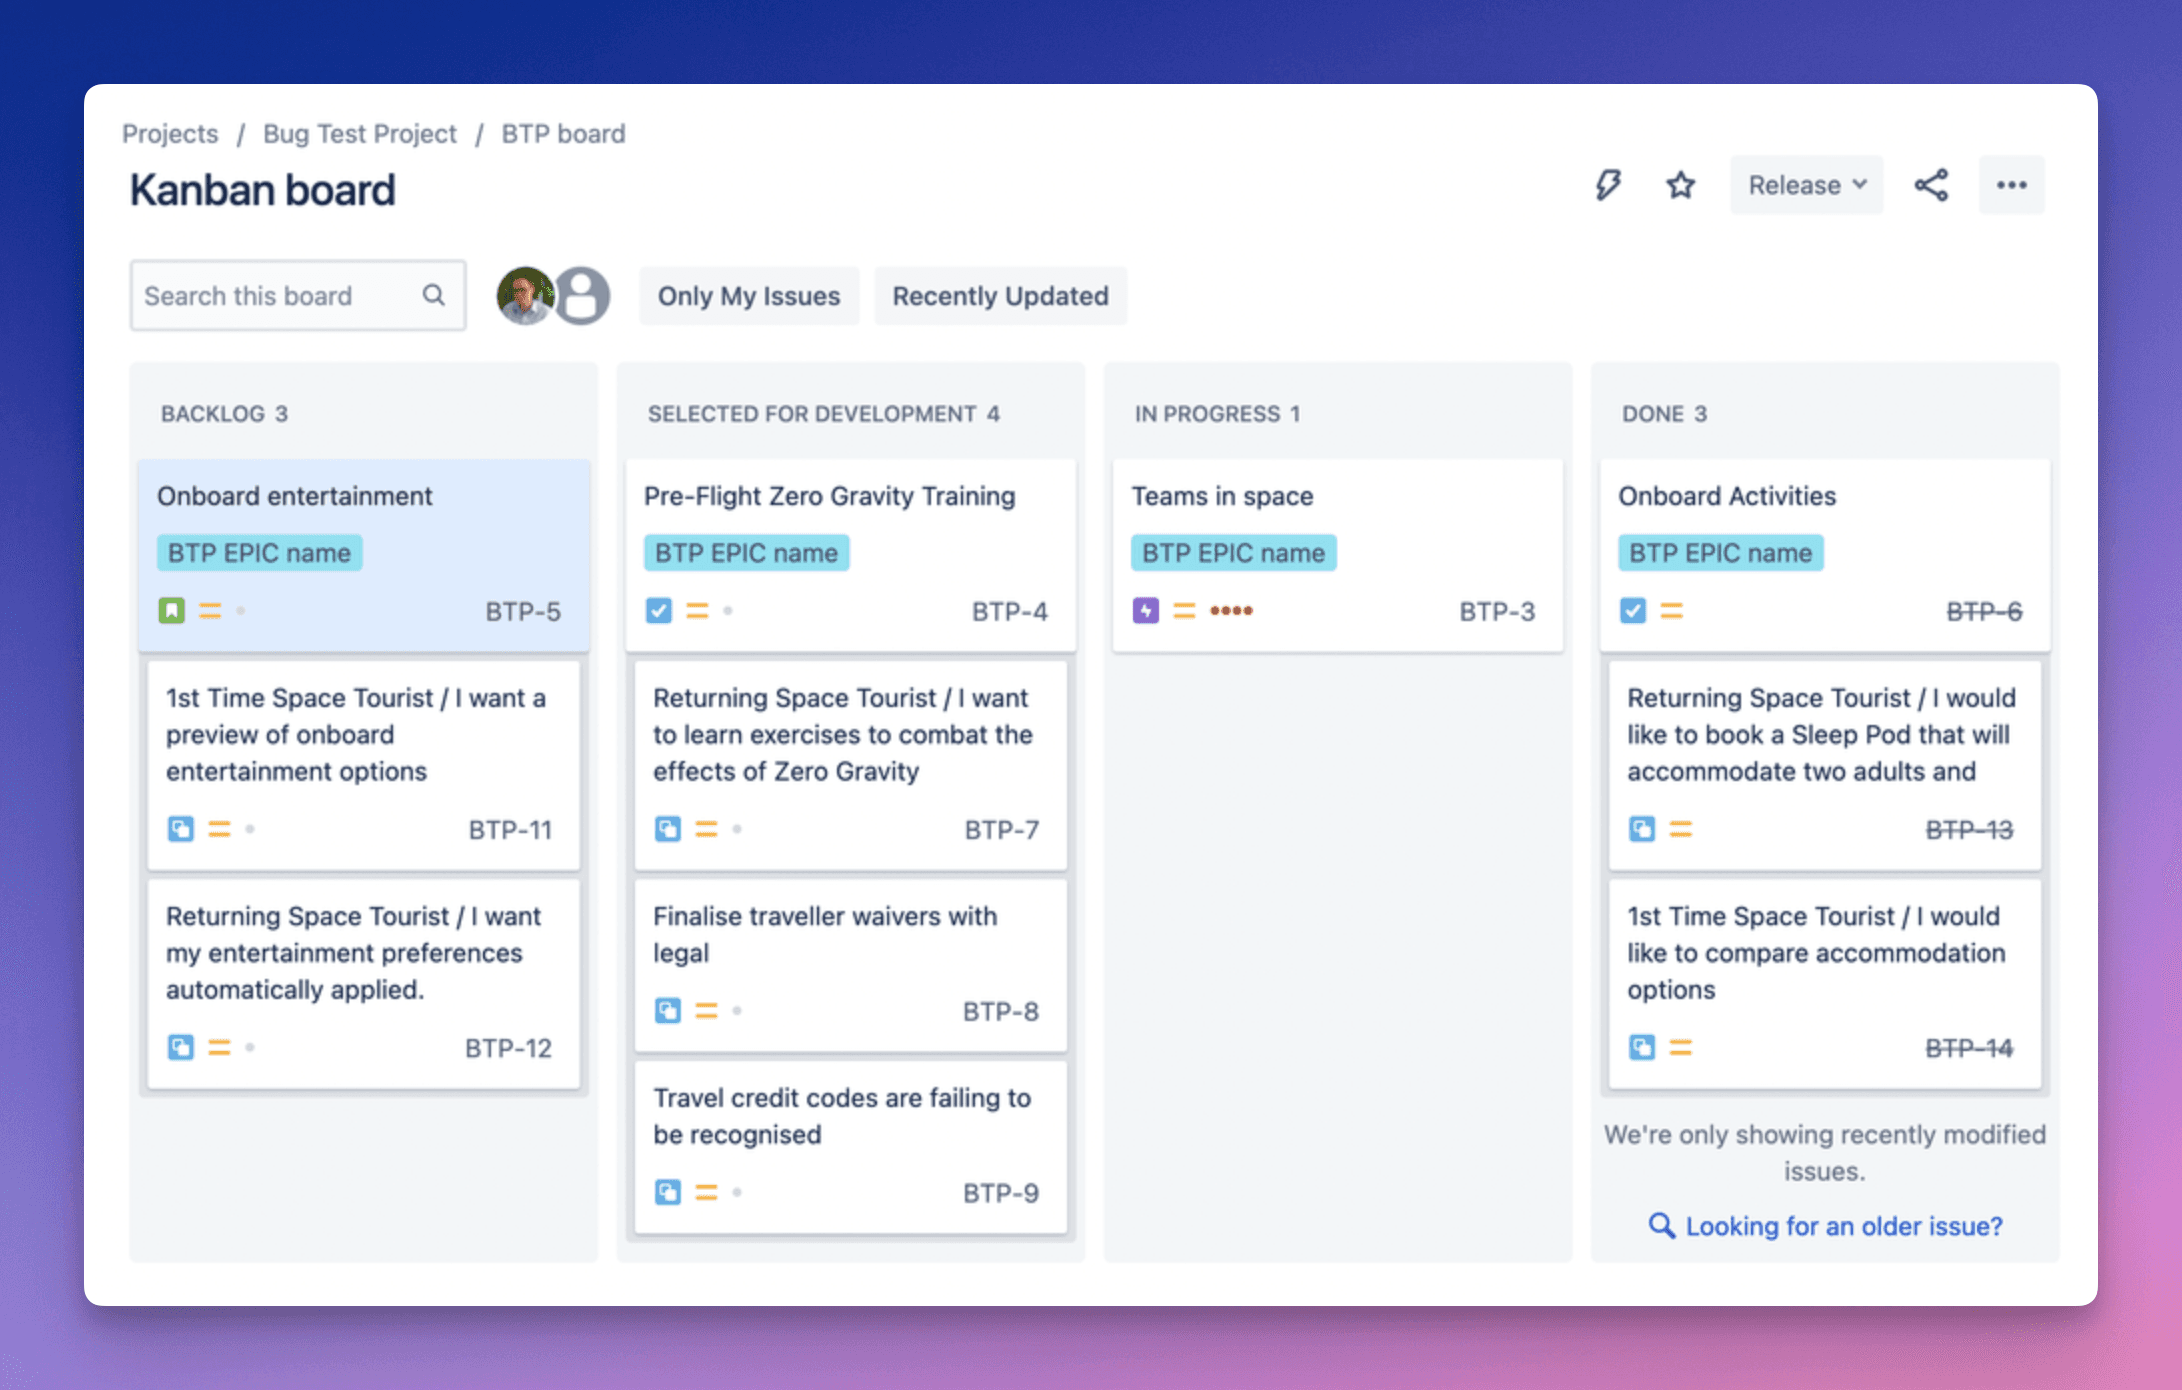
Here is an example of an Jira board that contains subtasks:
To import top-level issues and subtasks of any Jira board, proceed to Integrations in Screenful settings and add a new data source by clicking Add boards.
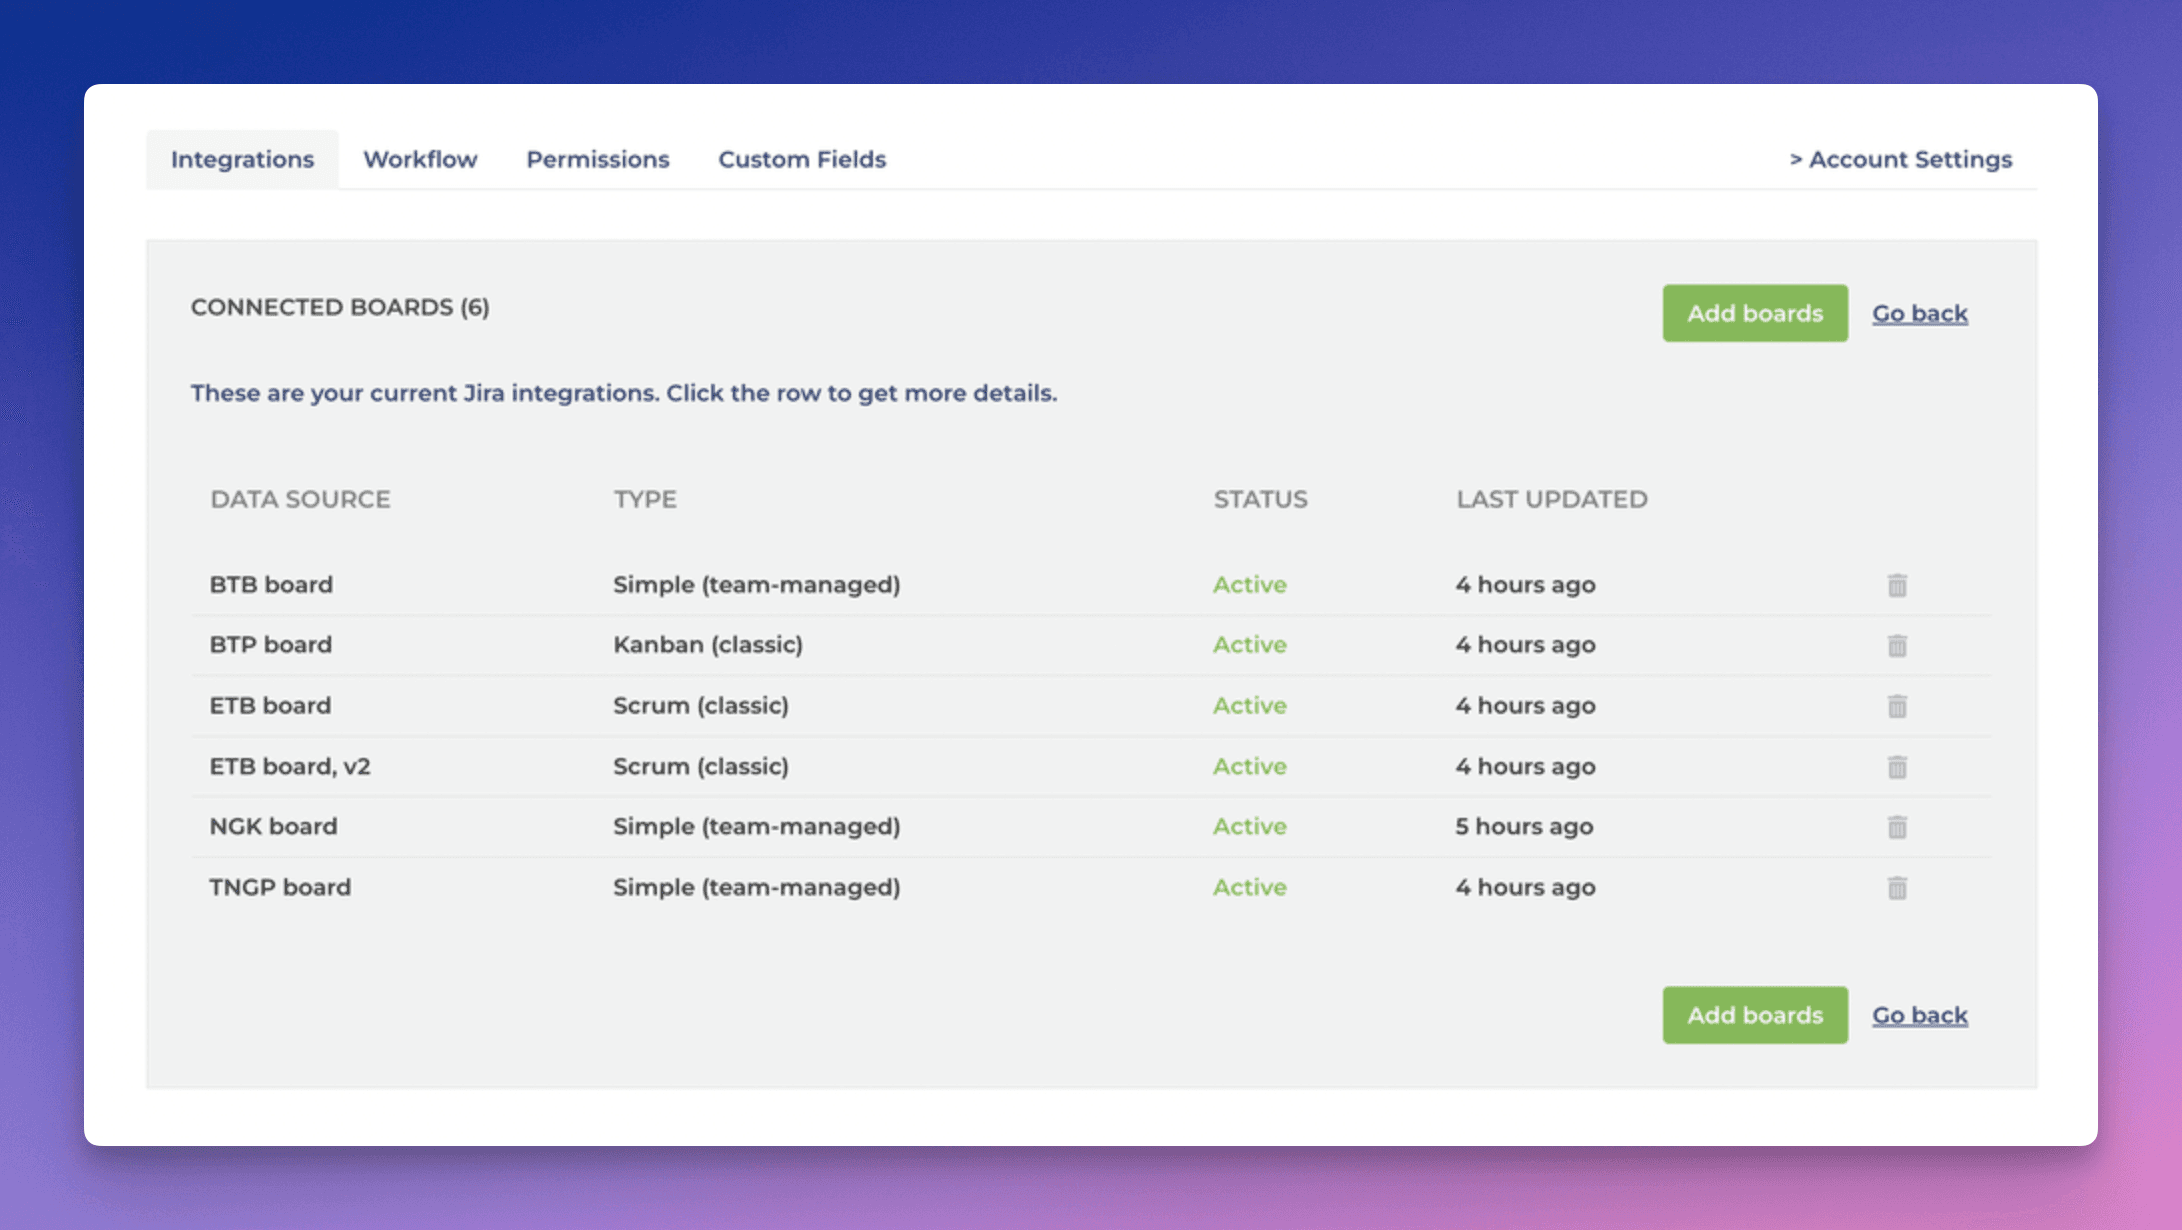
When you import a board as a data source, all issues and subtasks are synced from your Jira instance, and they are available to be used in charts and reports.
Rolling up values from subtasks
You can roll up values from subtasks by selecting Parent as the row in the Table chart.
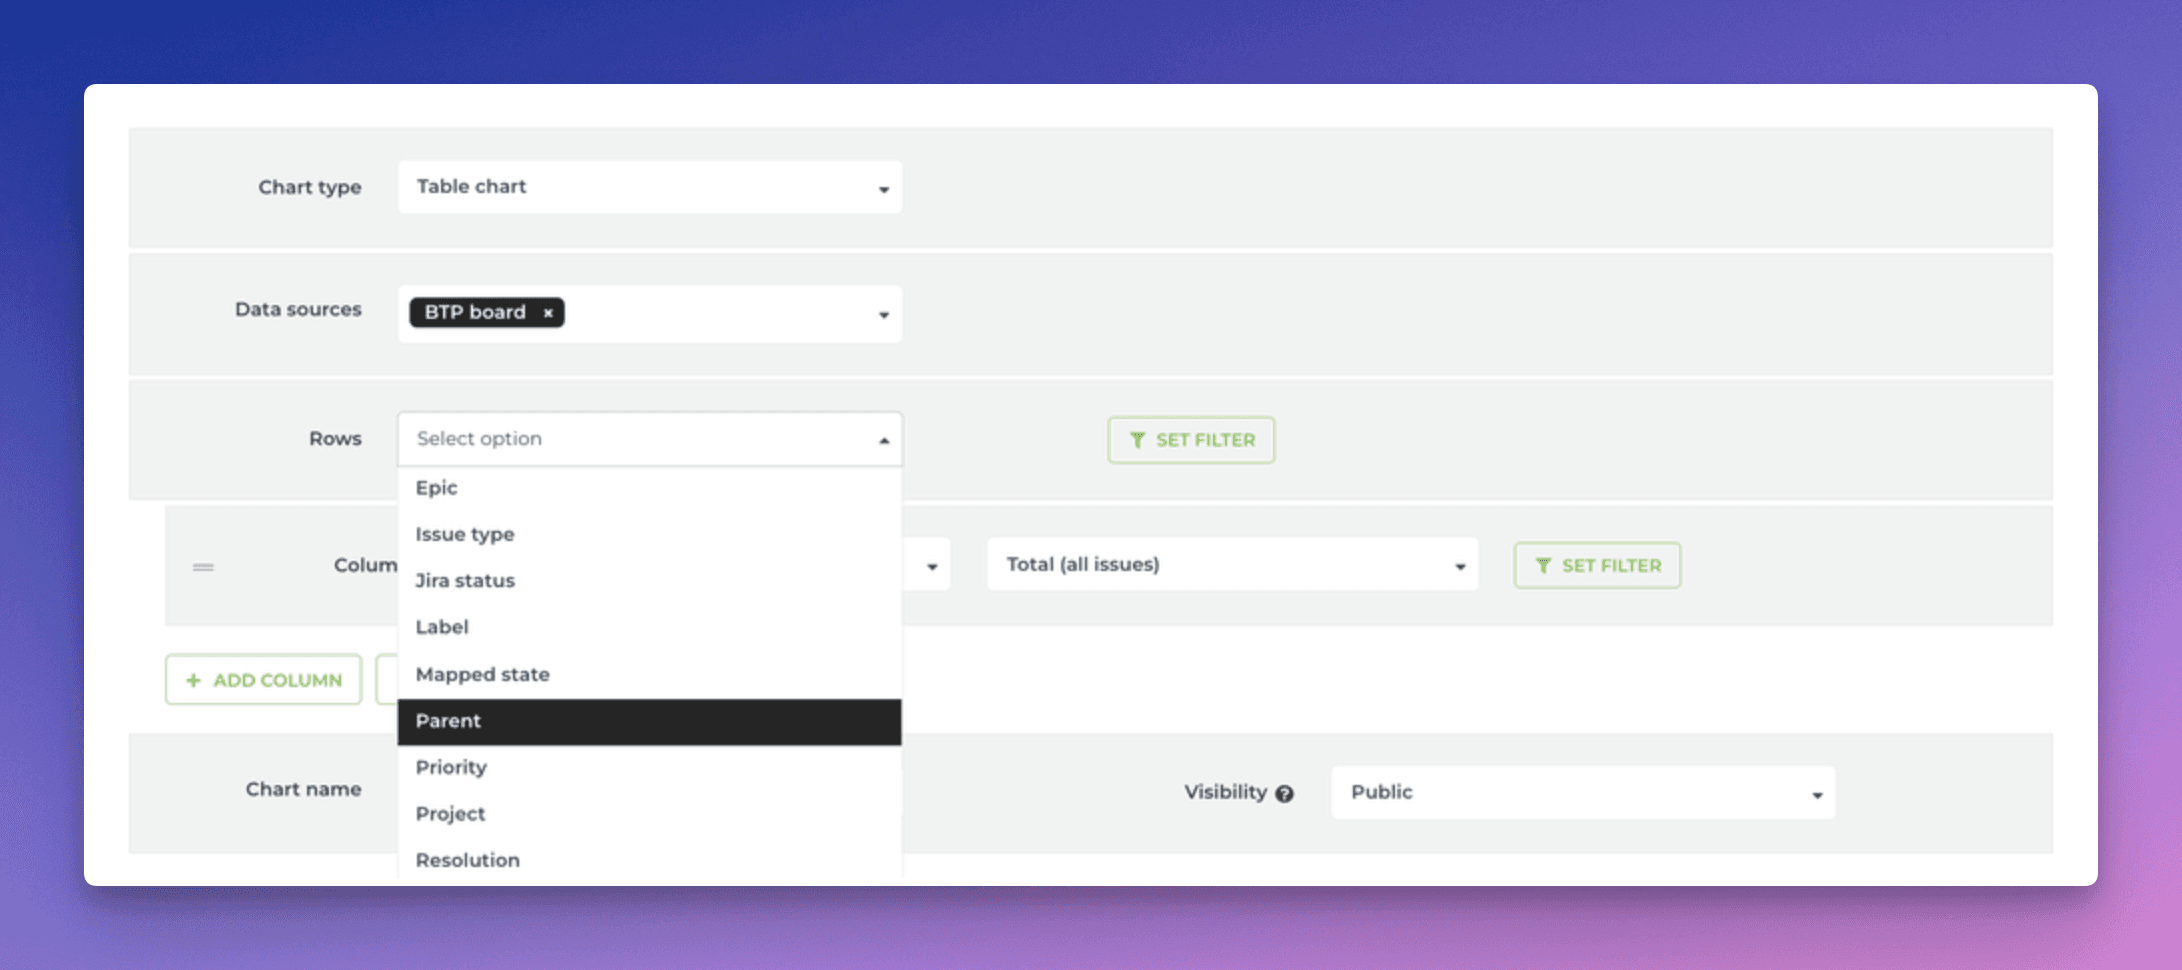
Now each row in the table corresponds to the top level issue, and the metrics shown in columns are the summaries from the subtasks. For example, a column can show the total number of subtasks for a parent, the total number of completed subtasks, or the total number of story points assigned etc.
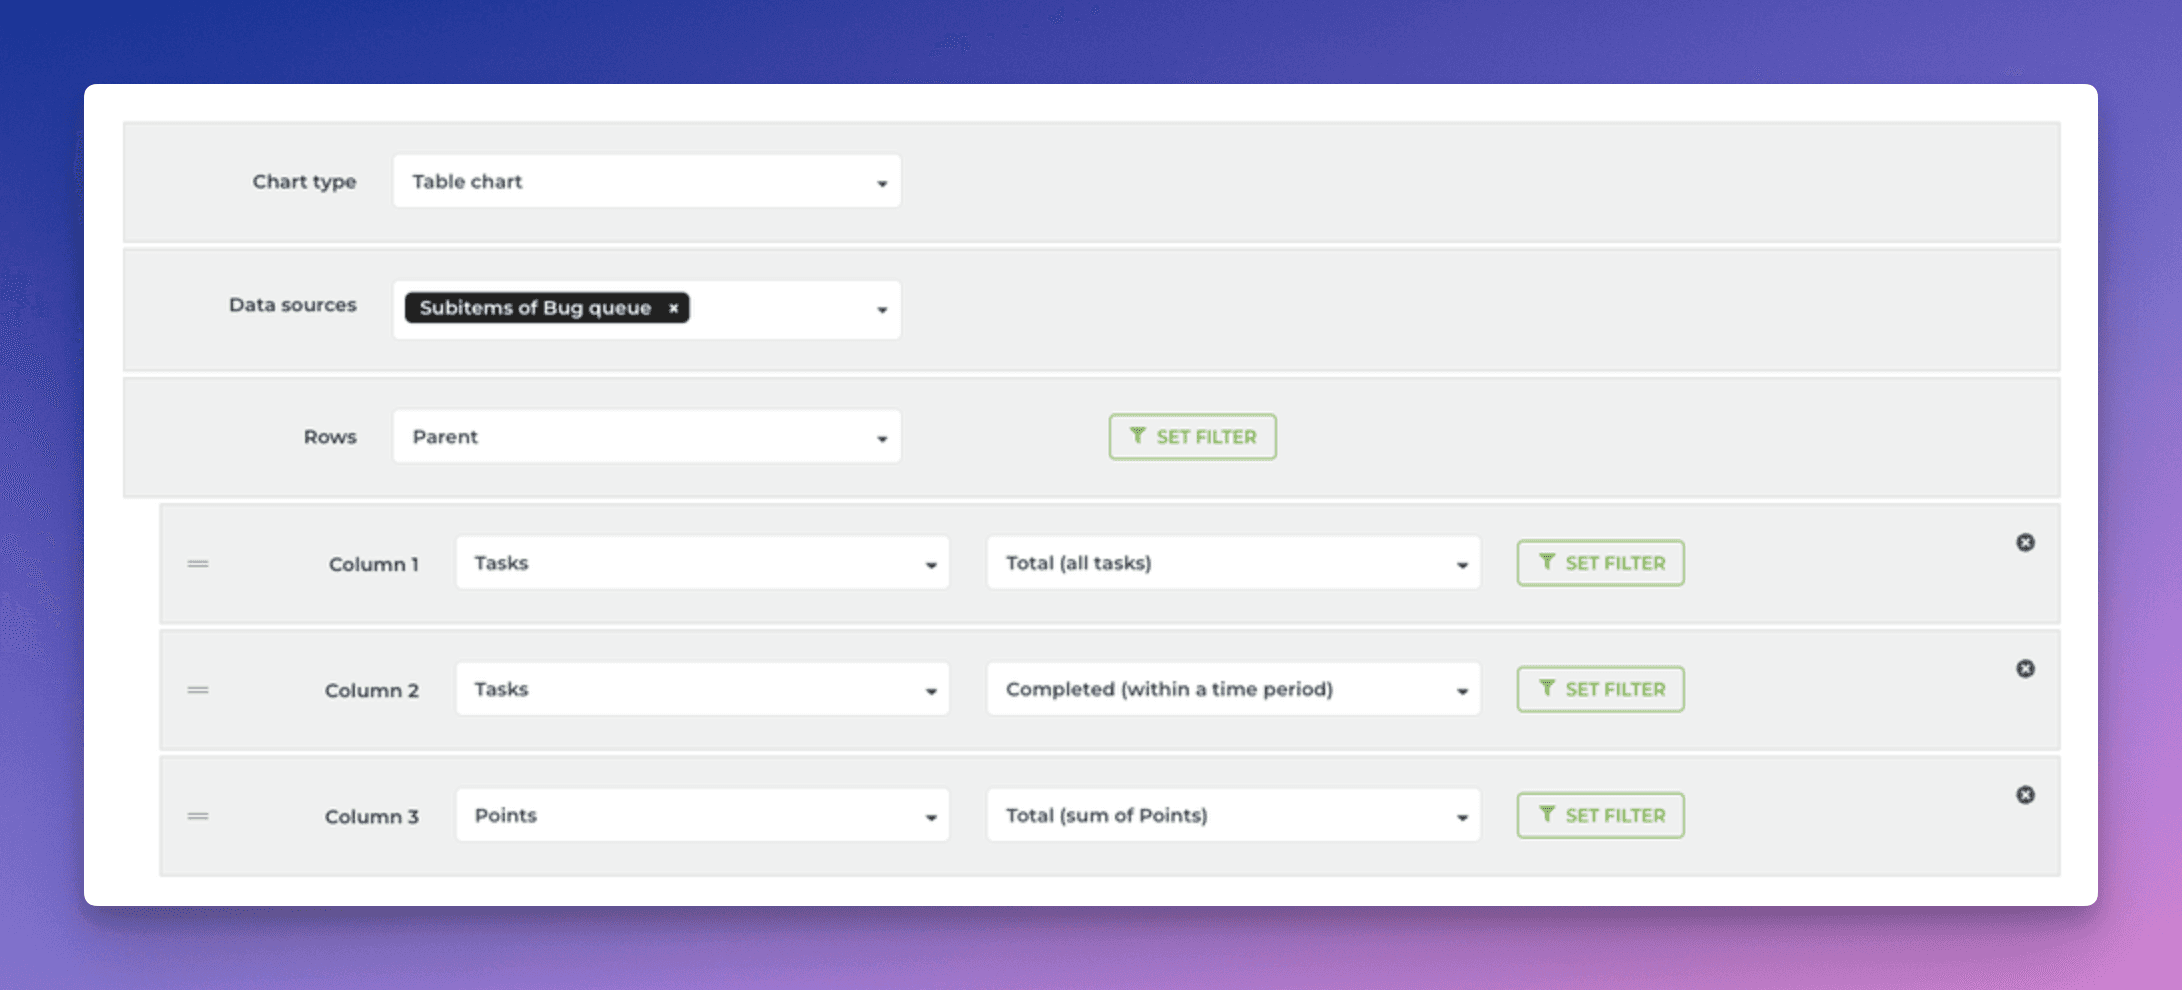
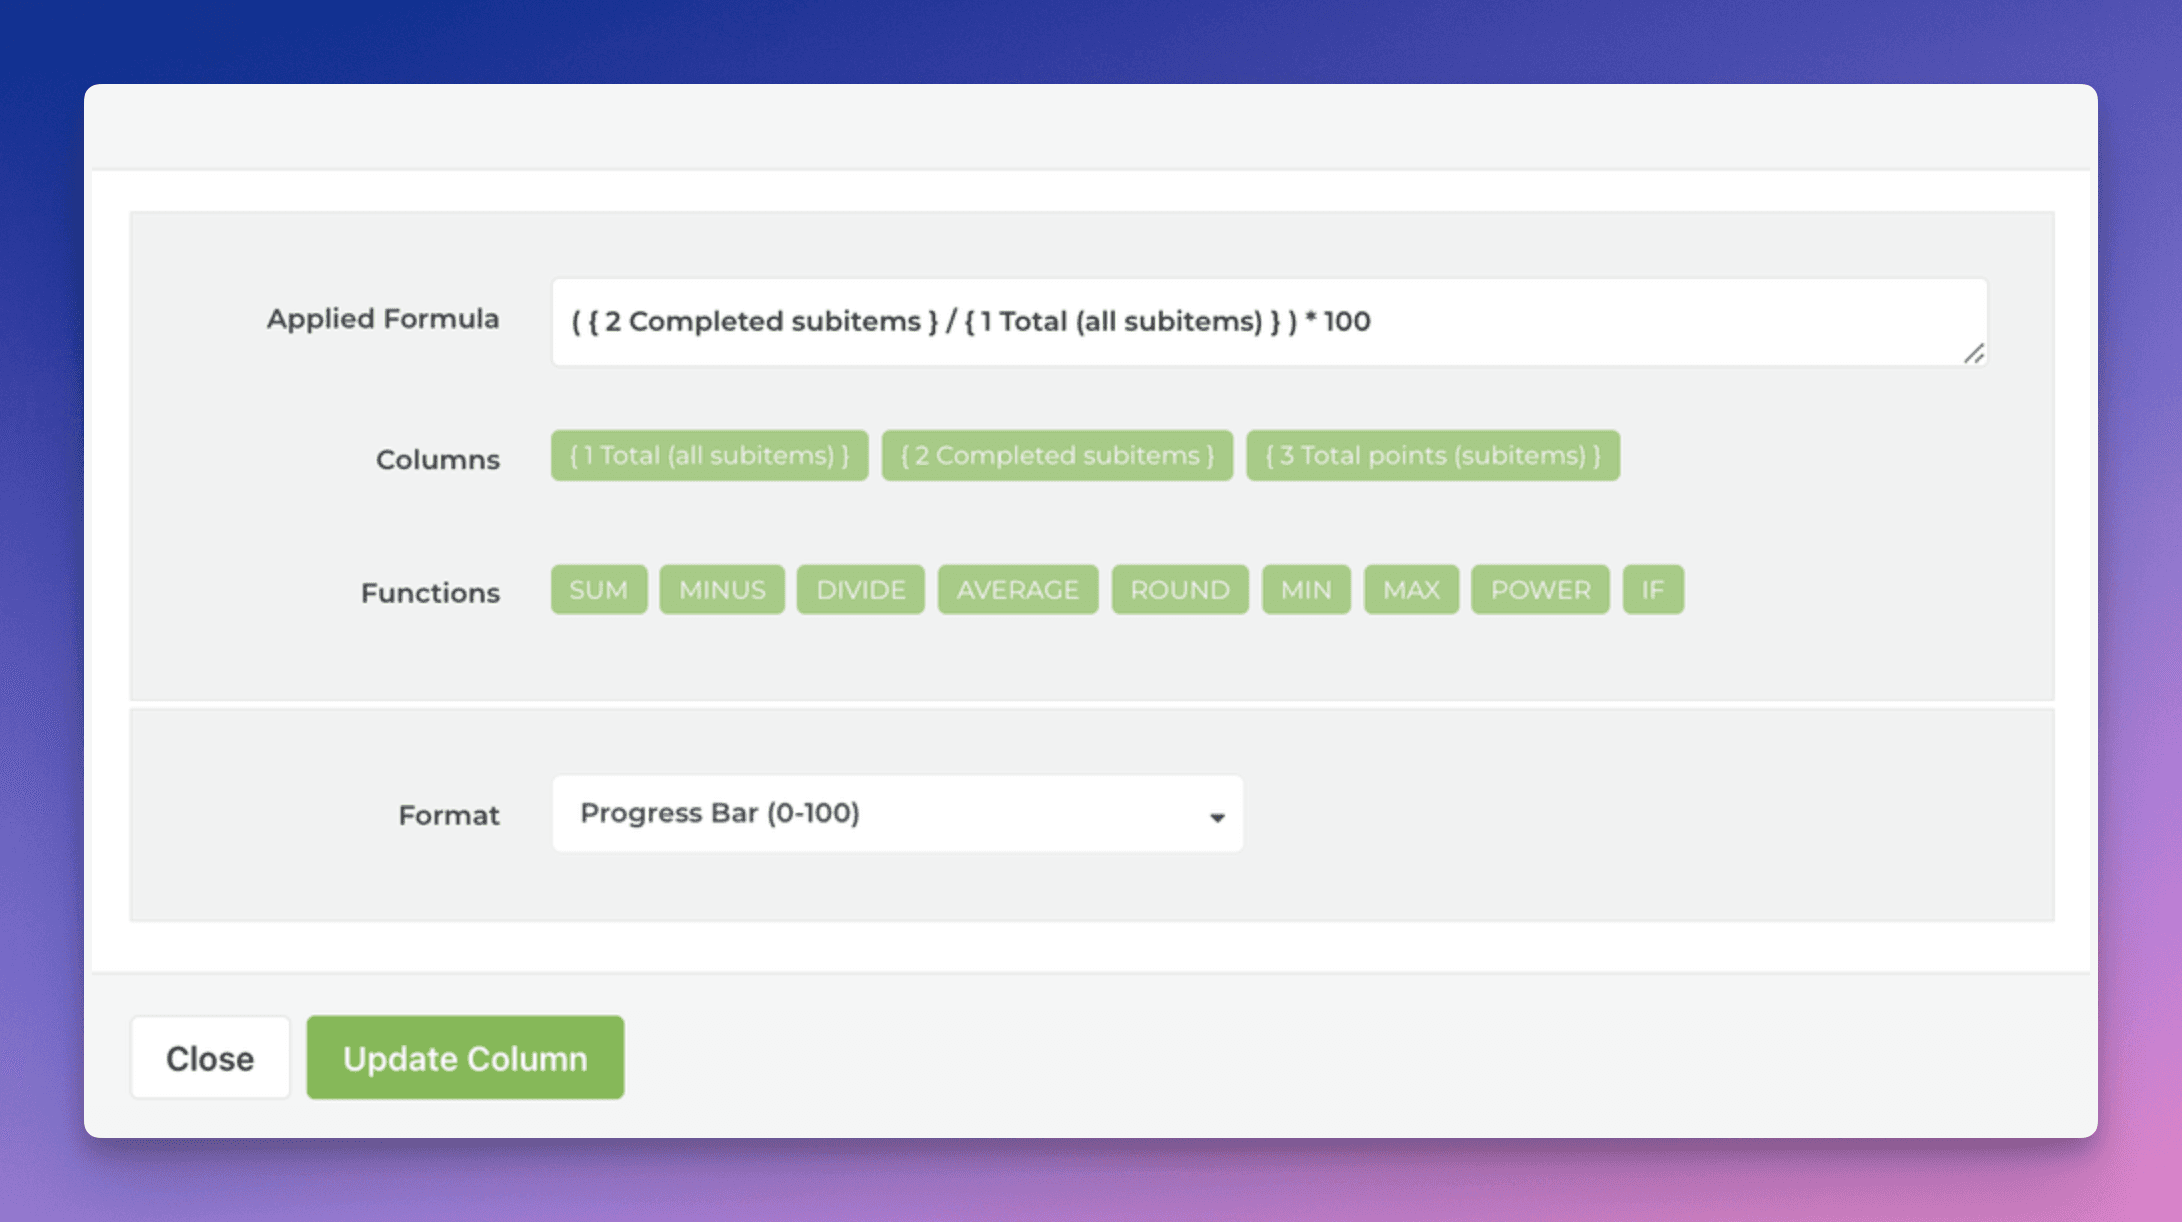
The columns are configurable, so you can roll up any of the available metrics from subtasks. The progress bar can be used to show the completion percentage of the subtasks. It can be added to the chart by applying a formula:
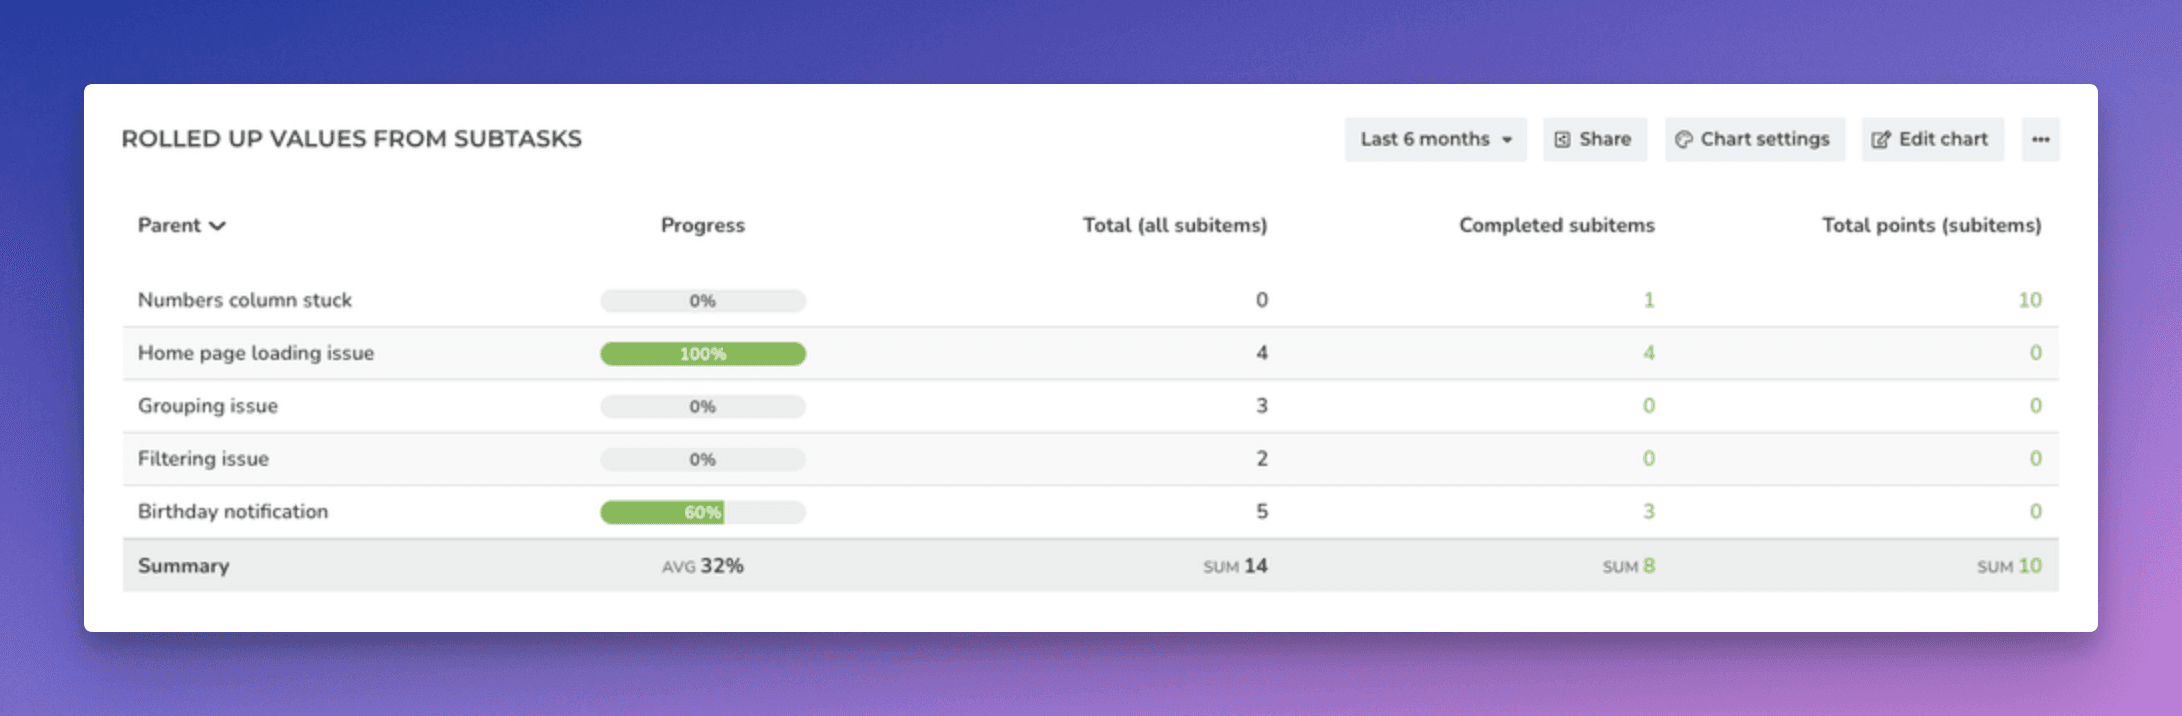
Here’s the final chart:
Filtering by subtasks
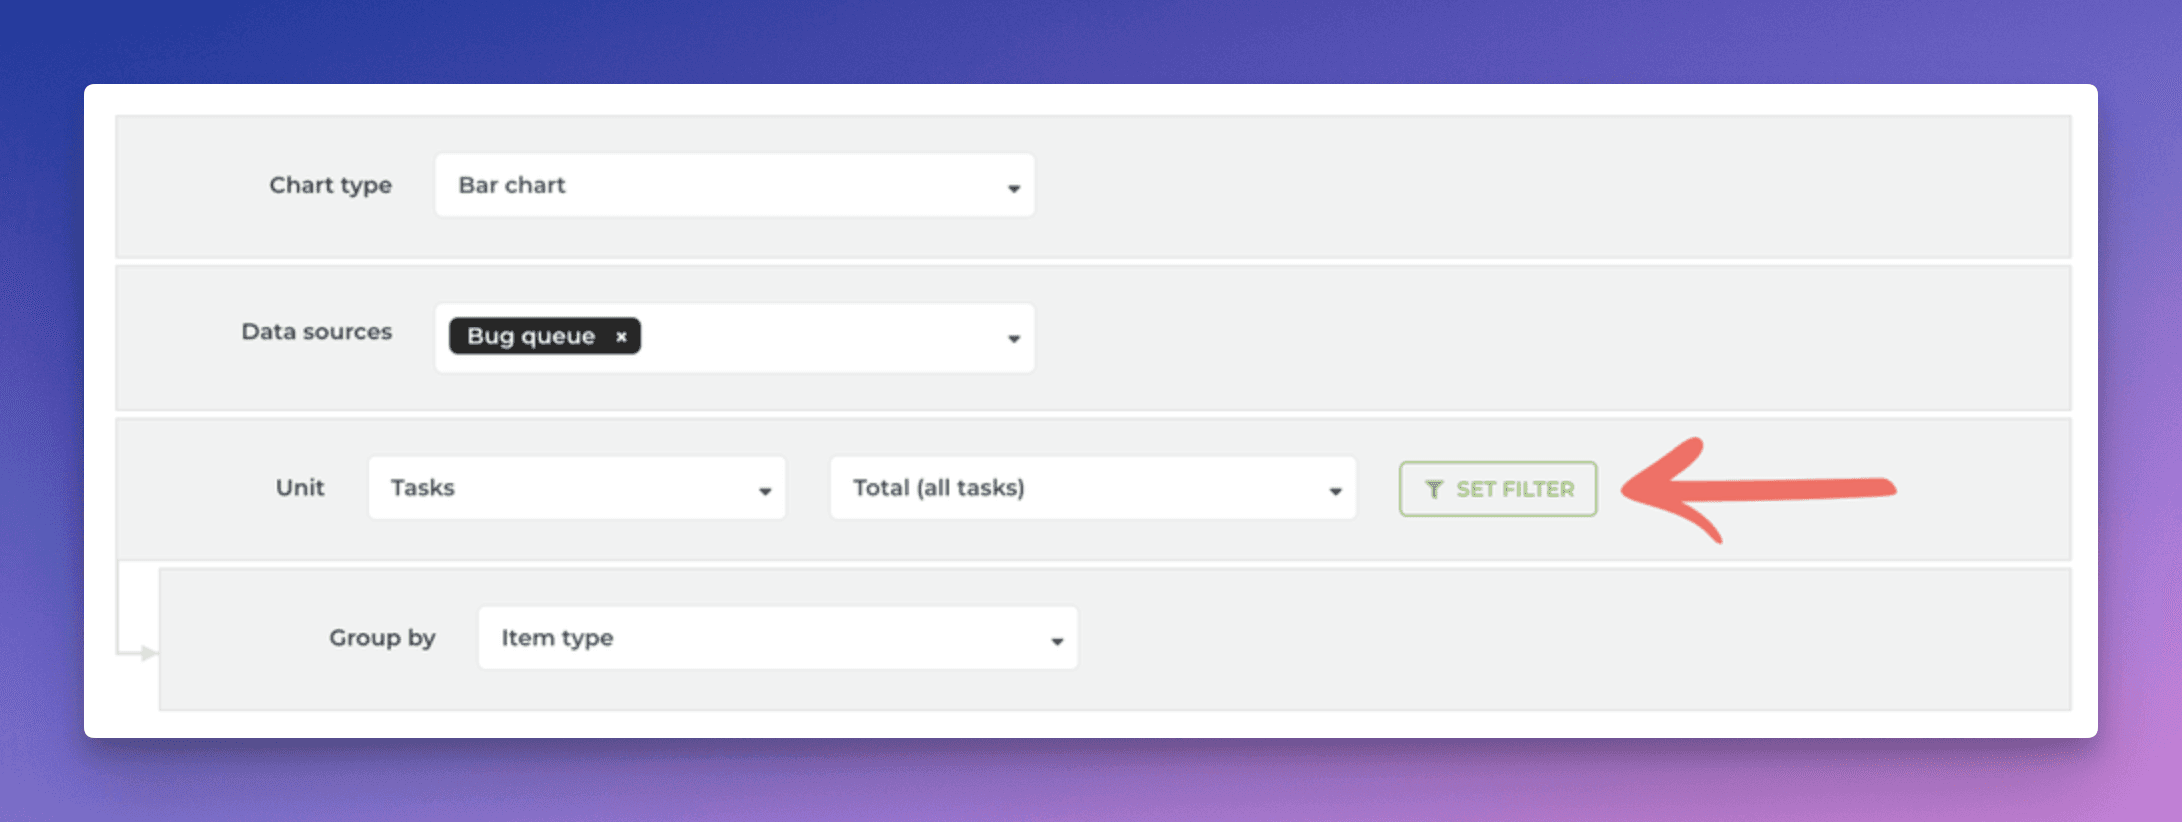
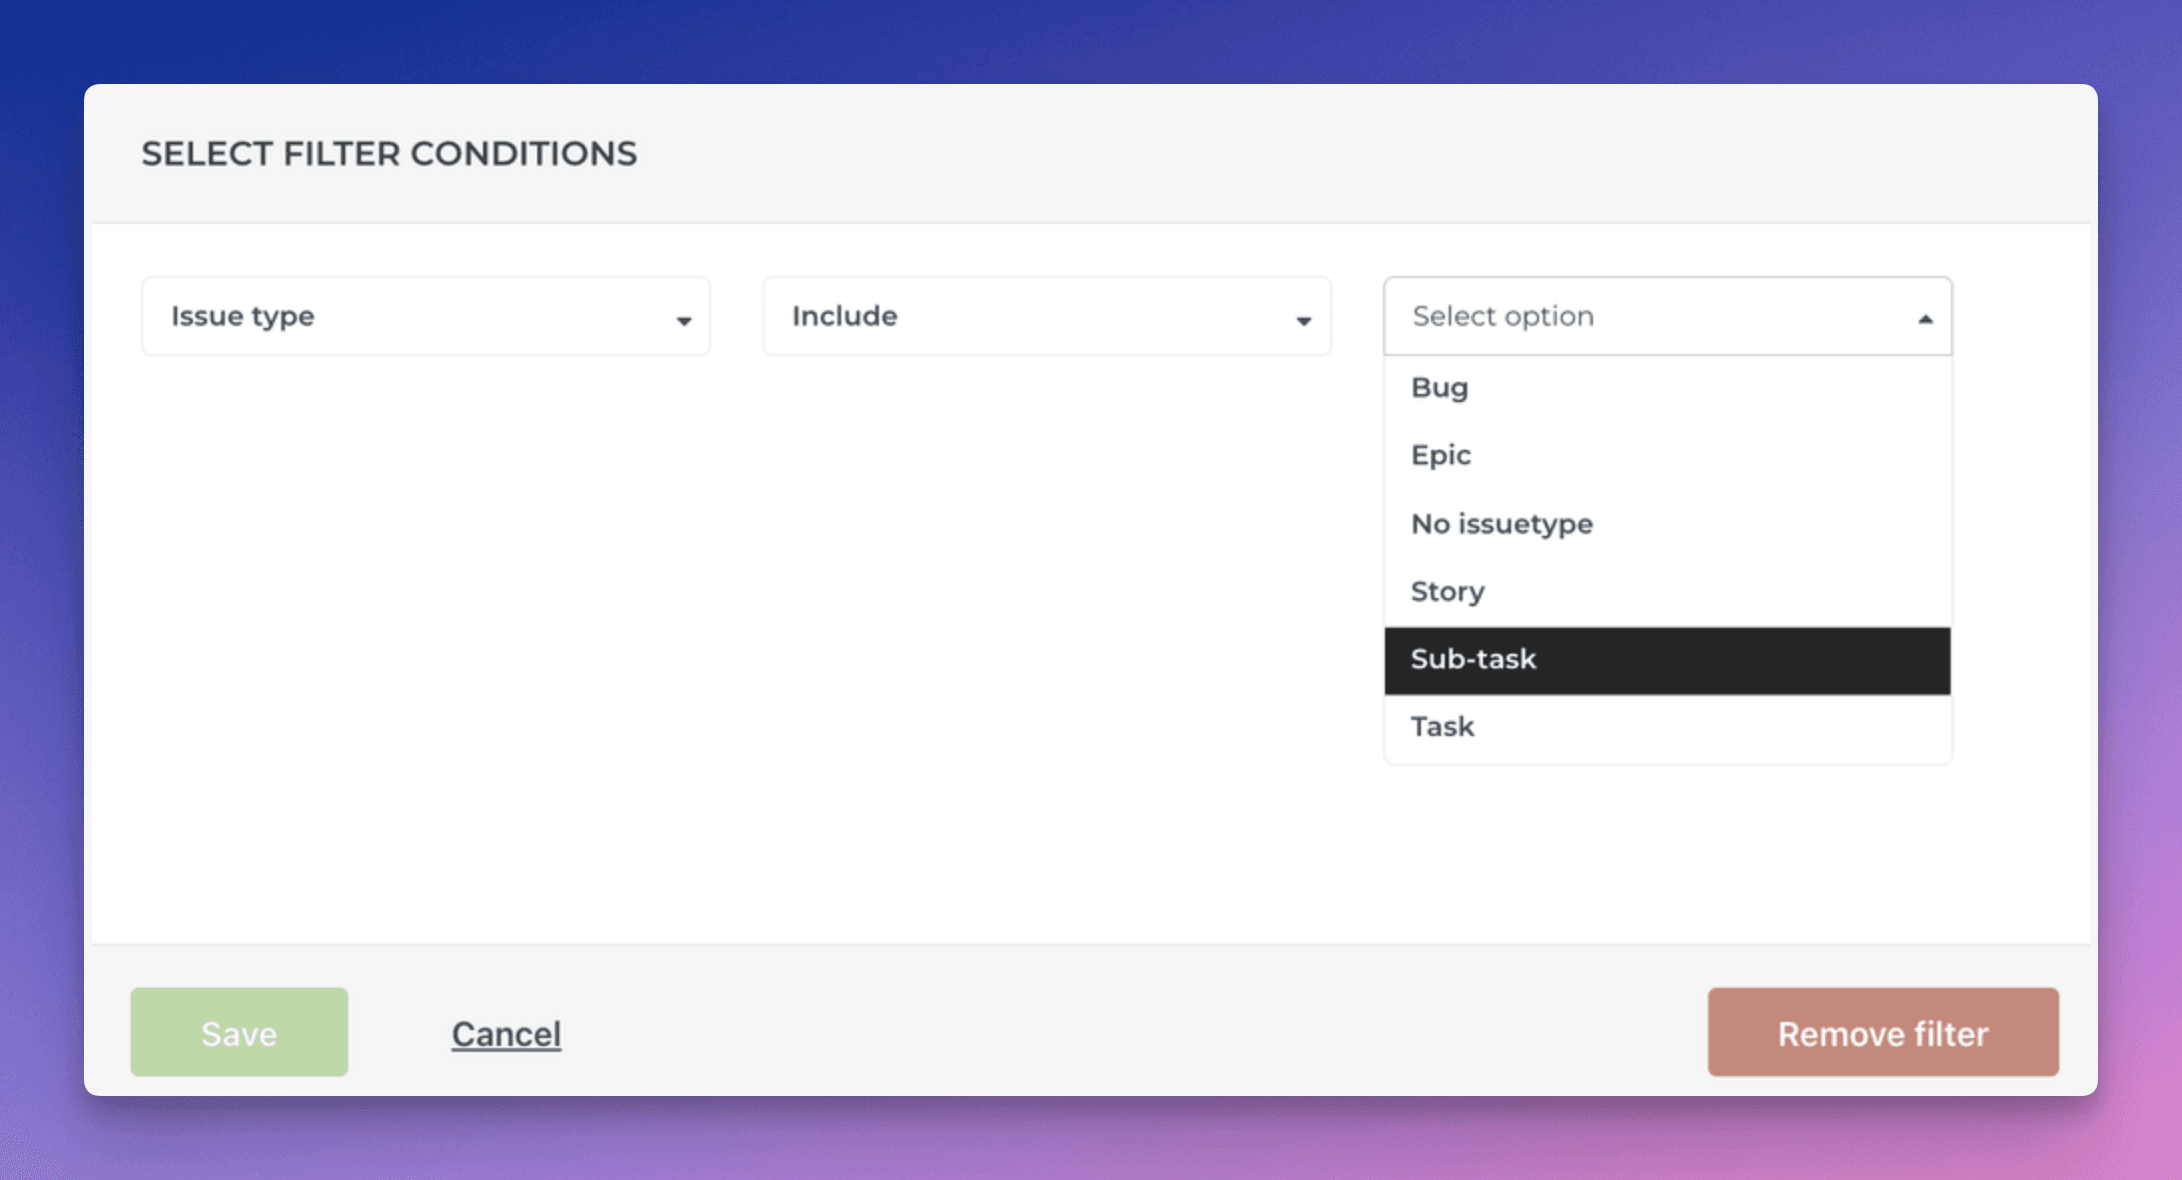
In the chart settings, you can include or exclude subtasks using the IssueType filter:
Clicking Set filter opens the filter modal:
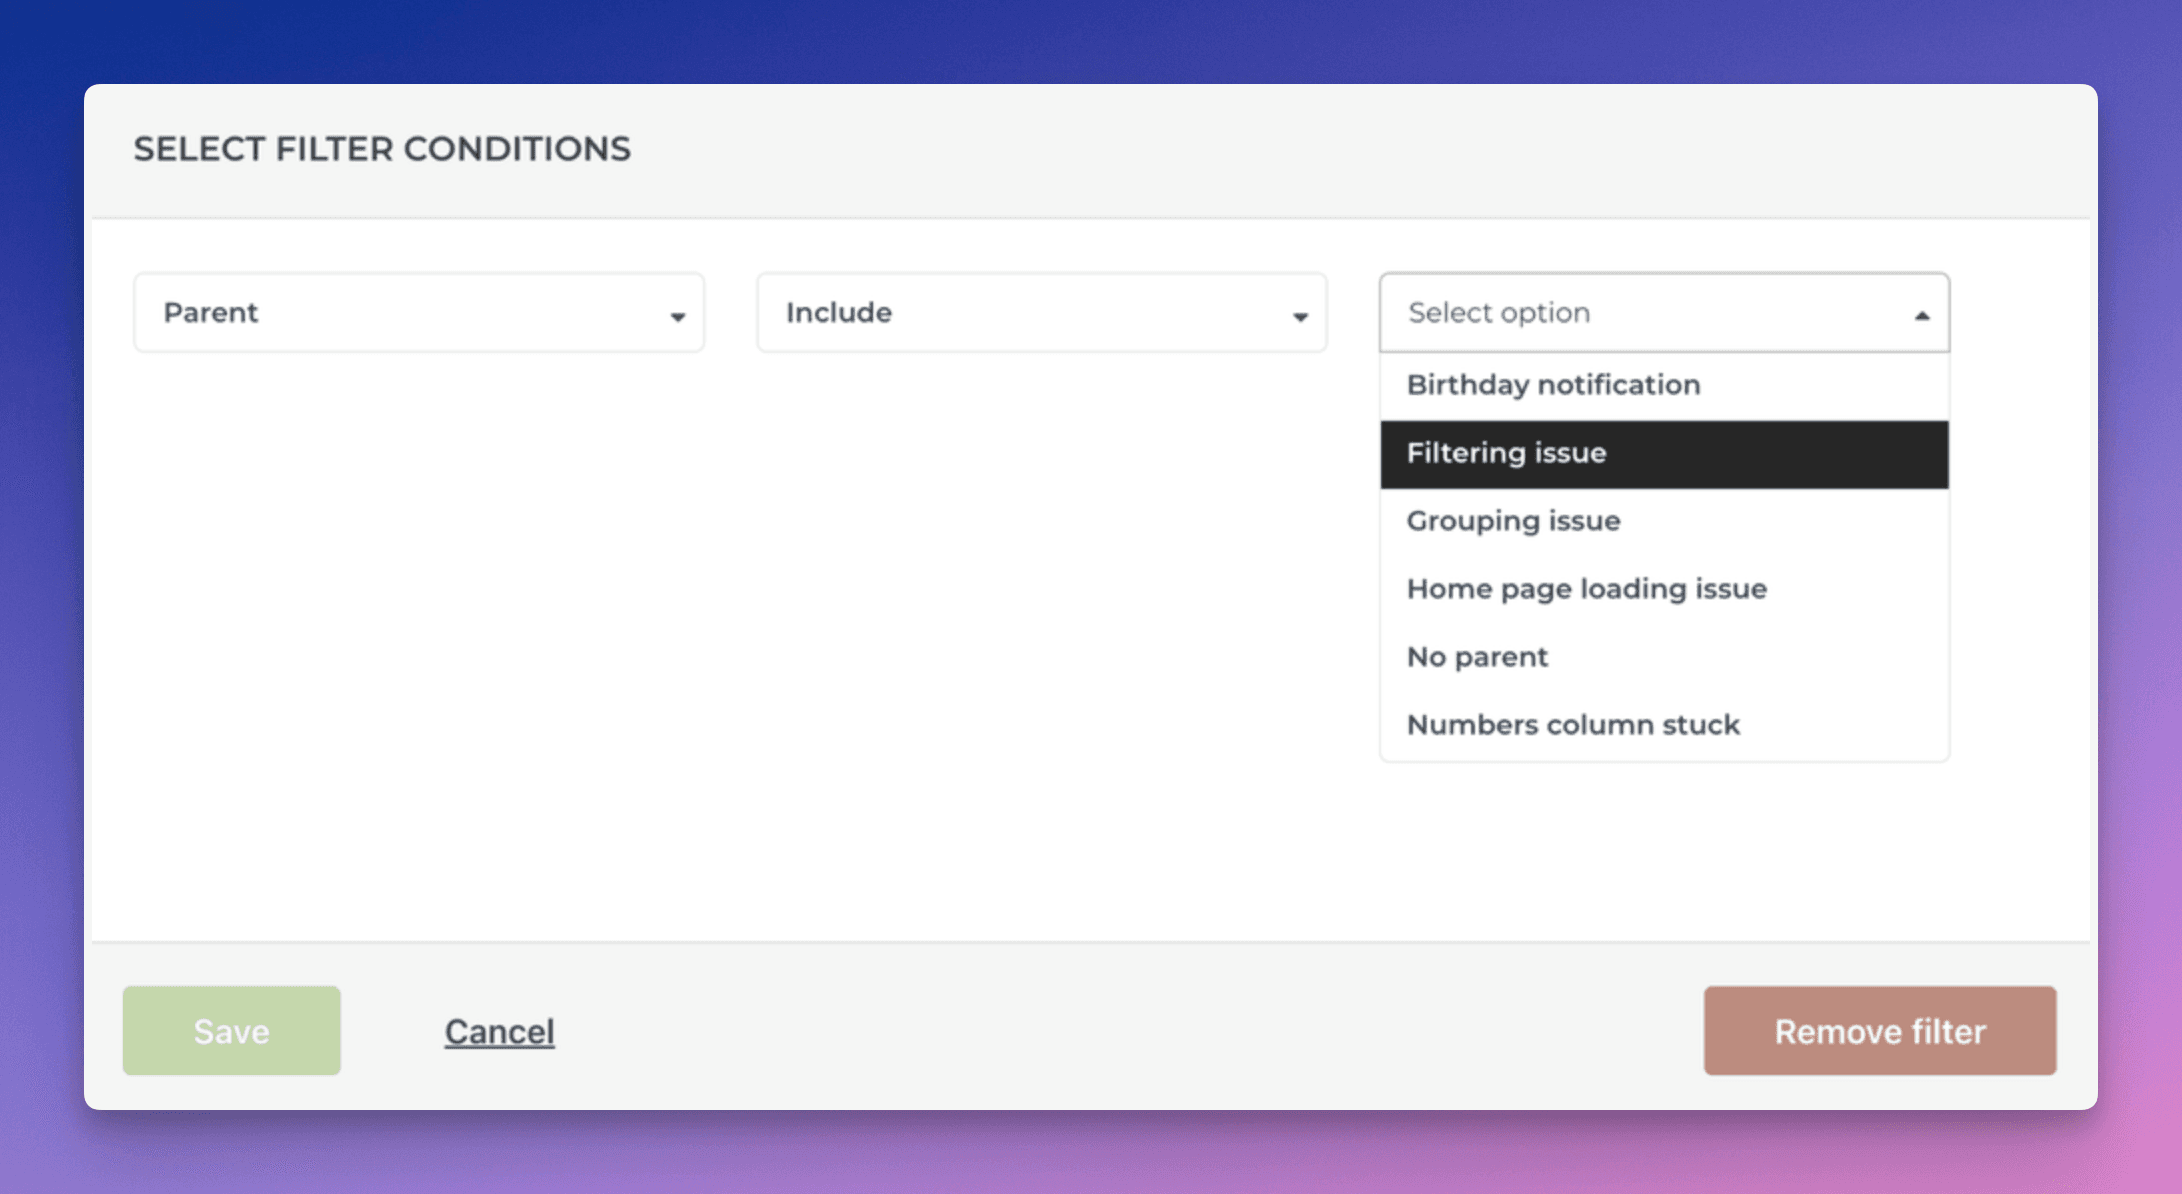
Similarly, you can also filter by subtasks’ parents (regular issues):
Creating charts from both Jira issues and subtasks
You can create charts based on tour top-level issues or subtasks. Here’s an example Task List that contains both issues and subtasks of a Jira project:
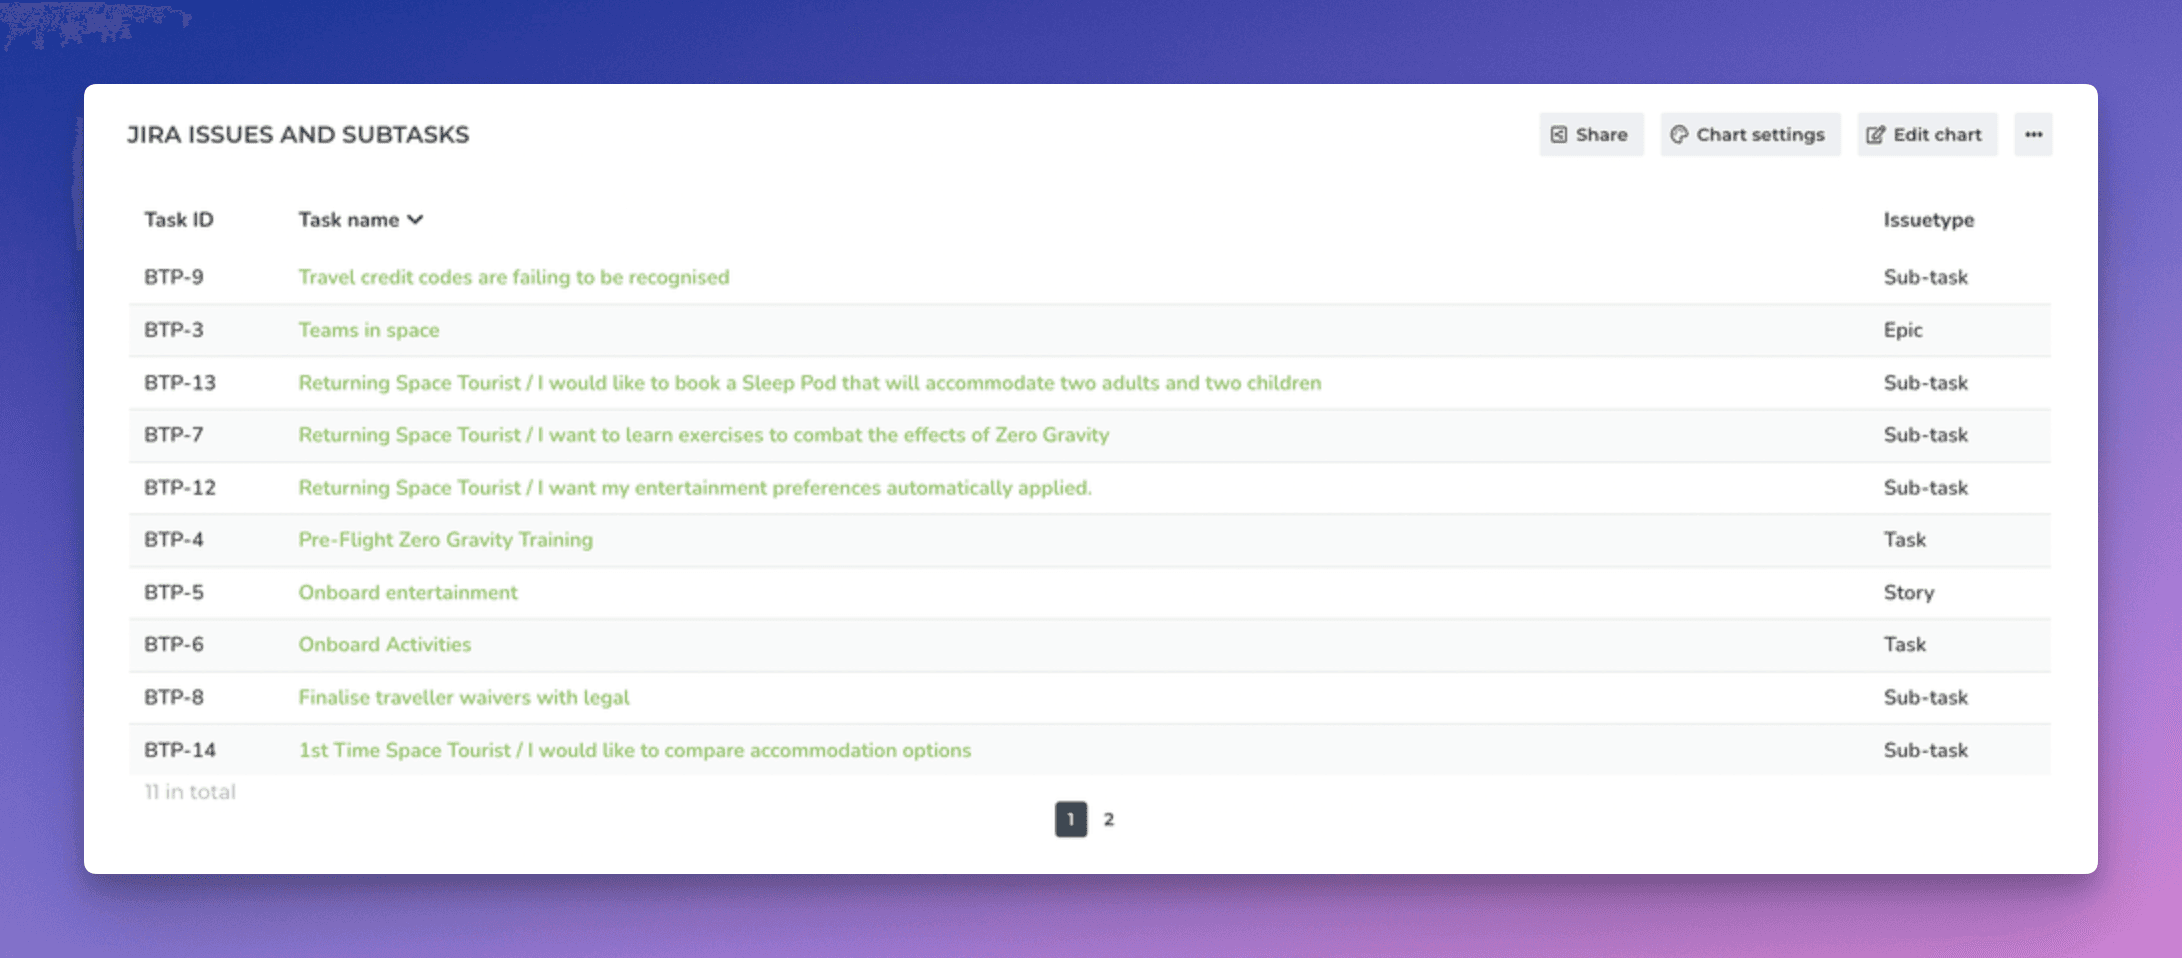
The rightmost column shows the issue type e.g. Story or Sub-task.
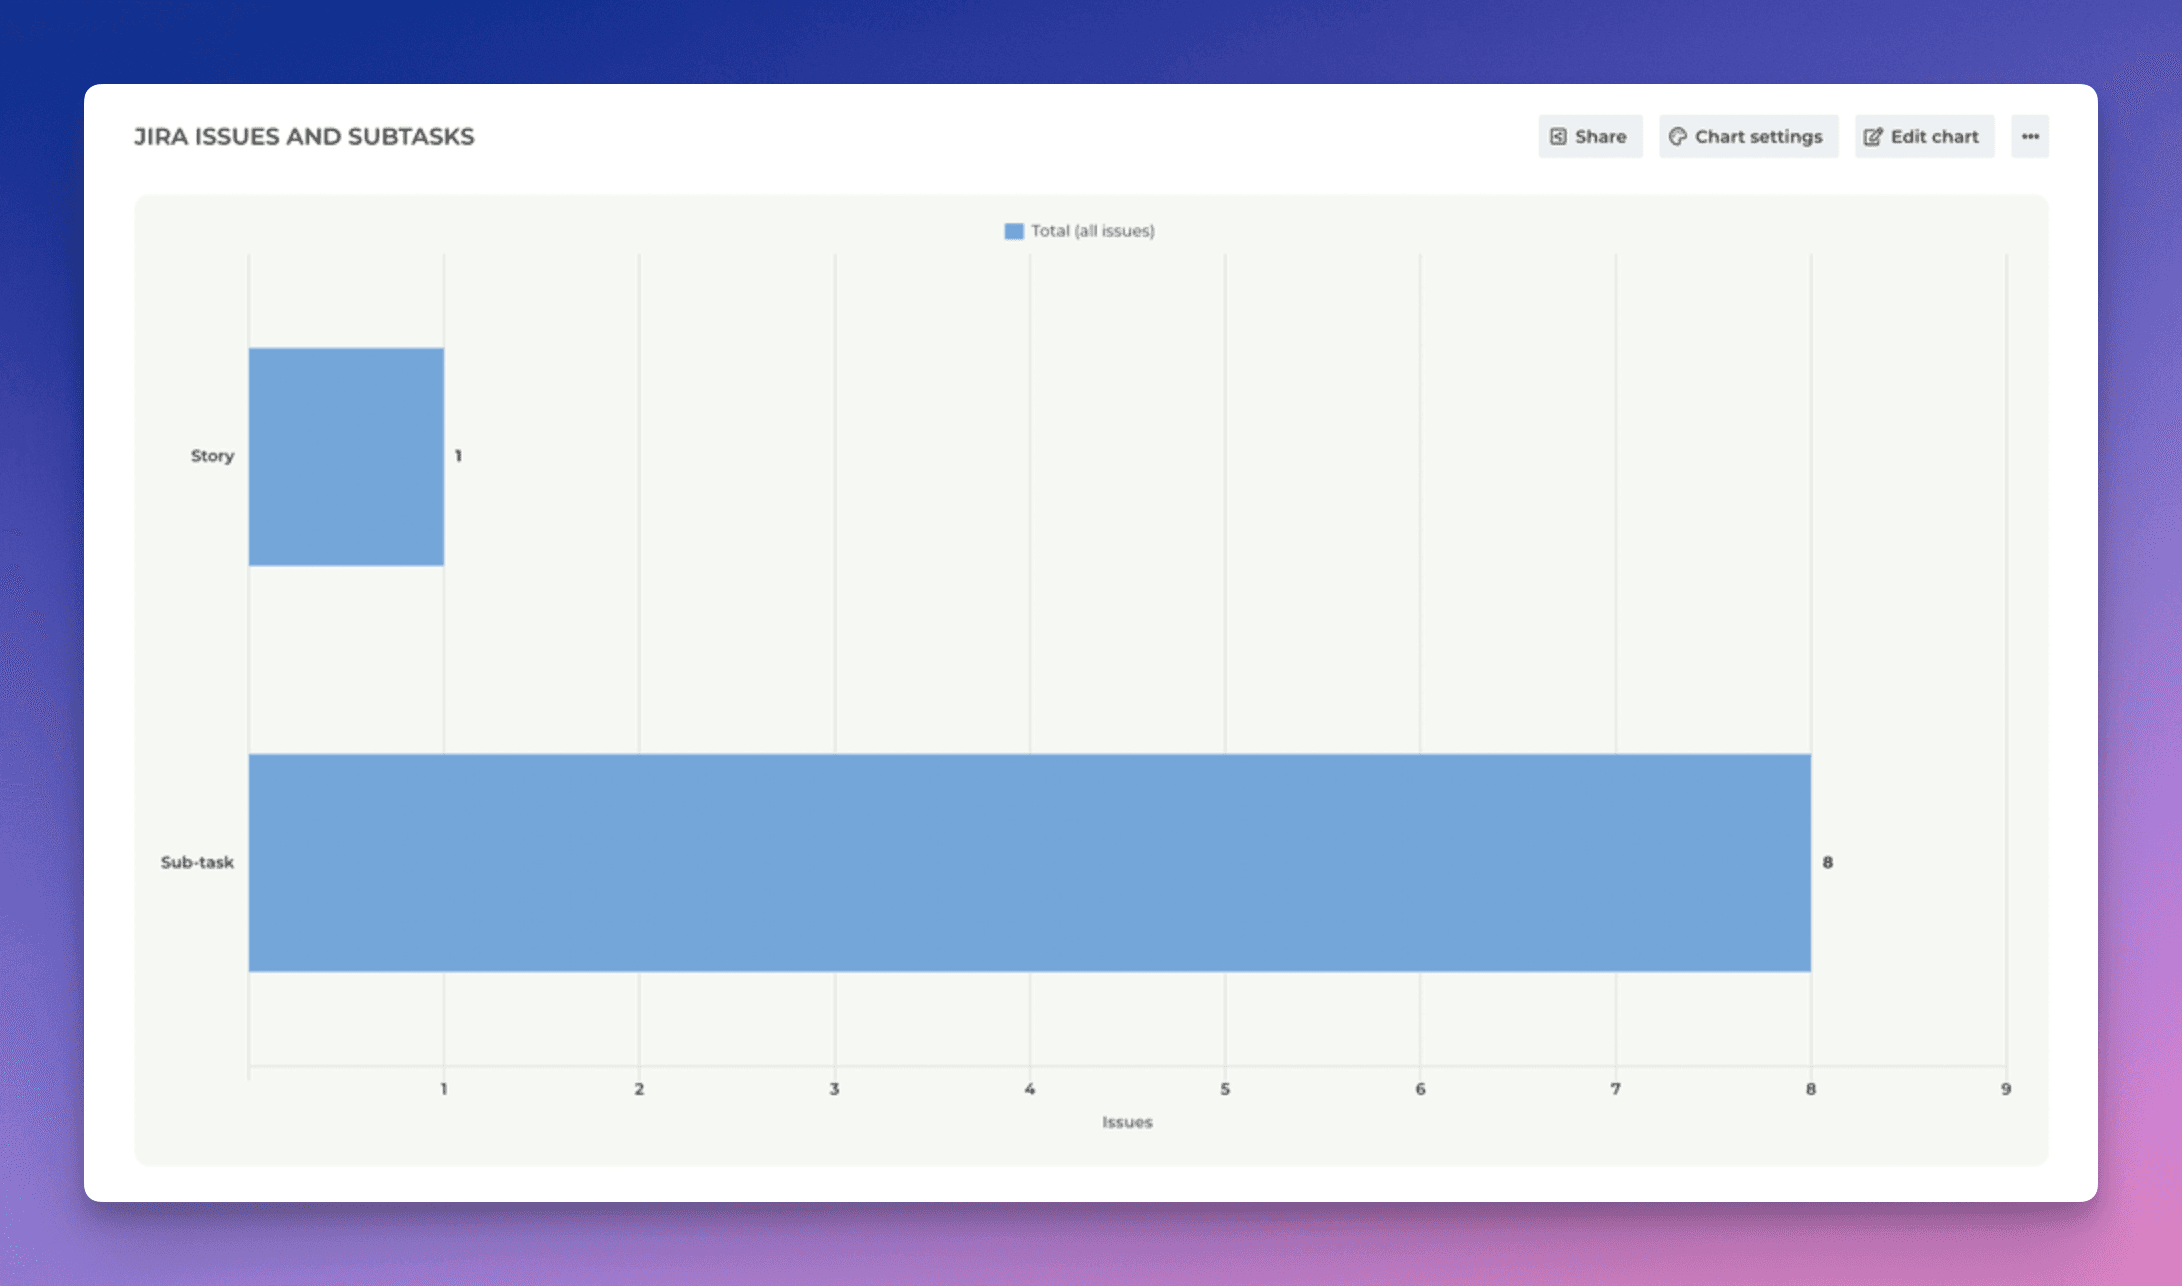
With the charts that support grouping, you can also group data by issue type. This can be helpful if you want to track the number of issues and subtasks in your projects:
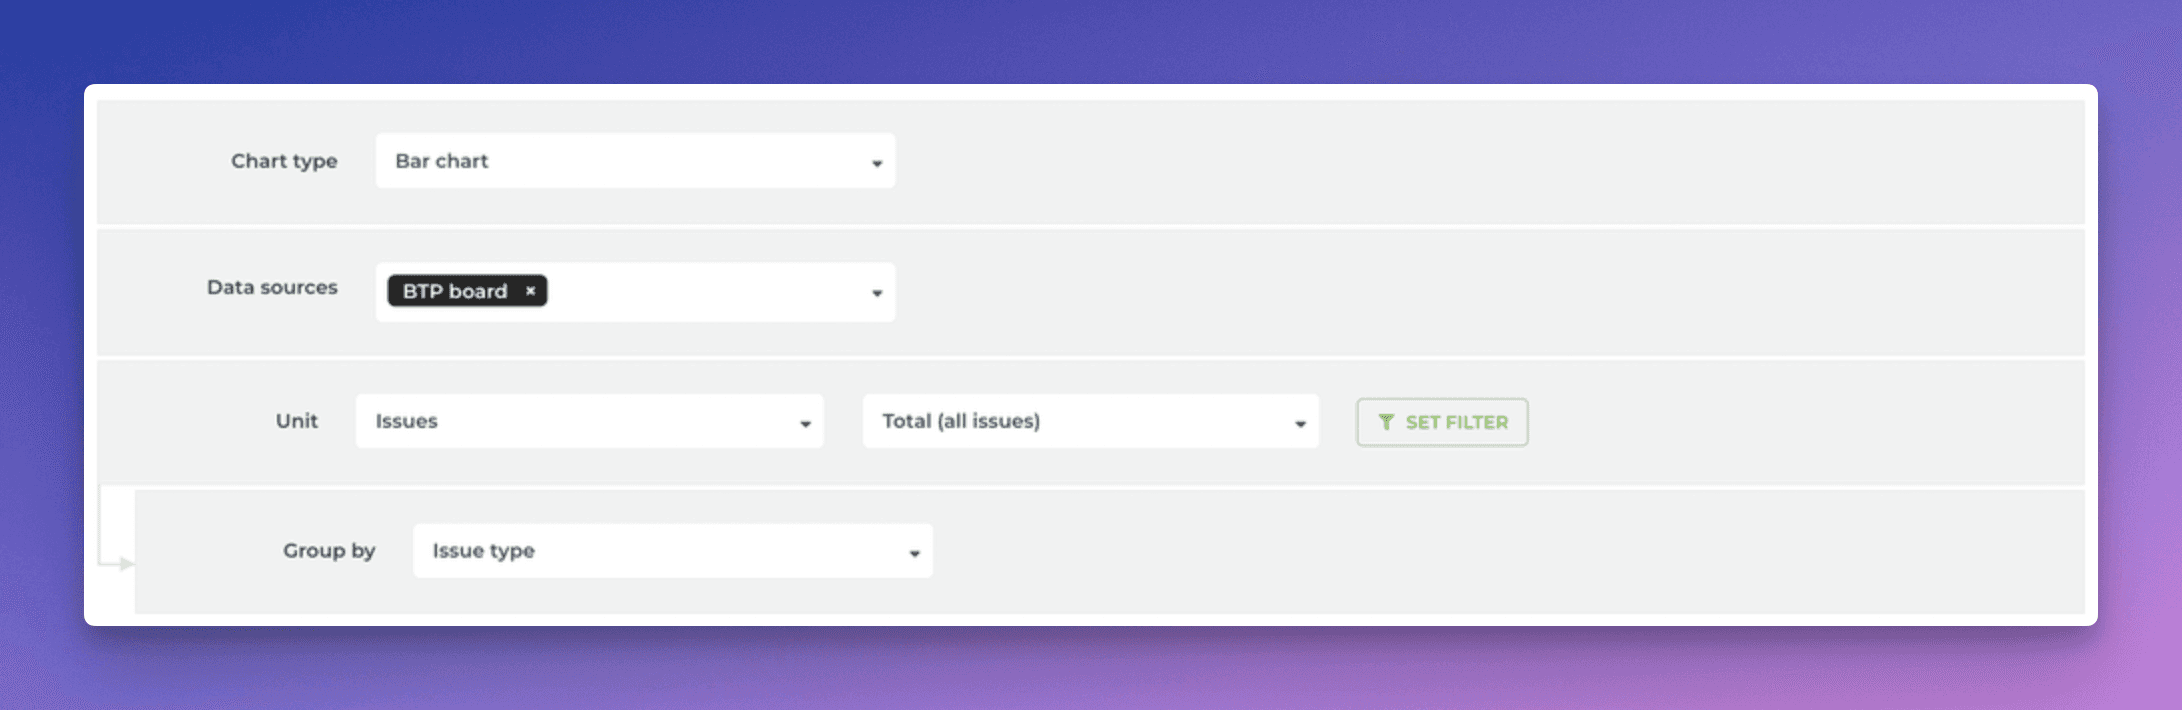
Here’s the resulting chart: