How to create a formula in the Table chart?
How to create a formula in the Table chart?
The Table chart aggregates the task data into sums, averages, and other statistics. Each column is configurable, and you can specify the contents of the column.
With the calculated column, you can add a column that is a function of one or more other columns you've previously added to the table.
The Table chart aggregates the task data into sums, averages, and other statistics. Each column is configurable, and you can specify the contents of the column.
With the calculated column, you can add a column that is a function of one or more other columns you've previously added to the table.
The Table chart aggregates the task data into sums, averages, and other statistics. Each column is configurable, and you can specify the contents of the column.
With the calculated column, you can add a column that is a function of one or more other columns you've previously added to the table.
Guide contents:
Guide contents:
Adding a calculated column
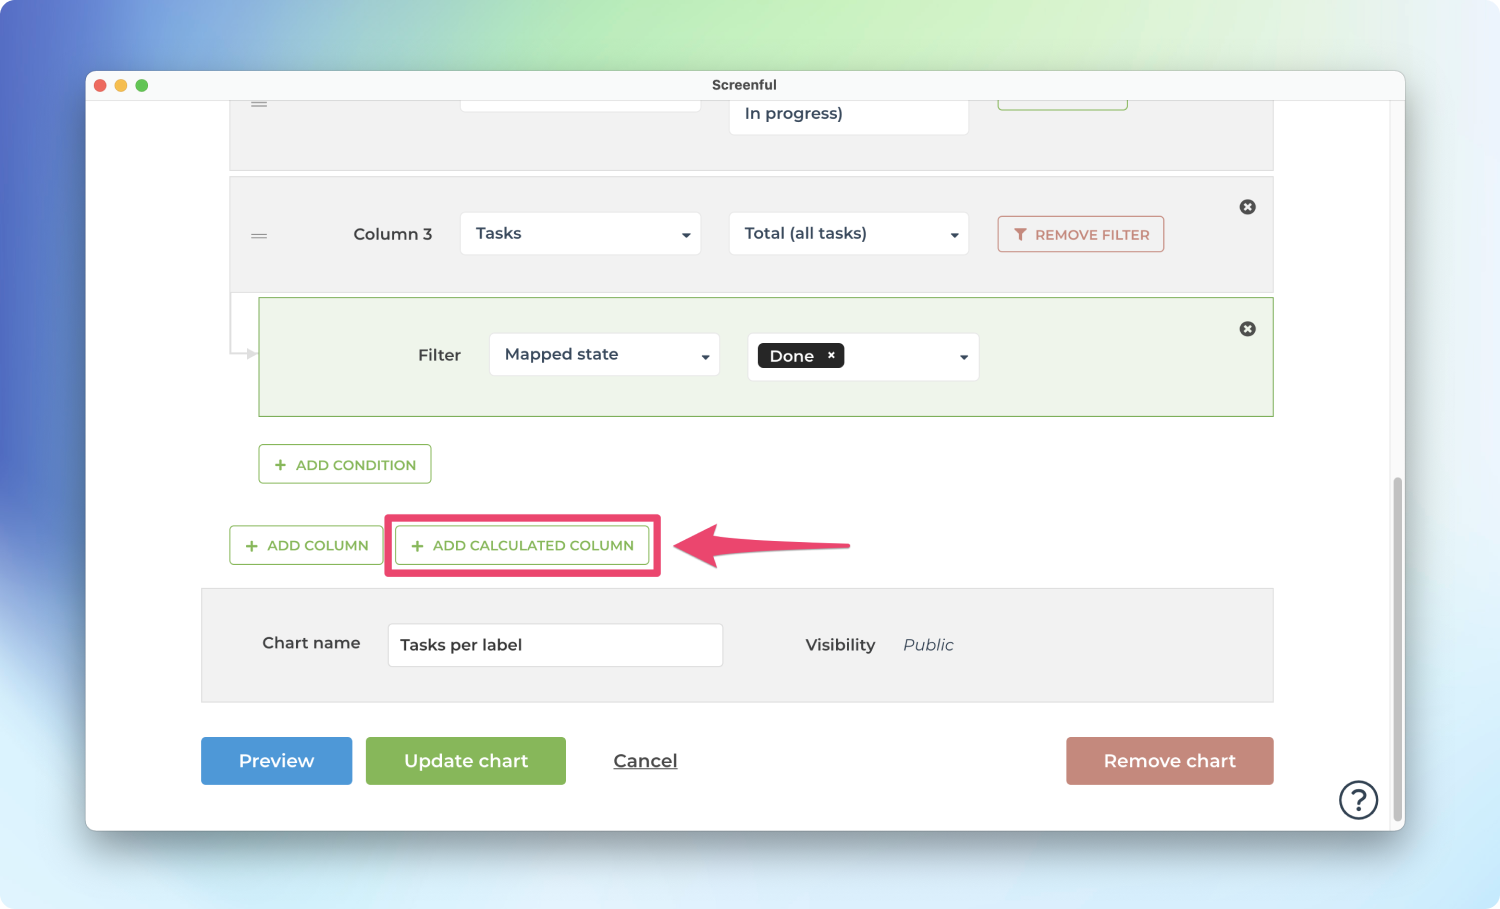
The calculated column is a special type of column that displays data that is computed based on the data in the other columns. To add a calculated column, click Edit chart and scroll down to the column definitions. Click Add calculated column.
A modal is opened which allows entering a formula.
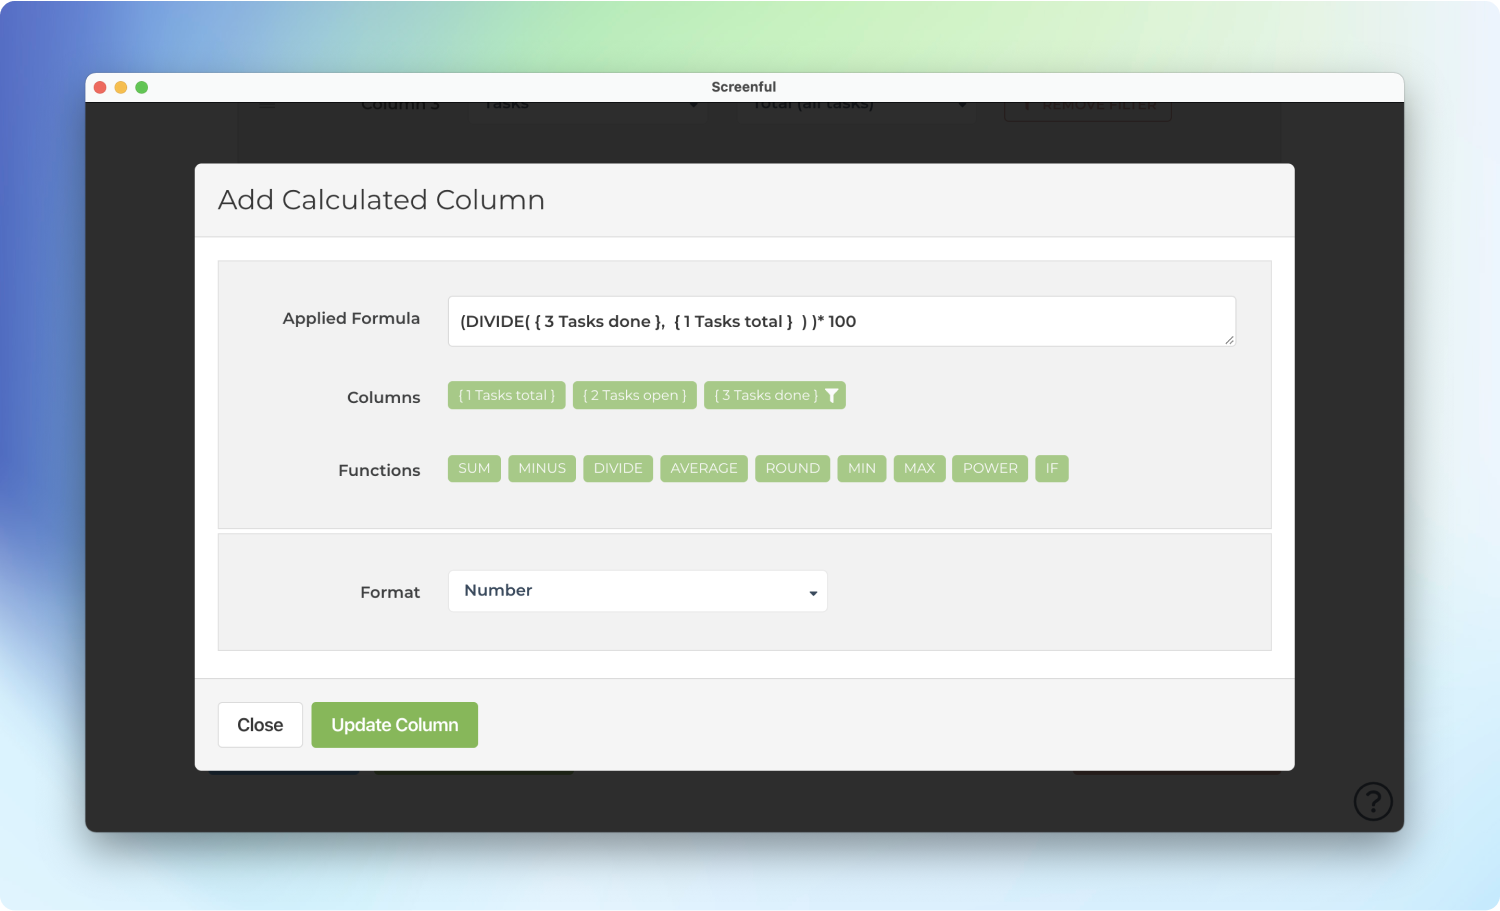
In this example, the formula entered is
(DIVIDE( { 3 Tasks done }, { 1 Tasks total } ) )* 100
It means the value in column 3 (Tasks done) is divided by the value in column 1 (Tasks total). The result should show the percentage of work completed.
While it may look complicated, you don’t have to type it; you can click the buttons below the formula field, which provide shortcuts to the most commonly needed formulas. If you’re a power user looking for a more complicated formula, here’s a reference to all the supported formulas.
Once you’ve added the formula and saved the chart, the calculated column is added to the chart:
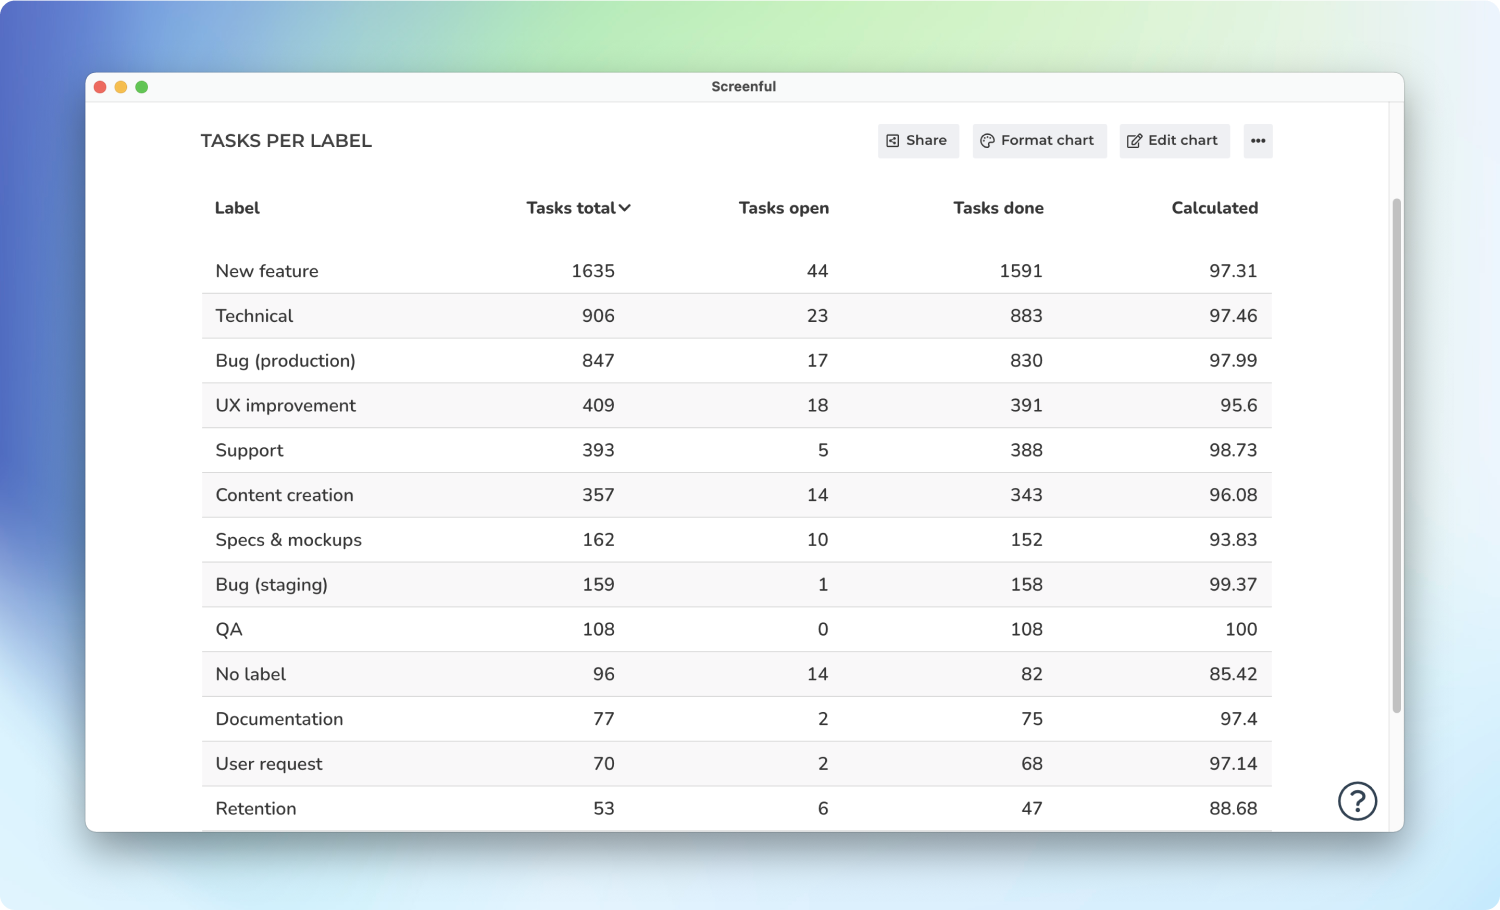
Now the rightmost column shows the completion percentage based on the values in the Tasks total and Tasks done columns.
When you write a calculated column formula, it is automatically applied to the whole table and evaluated individually for each row.
Adding a calculated column
The calculated column is a special type of column that displays data that is computed based on the data in the other columns. To add a calculated column, click Edit chart and scroll down to the column definitions. Click Add calculated column.
A modal is opened which allows entering a formula.
In this example, the formula entered is
(DIVIDE( { 3 Tasks done }, { 1 Tasks total } ) )* 100
It means the value in column 3 (Tasks done) is divided by the value in column 1 (Tasks total). The result should show the percentage of work completed.
While it may look complicated, you don’t have to type it; you can click the buttons below the formula field, which provide shortcuts to the most commonly needed formulas. If you’re a power user looking for a more complicated formula, here’s a reference to all the supported formulas.
Once you’ve added the formula and saved the chart, the calculated column is added to the chart:
Now the rightmost column shows the completion percentage based on the values in the Tasks total and Tasks done columns.
When you write a calculated column formula, it is automatically applied to the whole table and evaluated individually for each row.
Formatting the calculated column
There are a couple of things you can do to spice up your calculated column. A more visual way of displaying percentages is by using progress bars. To change the representation, select Progress Bar (0-100) from the Format menu.
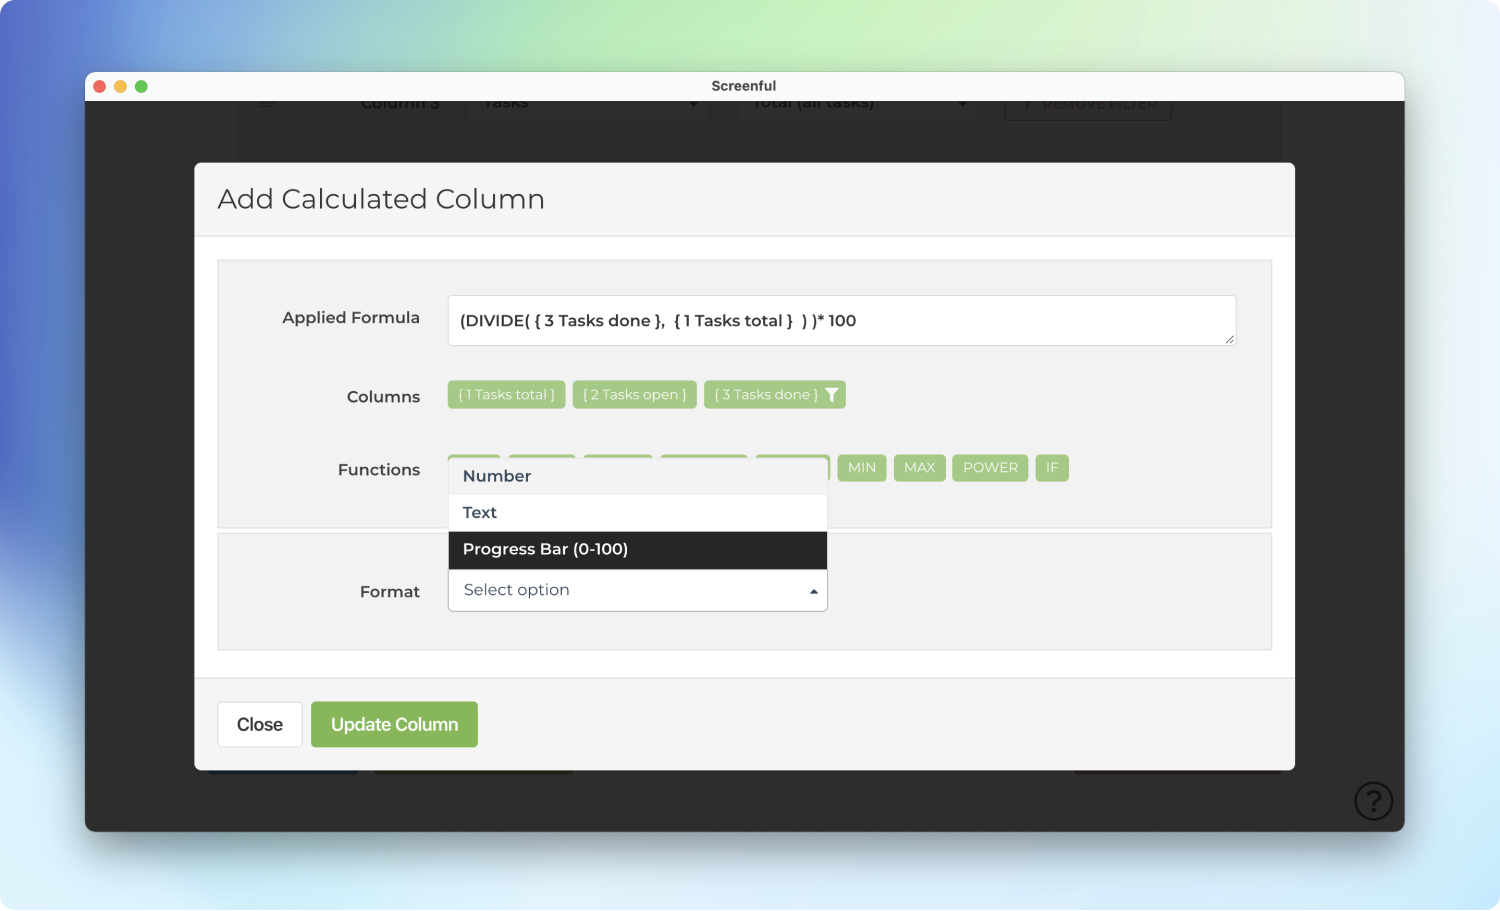
You can also change the column header from the default “Calculated” to a more descriptive one in the Chart format section.
Finally, you can reorder the columns by drag and drop. In the below example, we’ve renamed the column header to Progress, and placed it as the first column in the chart. Here’s the final chart:
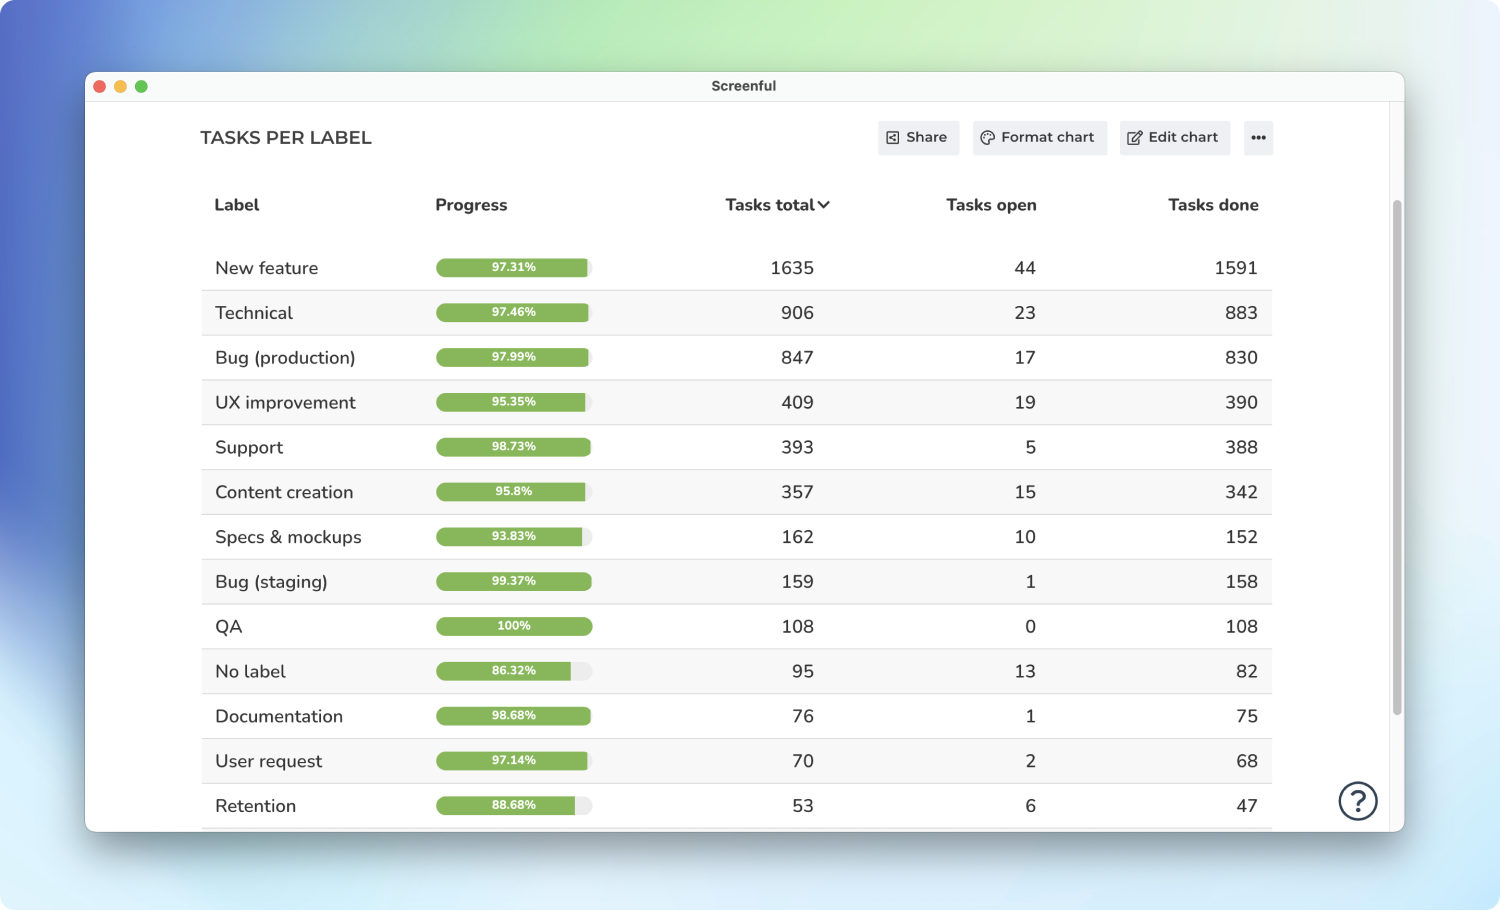
Formatting the calculated column
There are a couple of things you can do to spice up your calculated column. A more visual way of displaying percentages is by using progress bars. To change the representation, select Progress Bar (0-100) from the Format menu.
You can also change the column header from the default “Calculated” to a more descriptive one in the Chart format section.
Finally, you can reorder the columns by drag and drop. In the below example, we’ve renamed the column header to Progress, and placed it as the first column in the chart. Here’s the final chart: