How to roll up values from subtasks?
How to roll up values from subtasks?
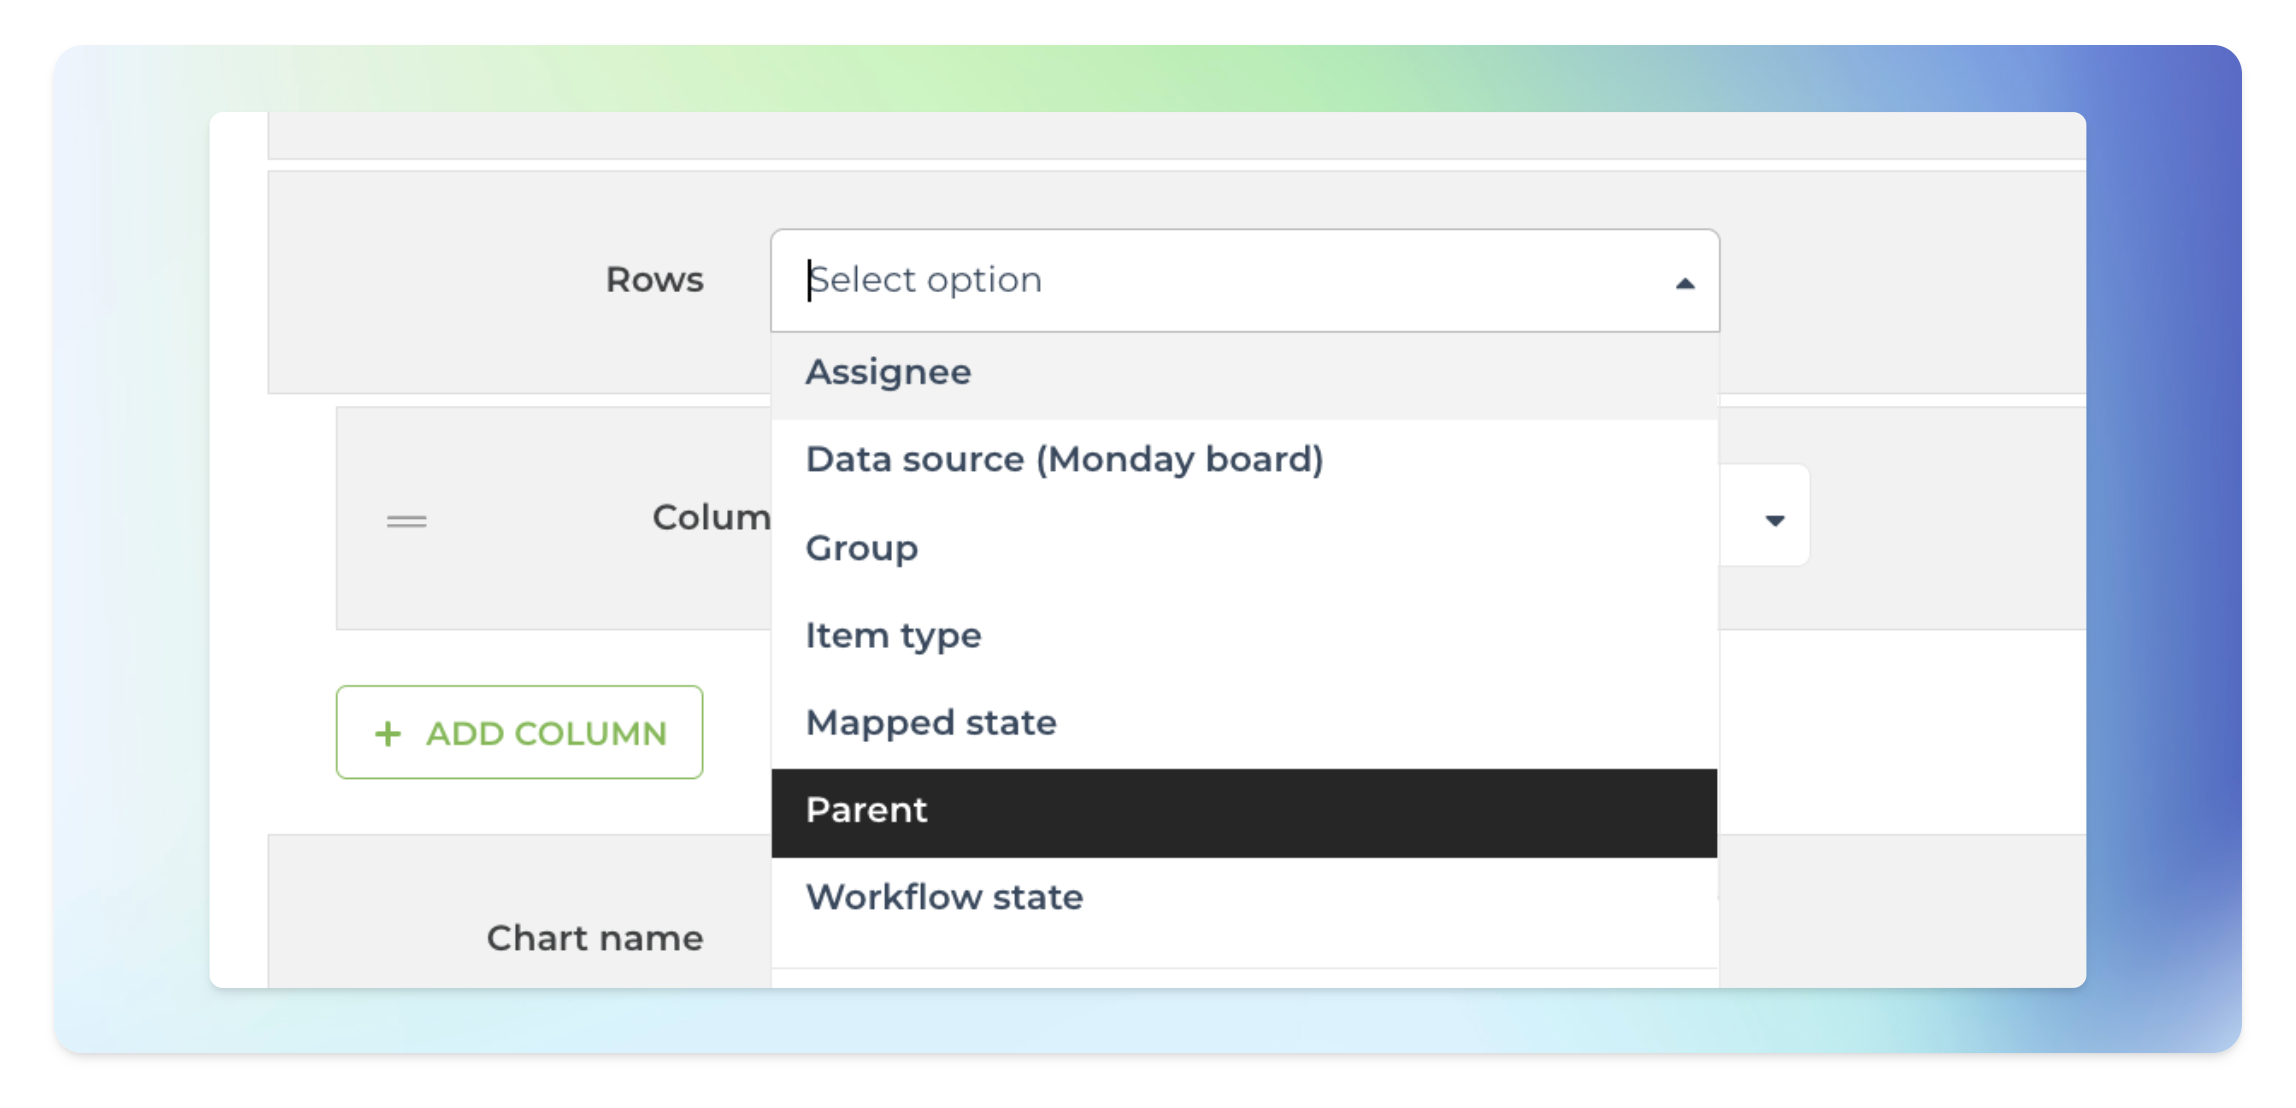
With Screenful, you can track not only top-level items but also subtasks. In addition to filtering by item type, you can use the parent-child relationship to aggregate data from subtasks to the parent task. This guide shows how to do it with the Table chart by selecting "Parent" as the row.
Start by selecting Parent as the row in the Table chart:
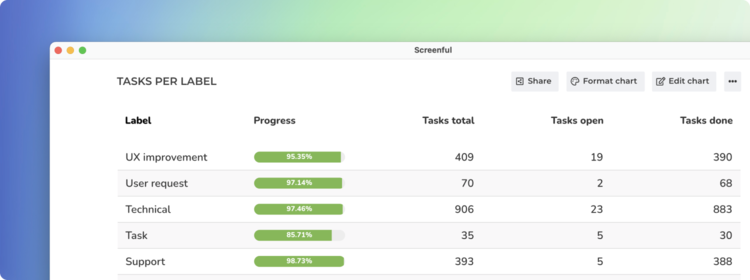
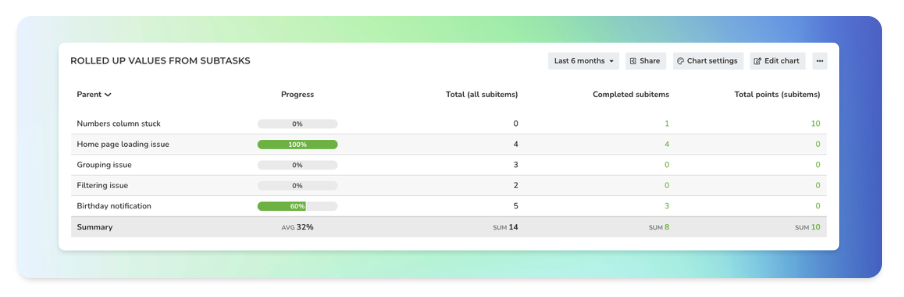
Each row in the table corresponds to the top-level item, and the metrics shown in columns are the summaries from the subitems. For example, a column can show the total number of subitems for a parent, the total number of completed subitems, or the total number of story points assigned etc.
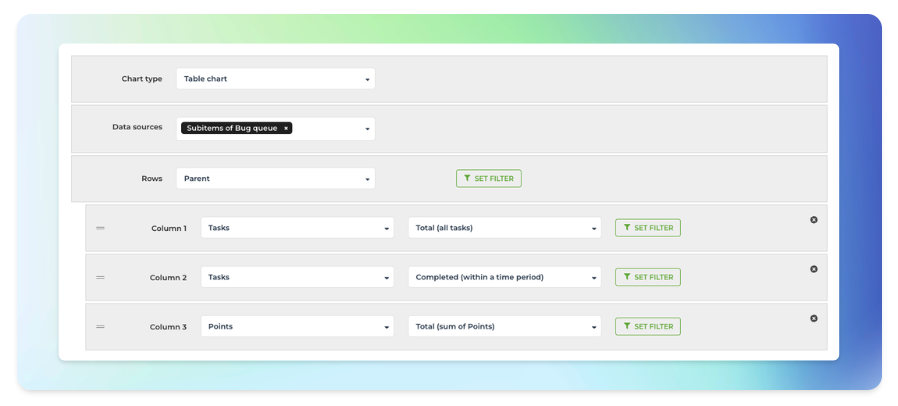
The columns are configurable, so you can roll up any of the available metrics from subitems. The progress bar can be used to show the completion percentage of the subitems. It can be added to the chart by applying a formula:
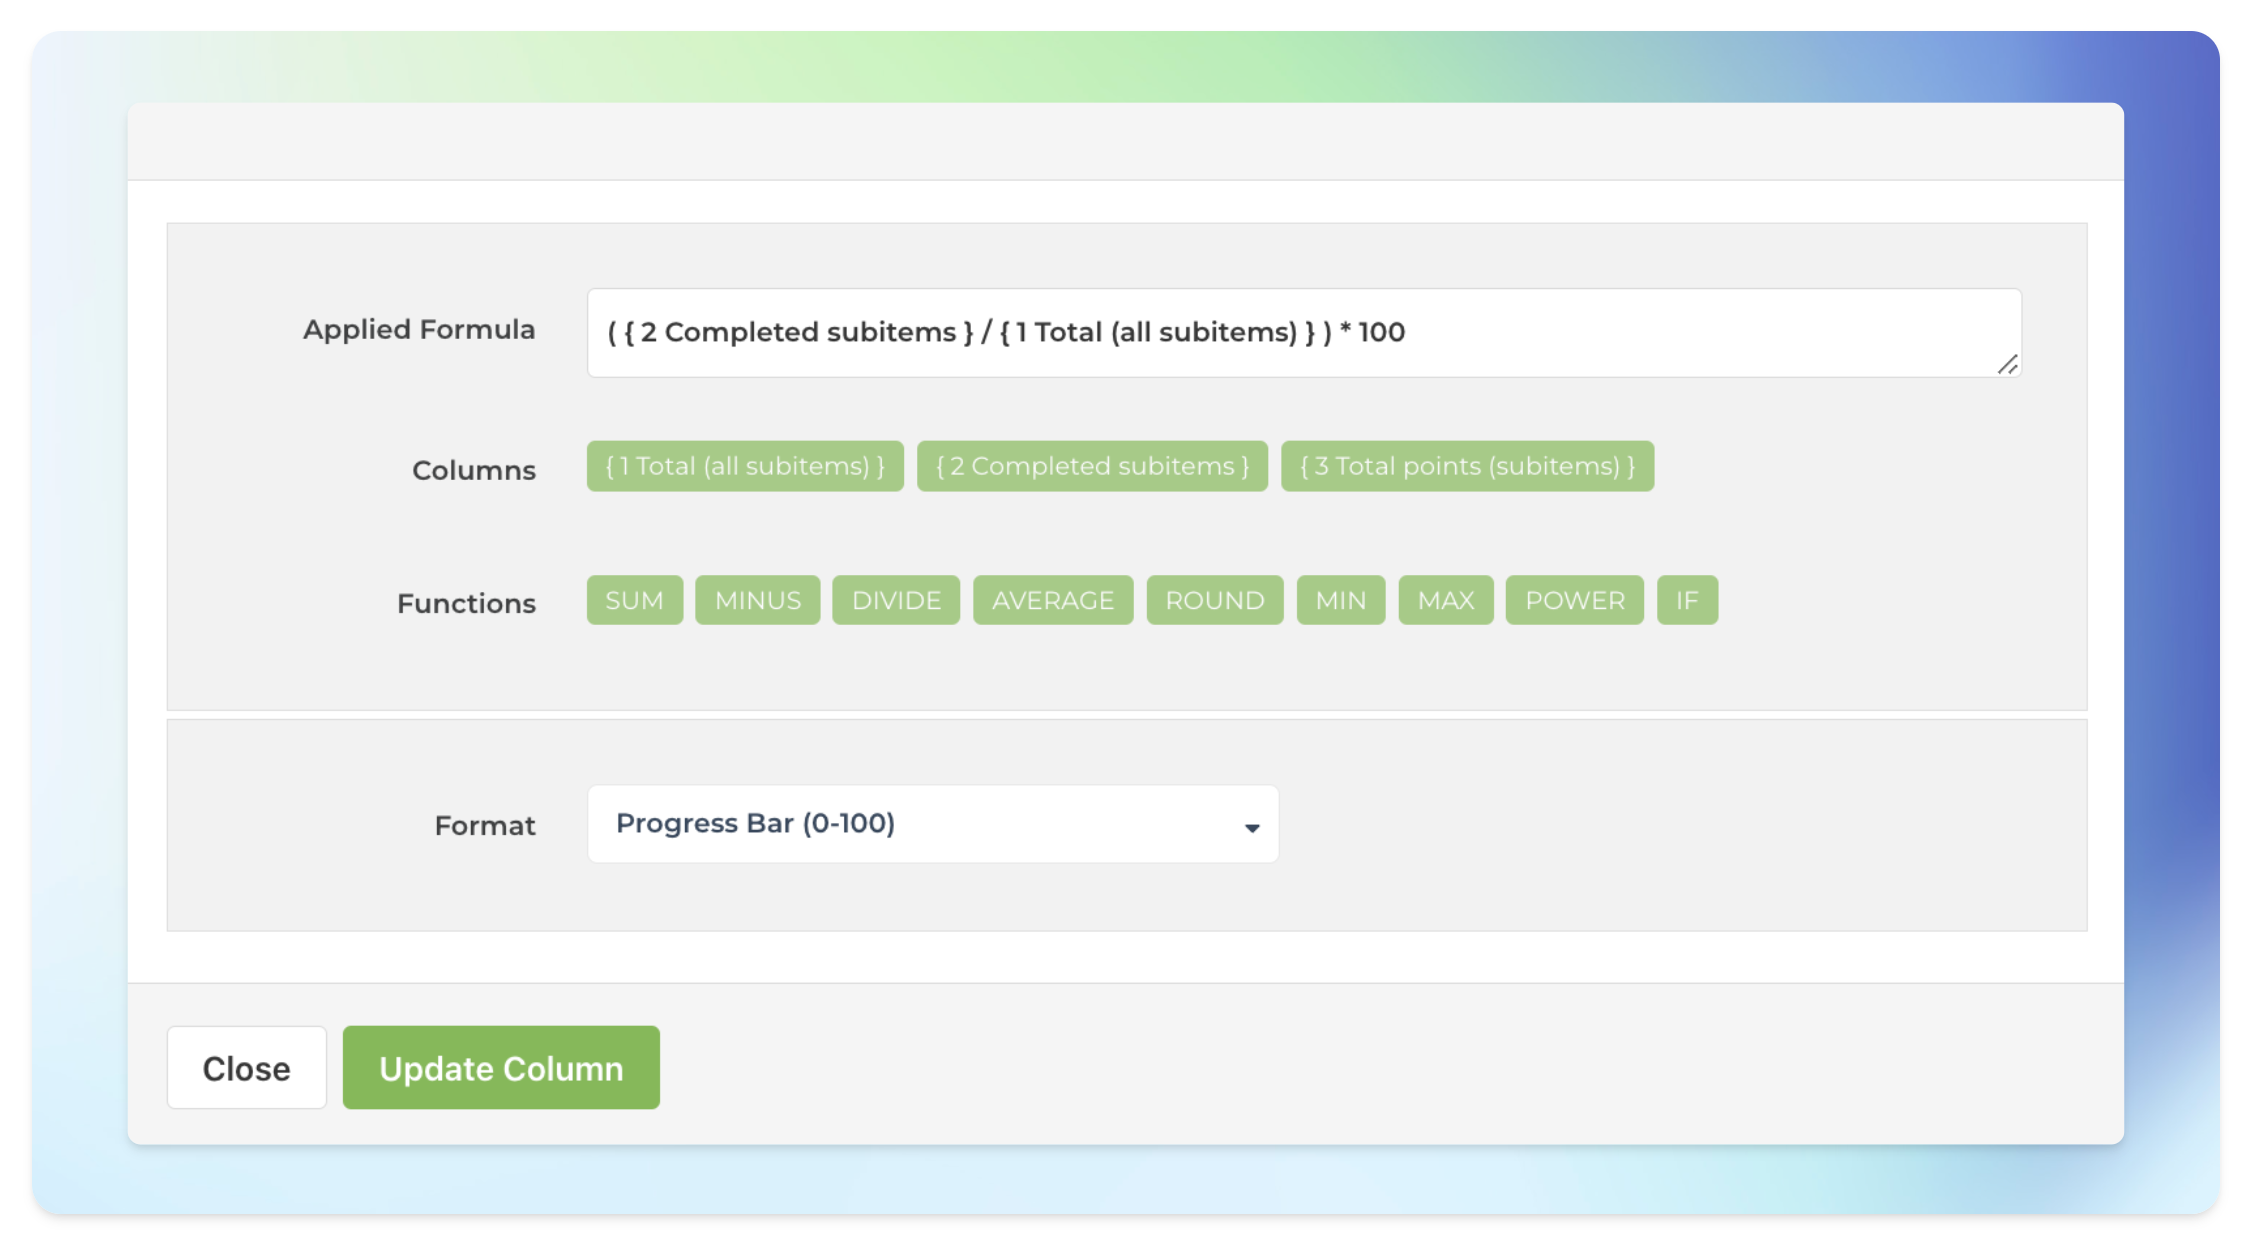
The formula calculates the completion percentage based on the number of Total tasks and the number of Tasks completed. Here’s the final chart:
Tracking subitems with Screenful provides you with the low-level item detail that you are looking for when breaking down your work for a more granular view. Instead of observing each subitem individually, you can roll up their values to view the aggregated numbers across all of the subitems of an individual task.
Learn more about tracking subitems from these tool-specific guides:
With Screenful, you can track not only top-level items but also subtasks. In addition to filtering by item type, you can use the parent-child relationship to aggregate data from subtasks to the parent task. This guide shows how to do it with the Table chart by selecting "Parent" as the row.
Start by selecting Parent as the row in the Table chart:
Each row in the table corresponds to the top-level item, and the metrics shown in columns are the summaries from the subitems. For example, a column can show the total number of subitems for a parent, the total number of completed subitems, or the total number of story points assigned etc.
The columns are configurable, so you can roll up any of the available metrics from subitems. The progress bar can be used to show the completion percentage of the subitems. It can be added to the chart by applying a formula:
The formula calculates the completion percentage based on the number of Total tasks and the number of Tasks completed. Here’s the final chart:
Tracking subitems with Screenful provides you with the low-level item detail that you are looking for when breaking down your work for a more granular view. Instead of observing each subitem individually, you can roll up their values to view the aggregated numbers across all of the subitems of an individual task.
Learn more about tracking subitems from these tool-specific guides: