🚢 Shipped: Introducing Analytics & Reports for ClickUp

Analytics & Reports

Guides

Tour

Pricing

Log in

Start for free

🚢 Shipped: Introducing Analytics & Reports for ClickUp

Metrics

Get valuable insights in seconds with ready-made metrics for every team

Red & Blue Gradient

Cycle time

Measure the duration from starting to completing a task

Light Blue & Purple Gradient

Lead time

Measure the duration from creating to completing a task

Lime & Red Gradient

Reaction time

Measure how quickly tasks are first responded to

Blue & Red Gradients

Work in progress

Monitors number of tasks being worked on

Yellow & Blue tonalities gradient

Work due

Monitor tasks nearing or past due date

Scale of reds gradient

Backlog size

Monitors number of uncompleted tasks

Lime & Rose Gradient

Logged time

Track time recorded per task

Red & Blue Gradient

Velocity

Track an amount of work done in time period

Orange & Blue Gradient

Throughput

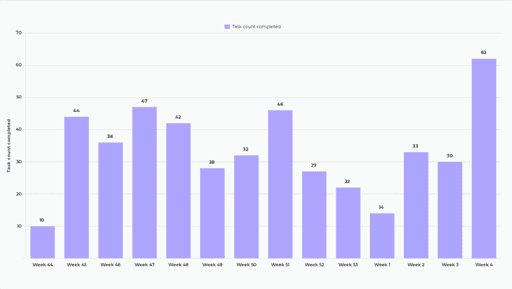
Track number of items completed per time period

Blue, Pink and Rose Gradient

Pull request review time

Measure time taken to review code changes

Blue, Yellow and Orange Gradient

Merge request review time

Measure time taken to review code changes

Blue, Pink and Red Gradient

Item age

Measure time items have been open

Red, Pink and Blue Gradient

Mean time to resolution

Measure average time to close requests

Blue & Purple Gradient

Escaped defects

Track defects released to customers

A smooth, translucent background with a gradient of soft green and blue hues.

Set up Screenful in 2 minutes

Connect your task management tool to get actionable insights.

Start Free Trial

Product

Analytics & Reports for GitHub

Analytics & Reports for Linear

Analytics & Reports for Trello

Analytics & Reports for Jira

Analytics & Reports for monday.com

Analytics & Reports for Asana

Support

Getting started

Knowledge base

Product updates

FAQ

Videos

Contact

Company

Blog

Careers

Partners

Terms of Service

Data privacy and security

Data Processing Addendum

Subscribe to our newsletter

Join 90,000+ subscribers. Receive product updates and relevant articles on productivity analytics.