May 4, 2026

Our AI assistant is now smarter and more capable. Powered by a stronger model with improved context handling, it can create charts, answer questions about your data, and guide you on how to get the most out of Screenful.
We've also made it easier to reach. A new toggle in the top bar lets you open and close the assistant from anywhere in the app, and your conversation is always there when you come back.
New side dock
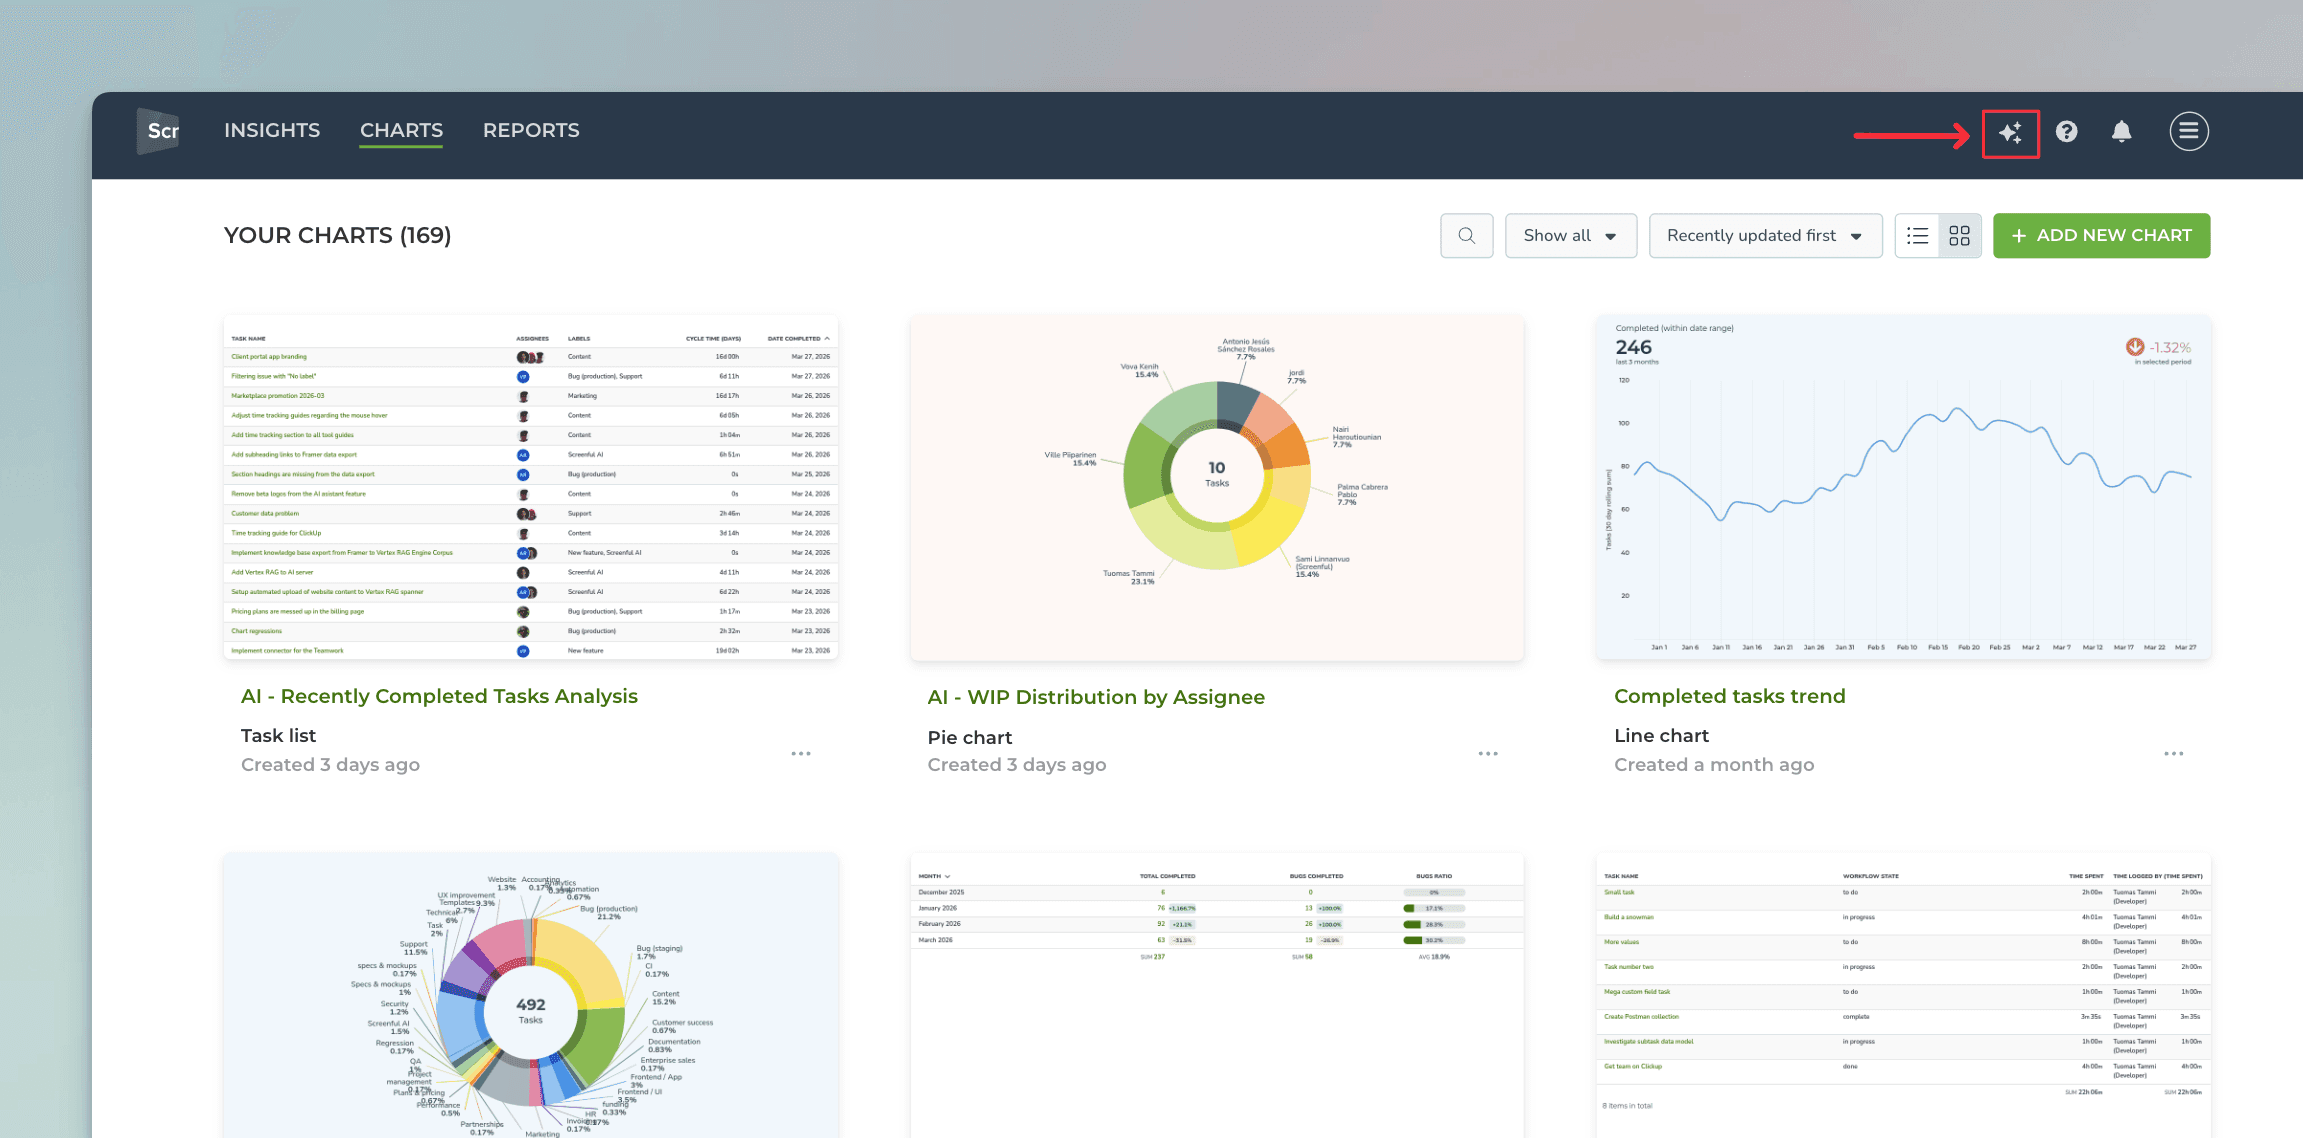
You can now toggle on/off the AI assistant by clicking the icon on the top bar:
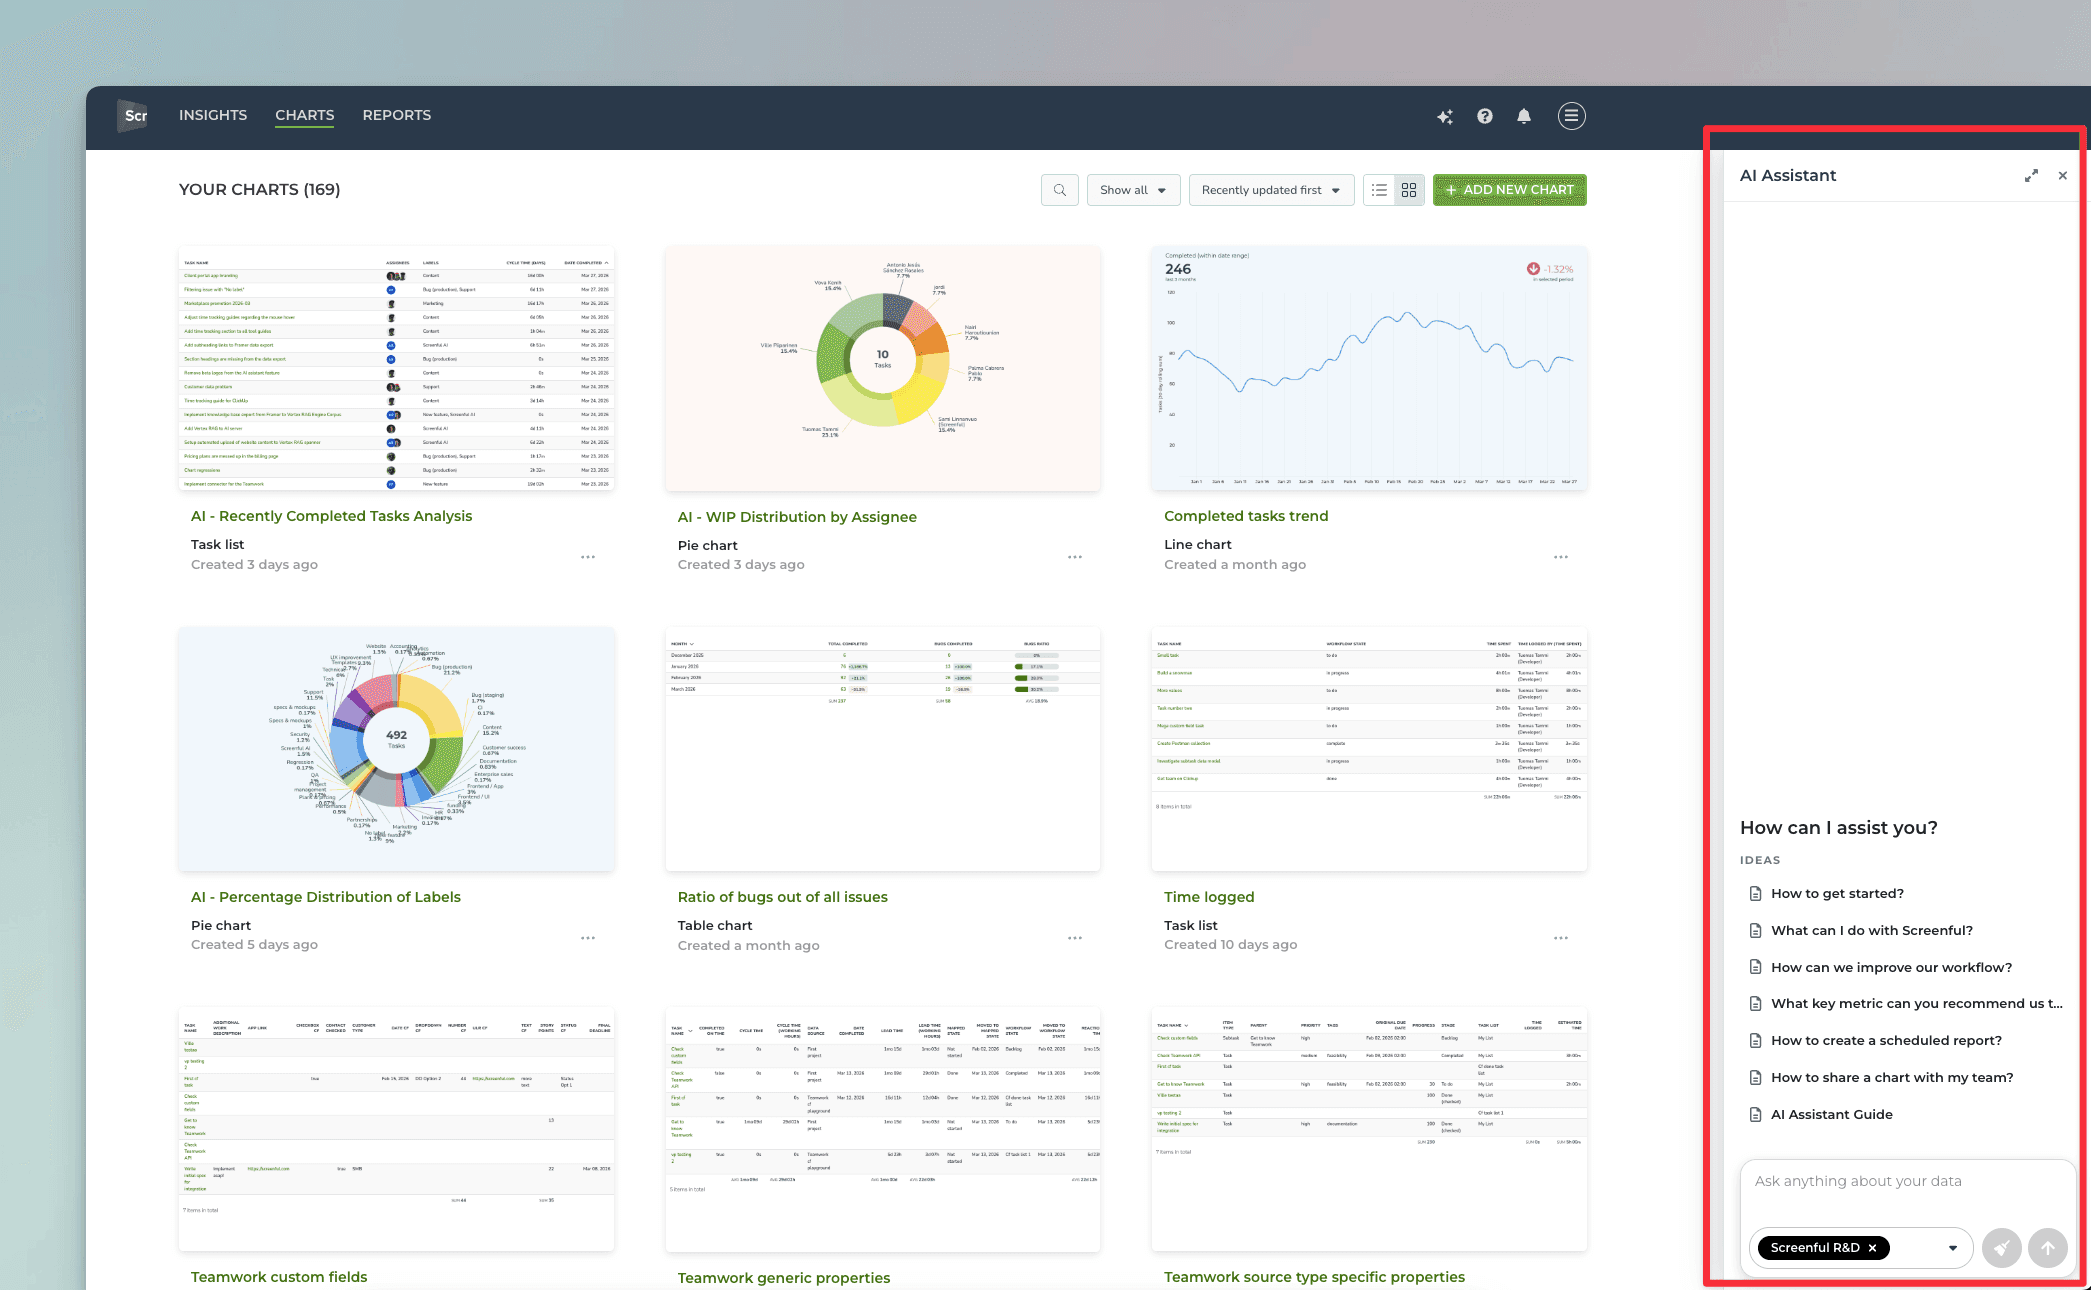
Clicking the icon opens the AI asistant in the the right side of the UI:
You can open the AI assistant at any time by clicking the icon on the top bar. You can also close the AI assistant from the same icon. When you reopen, you can continue the chat where you left it.
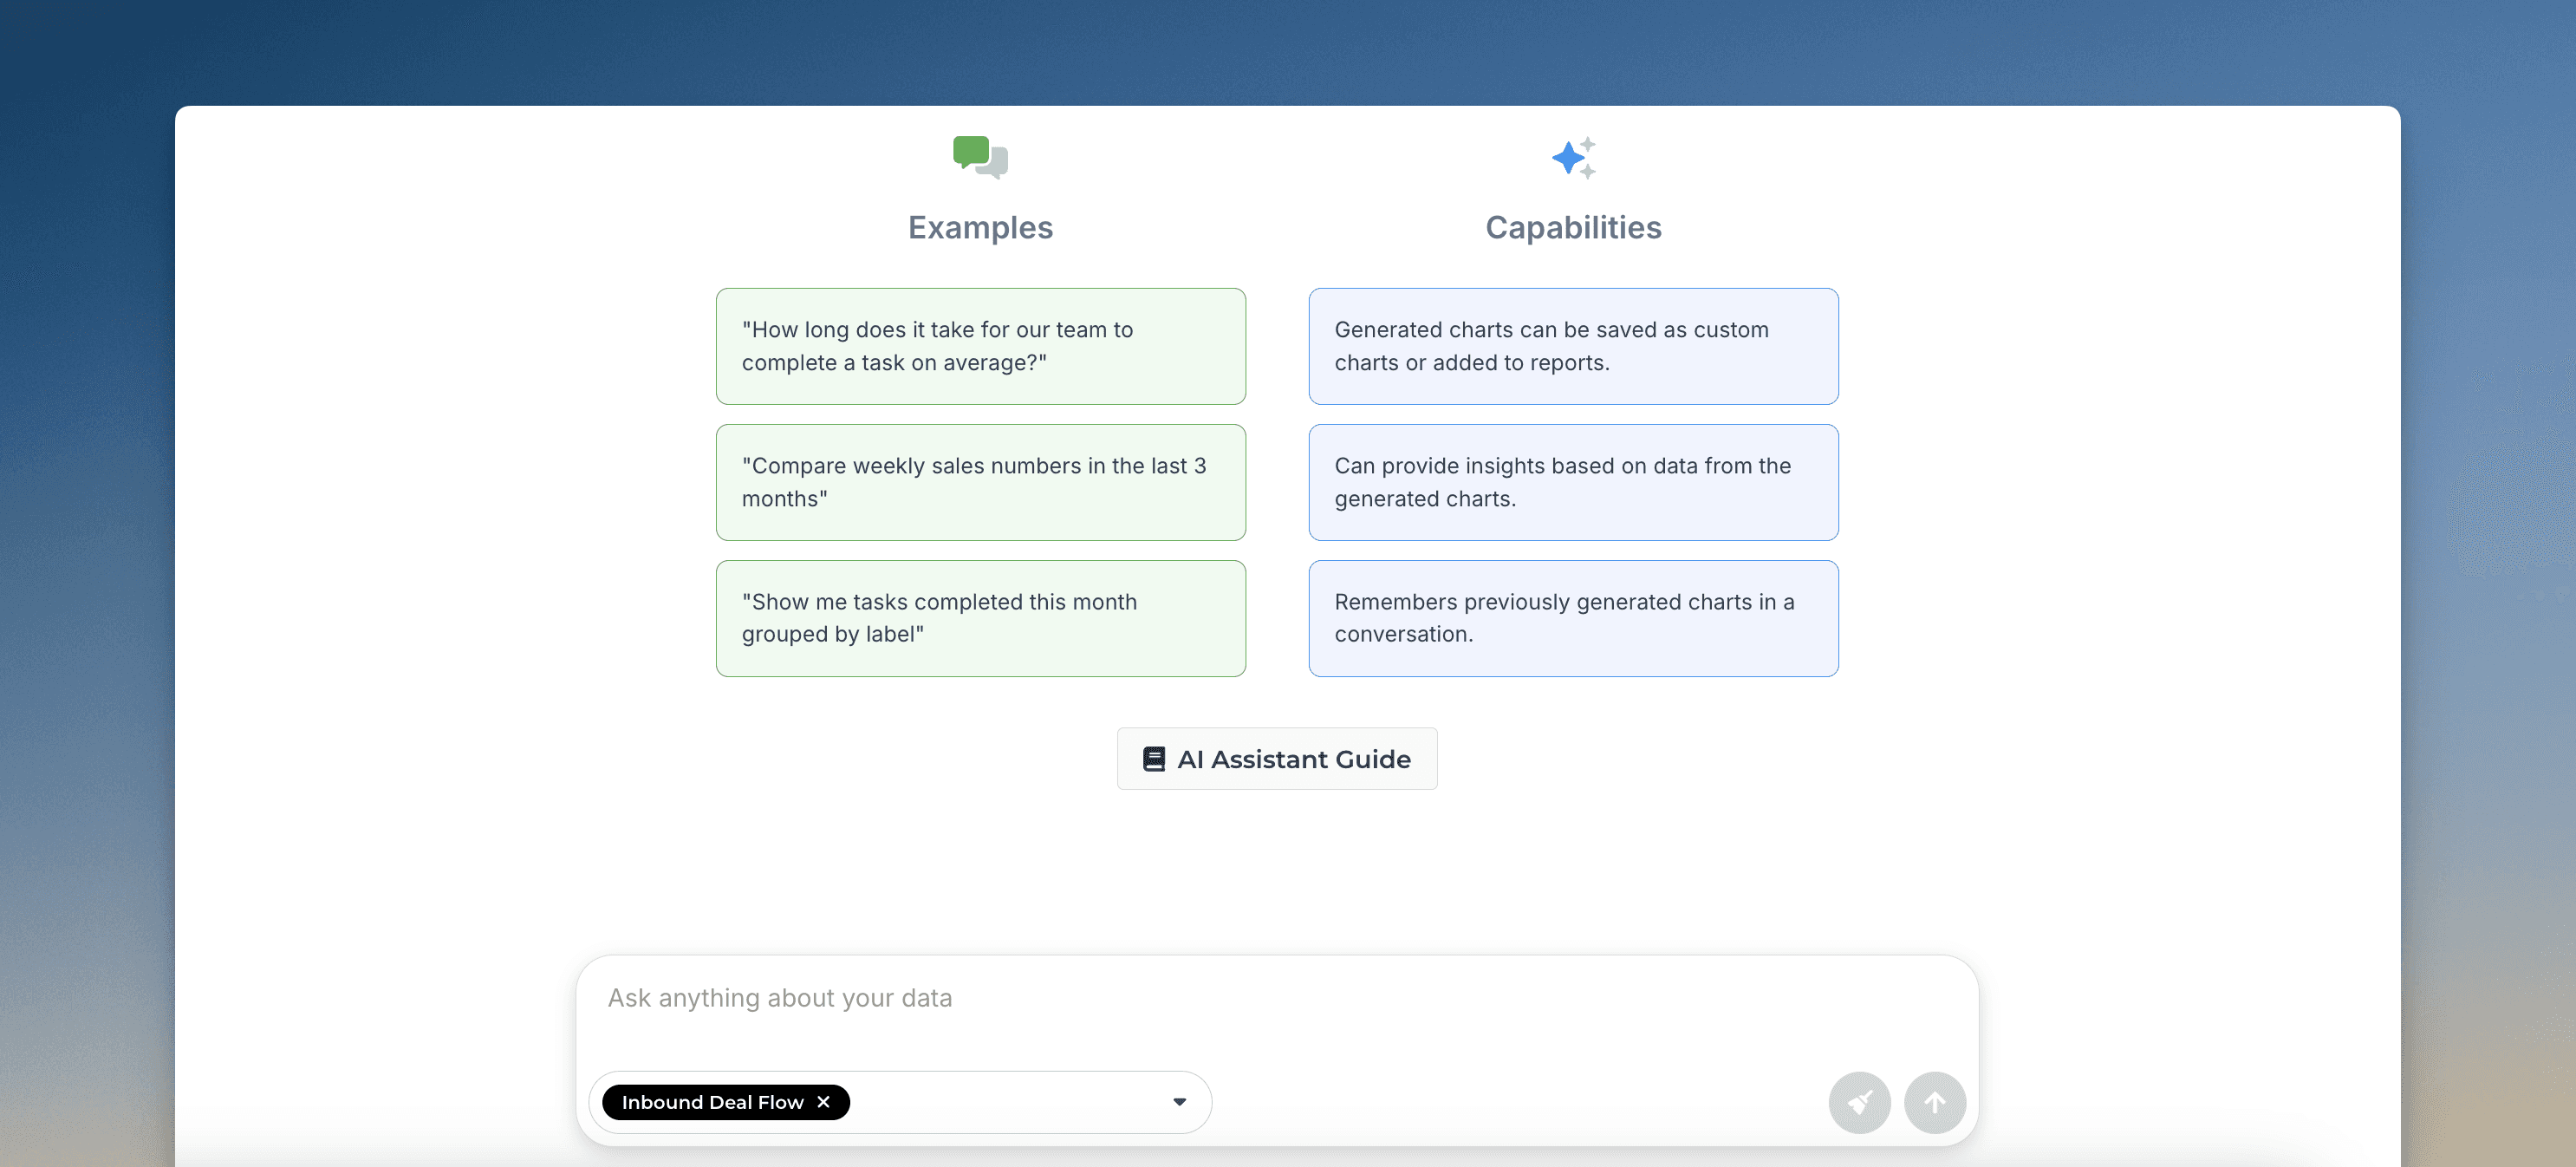
Clicking Expand view opens the AI assistant in full width:
Ask questions about your data
You can ask questions about creating charts, managing accounts, data integrations, subscriptions, and basically anything related to how your work gets done in your team. Here are some sample questions:
"How can I track work based on my custom date fields?"
"What is difference between the lead and cycle time?"
"How often is data updated"
You can open the AI assistant on the side dock at any time to ask questions:
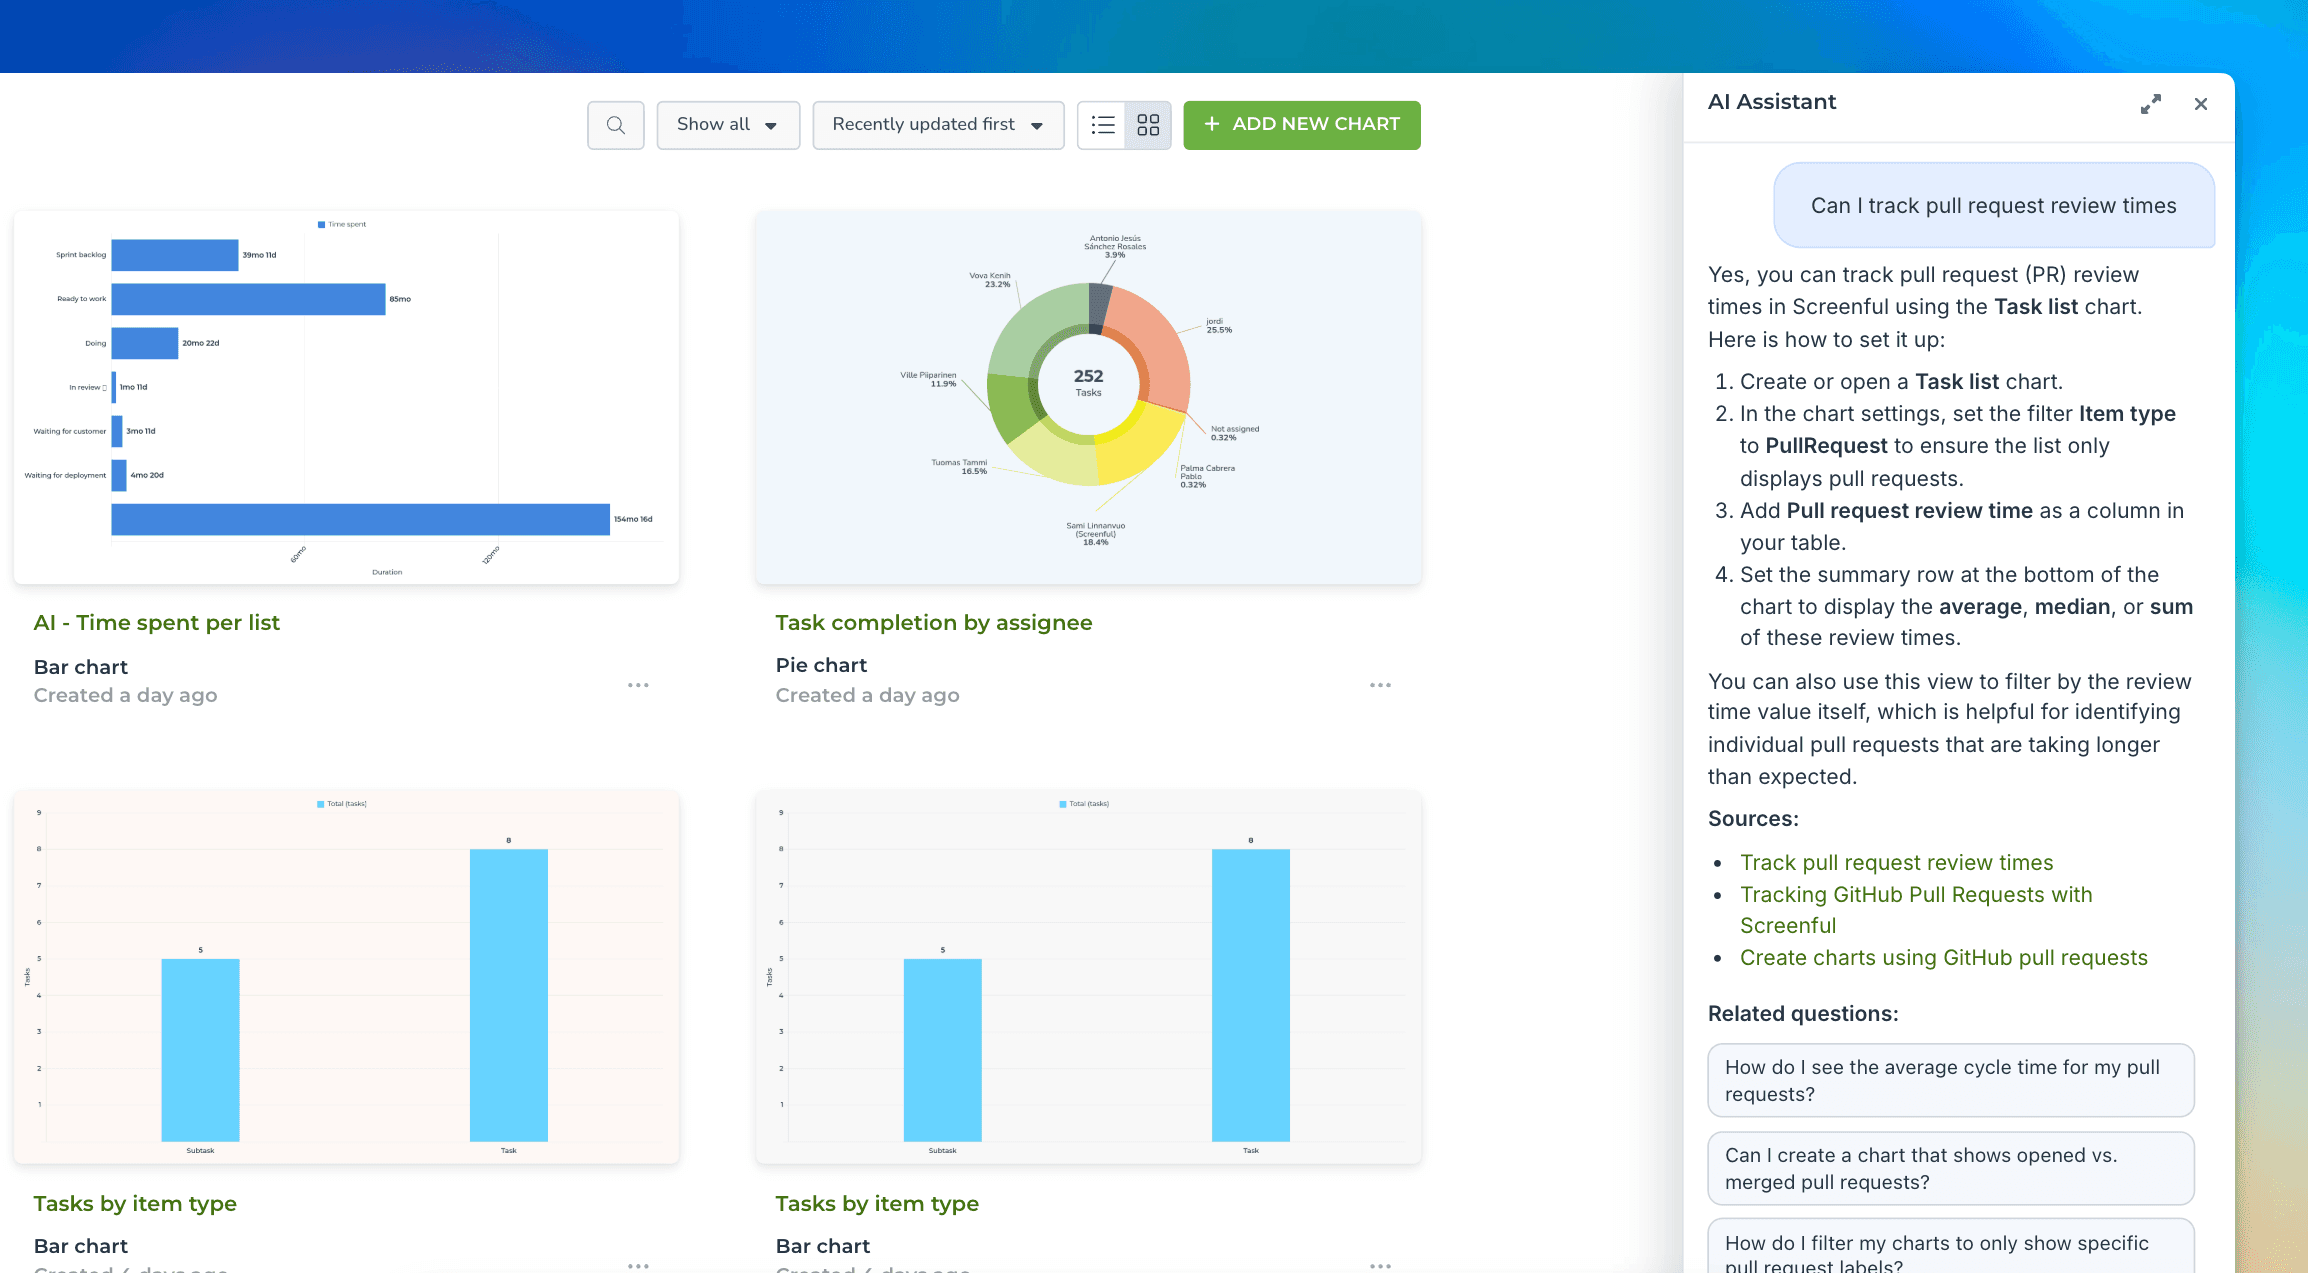
You can follow up with more detailed questions and have a conversation with the assistant.
When you ask a question, you don't only get a response, but the AI assistant will also include links to the sources and related questions.
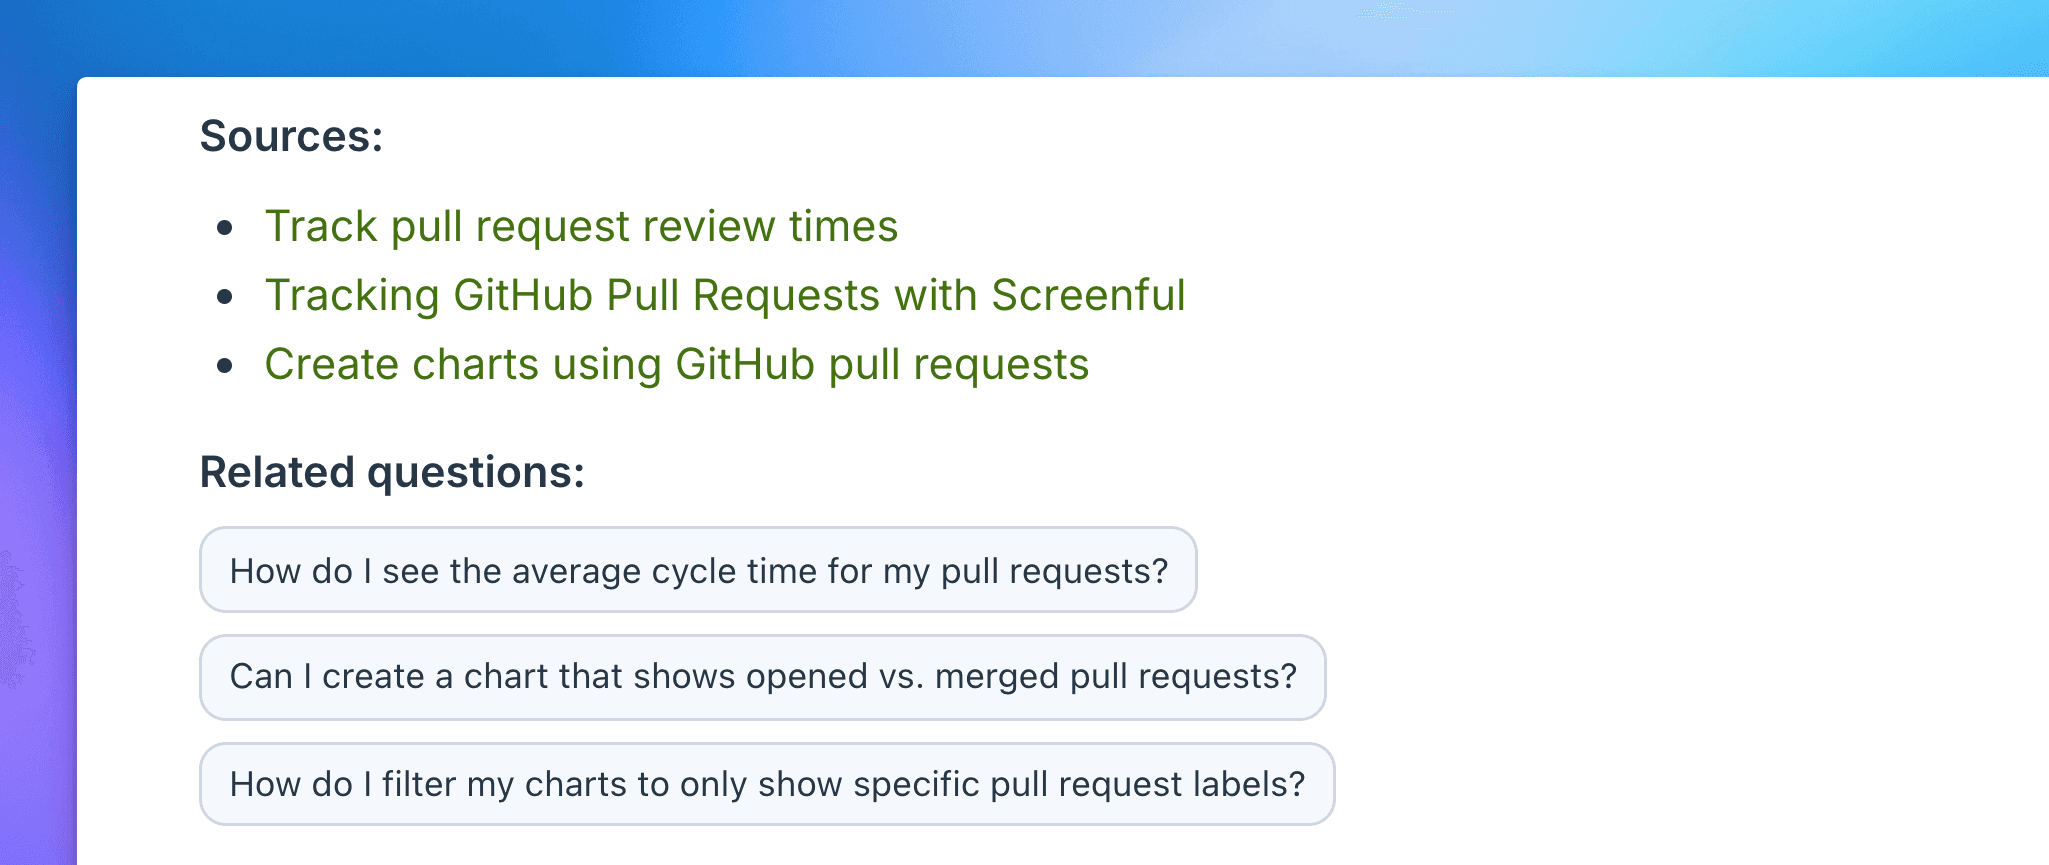
You can click the links in the Sources section to view the human-written guides used as data sources. To help you explore further, Related questions are shown.
Create charts with a prompt
You can create a chart by describing it in natural language (any language).
"Show me task completed this month grouped by label"
"Compare weekly sales numbers in the last 3 months"
"How long does it take for our team to complete a task on average?"
If the assistant understood that you want to create a chart, you should see a chart as a result. You can refine the chart with further asks:
"Switch the chart to a line chart and add another line to compare with the total sales from the same period."
The assistant adjusts the chart according to your request. You can always undo the latest change and try again with a different prompt.
You can click through the charts to verify that the presented numbers are correct.
At any time, you can open the chart for editing by clicking Edit below the chart. The chart editor is opened, and you can adjust the chart configuration.
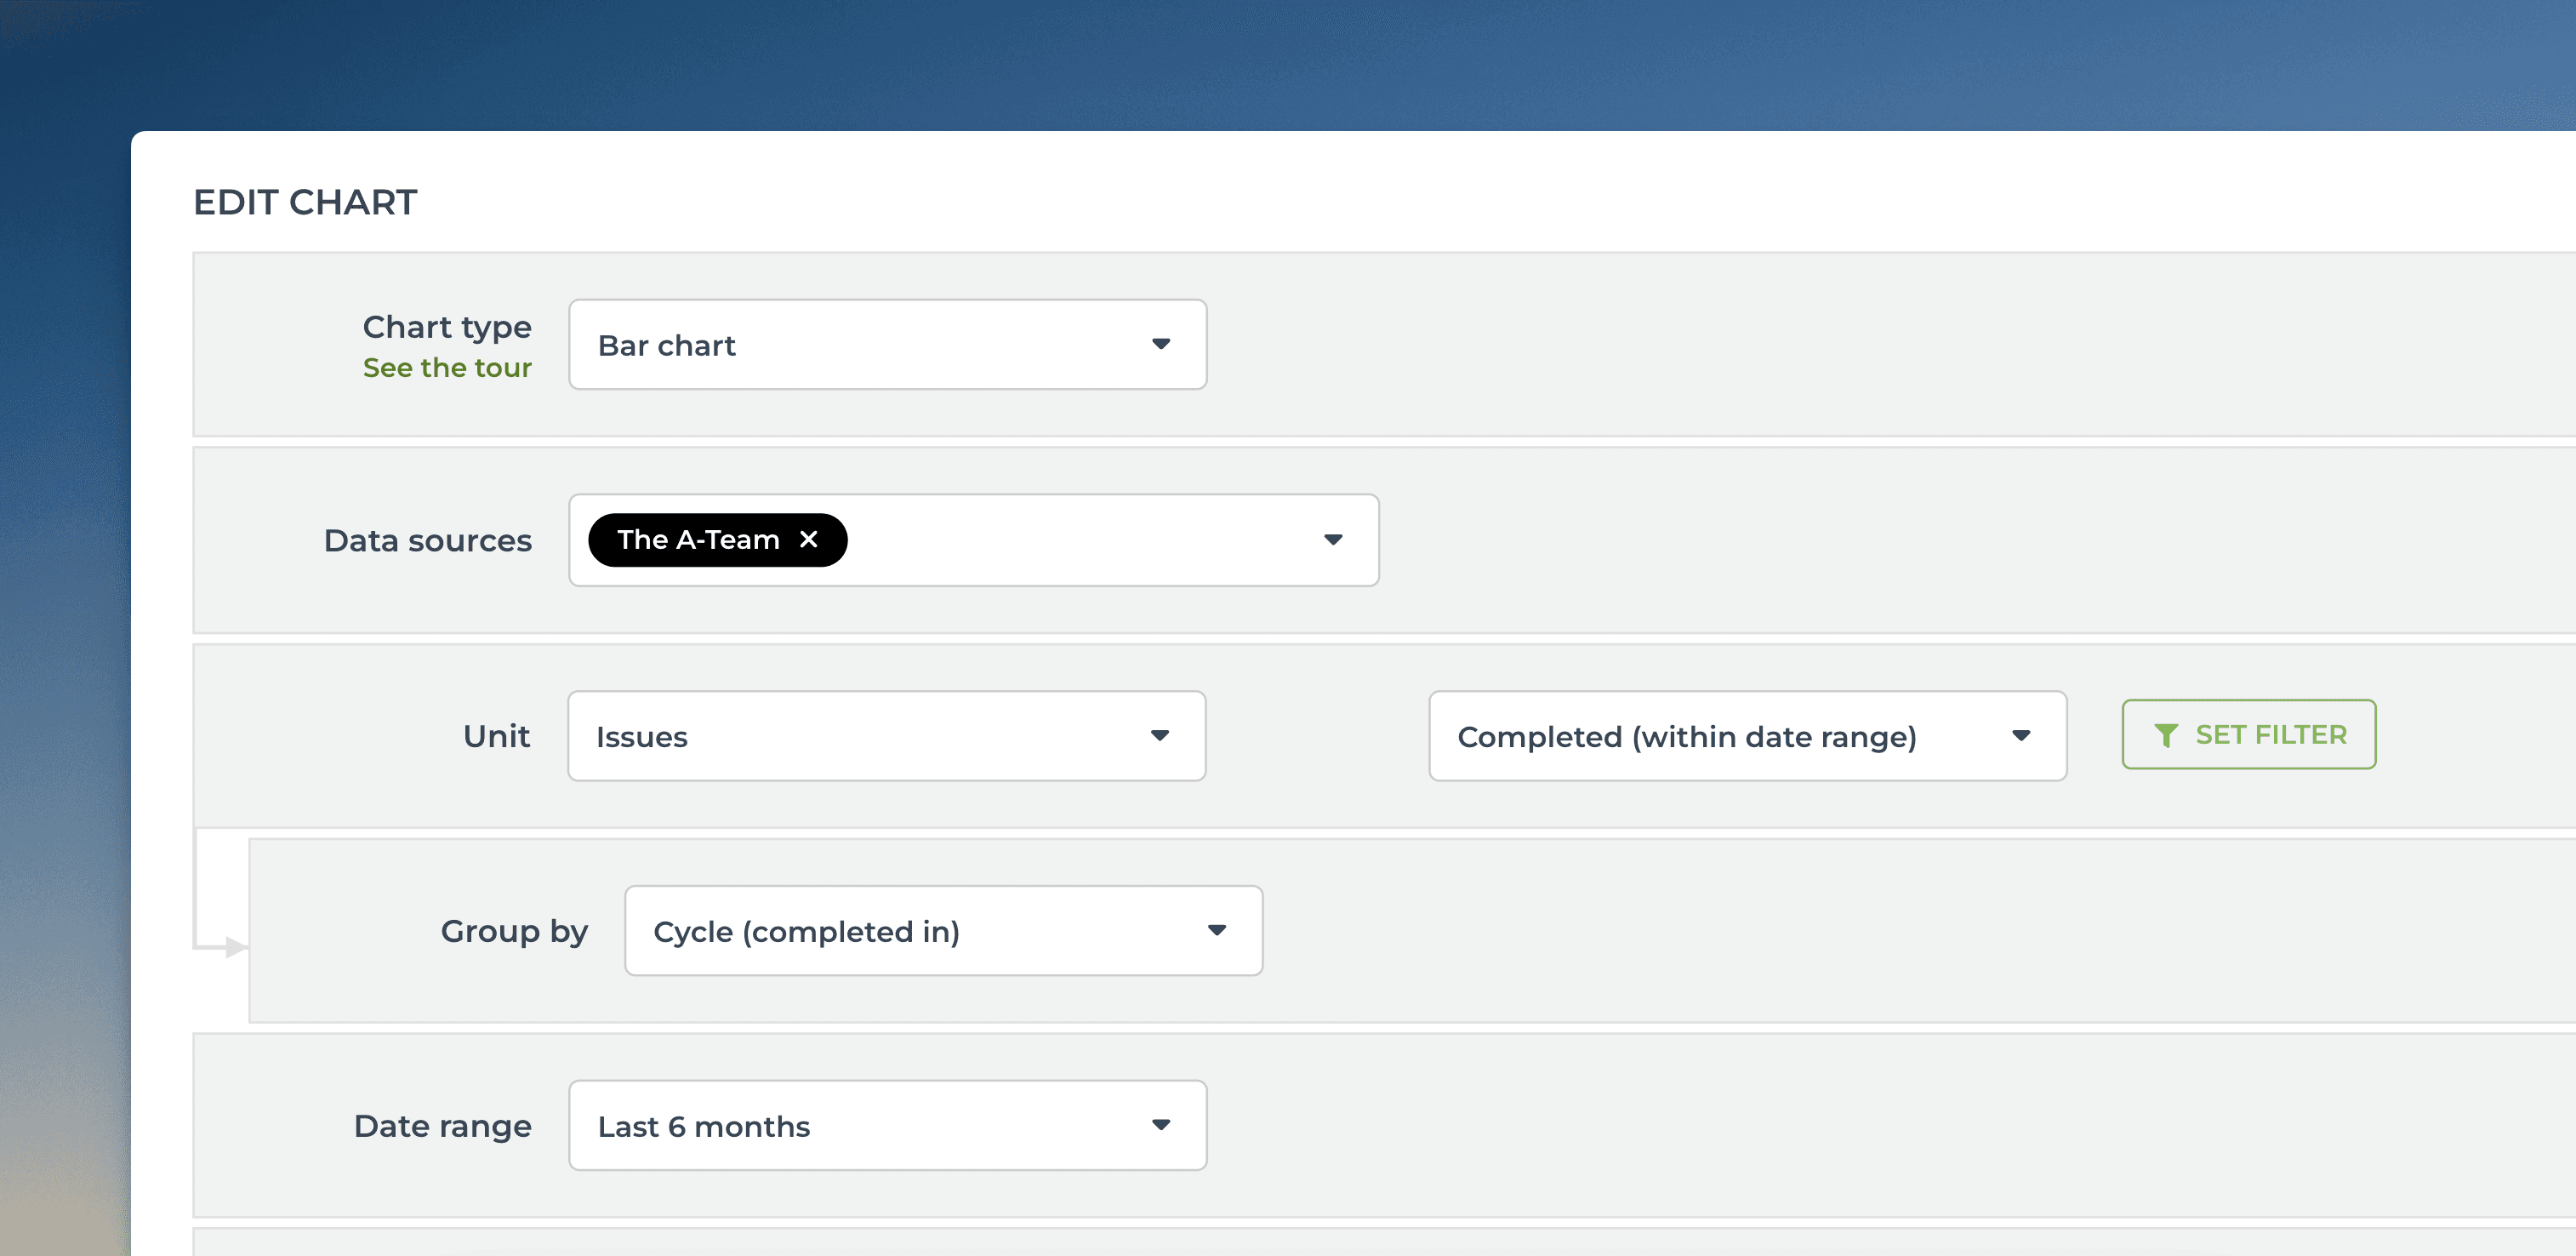
With the editor, you can change the unit, select metric, set filters, and grouping, and adjust the date range. Even if the chart created by the assistant is not exactly what you were looking for, you can always finish it with the editor.
Clicking Save below the chart saves it, and you can find it in the Charts tab.
Let us know if you have questions or feedback by contacting hello@screenful.com. To stay on the loop, read our blog, or follow us on LinkedIn.
That’s it for this release. As always, we’d love to hear from you. Please do not hesitate to contact us anytime if you have questions or feedback.
To give it a try with your own data, sign up for a free 14-day trial
Also, check out recent product updates and follow us on Twitter or Facebook.