Mar 30, 2023
Our library of custom charts just got a new chart type: the pie chart. Pie charts are well-suited for visualizing data when:
The dataset consists of a relatively small number of categories
The primary goal is to compare individual categories to the whole
Percentages or relative proportions are of greater importance than exact numerical values
If you have a lot of categories to display, we recommend using a bar chart or a stacked bar chart instead.
Here’s an example chart:
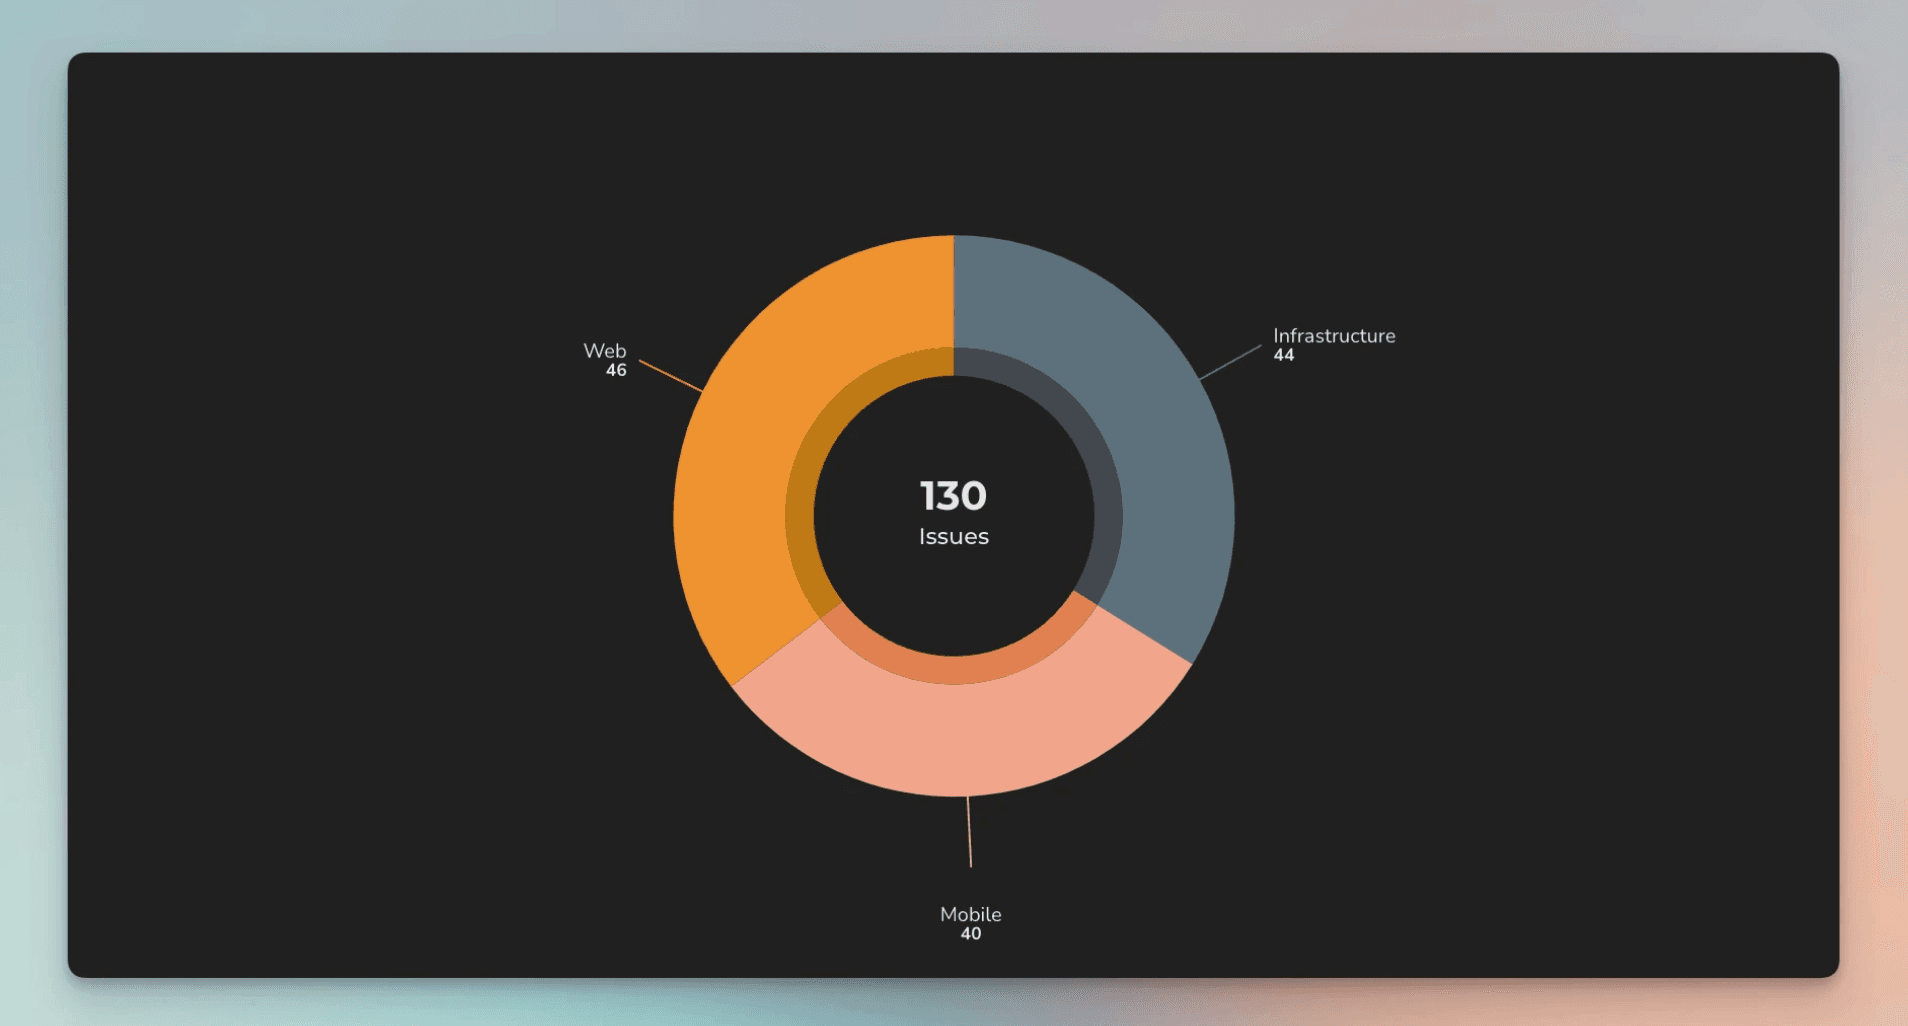
So what makes our pie chart so special? We’ve made several design decisions to avoid the pitfalls that are common with the pie charts we’ve seen (i.e. the ones that do suck):
The chart has a donut form (instead of a solid circle), making it easier to read and compare when there are multiple categories with similar proportions.
The center of the chart is used to display the sum of values, providing additional context to the data being displayed.
All the data (labels and values) is visible without the user having to mouse hover.
Instead of a separate legend, labels are directly connected with arcs.
Pie charts excel at visualizing the parts of a whole relationship. They're a good choice when you have a fairly small number of options to compare.
Learn more about the Pie chart in the Tour page.
Let us know if you have questions or feedback by contacting hello@screenful.com. To stay on the loop, read our blog, or follow us on LinkedIn.
That’s it for this release. As always, we’d love to hear from you. Please do not hesitate to contact us anytime if you have questions or feedback.
To give it a try with your own data, sign up for a free 14-day trial
Also, check out recent product updates and follow us on Twitter or Facebook.