Nov 20, 2025

You can now create a chart with a prompt using the AI Assistant feature. Ask a question, and get a chart as a response. You can ask the assistant to explain the chart to you or request modifications. Once you're happy with the chart, you can save it as a custom chart.
It's now available for all users, so go ahead and give it a spin!
Create chart with a prompt
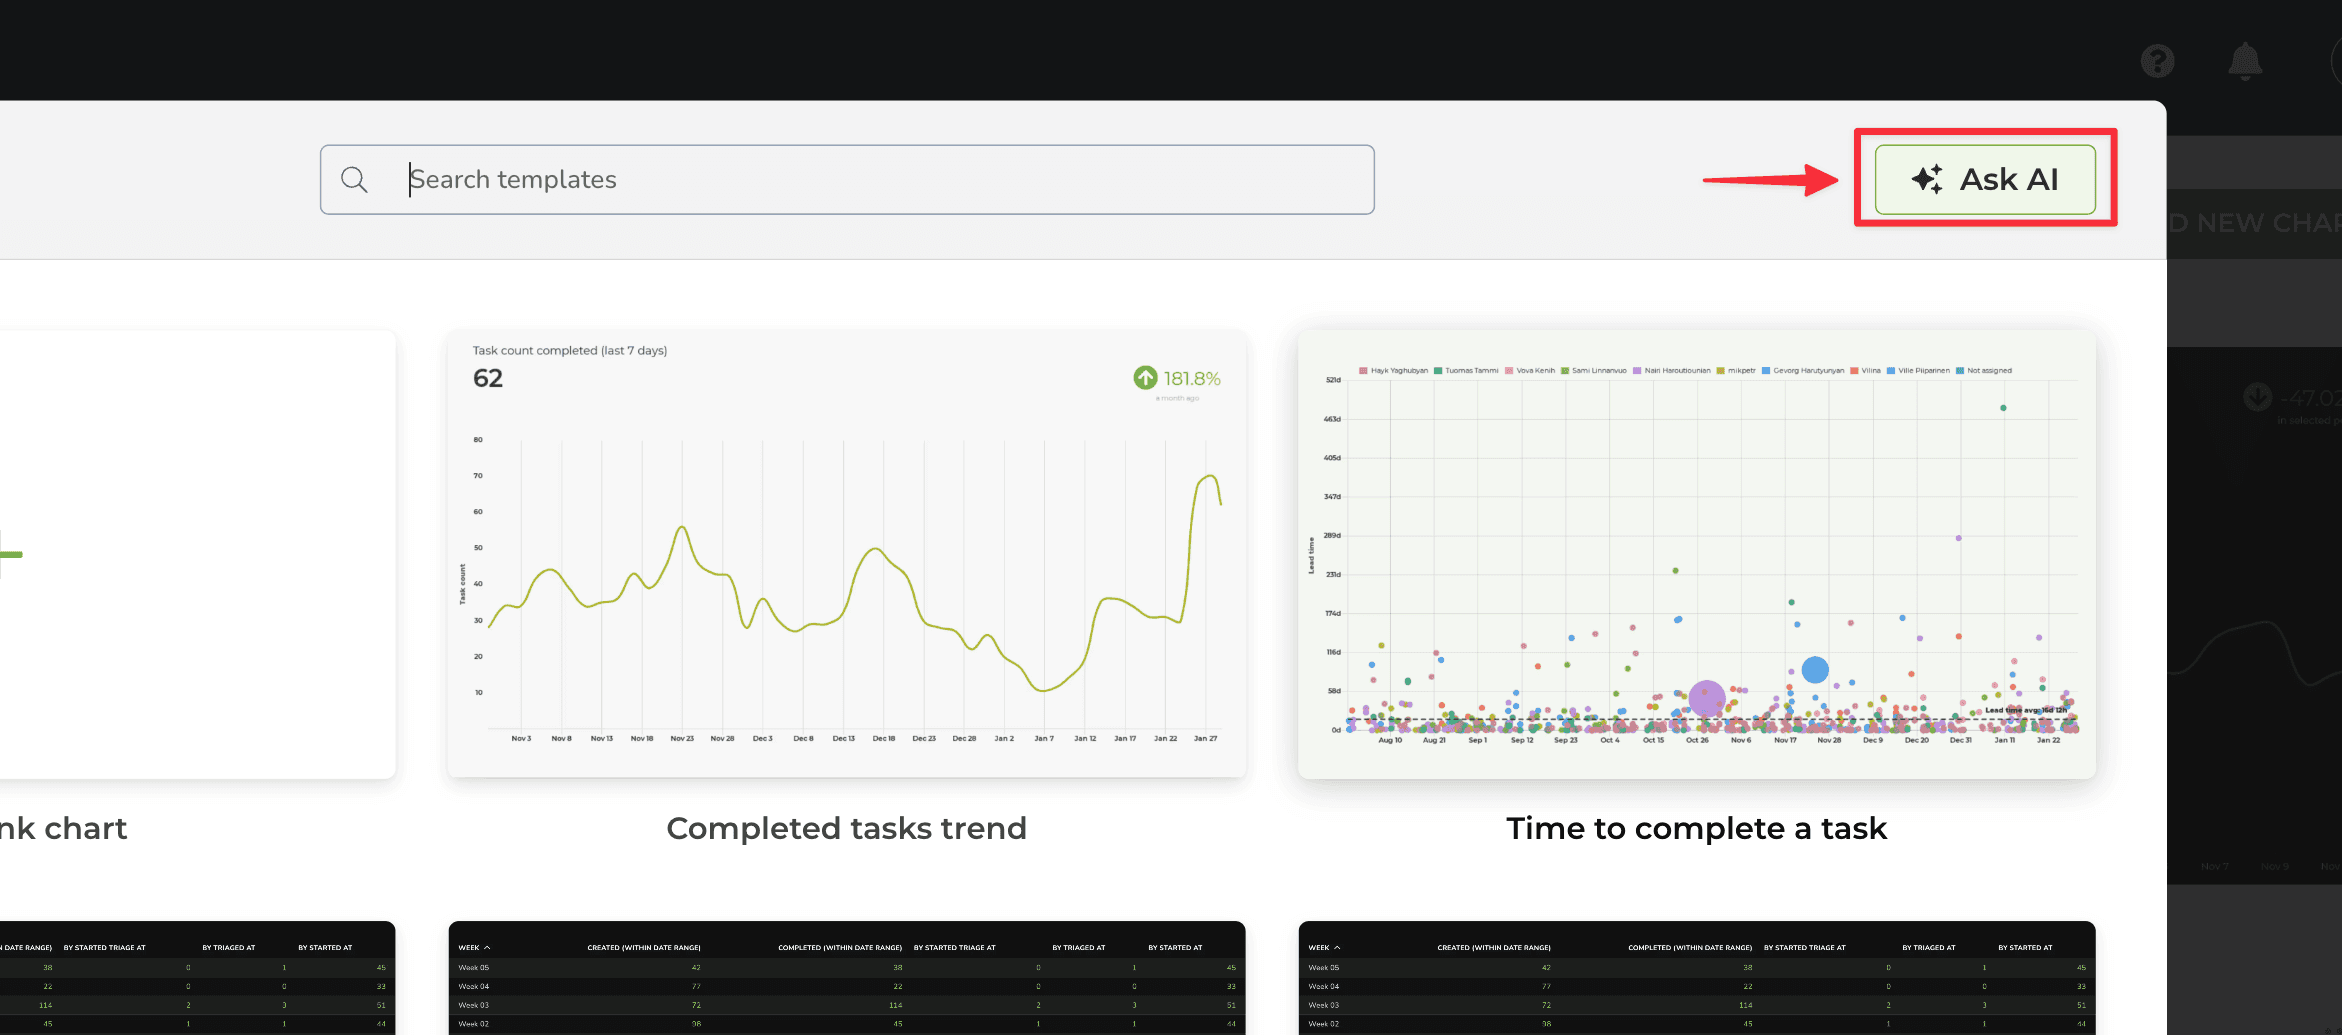
The AI assistant can be launched from the charts modal by clicking the Ask AI button on the top right corner:
A chat view opens, and you can start chatting with the assistant:
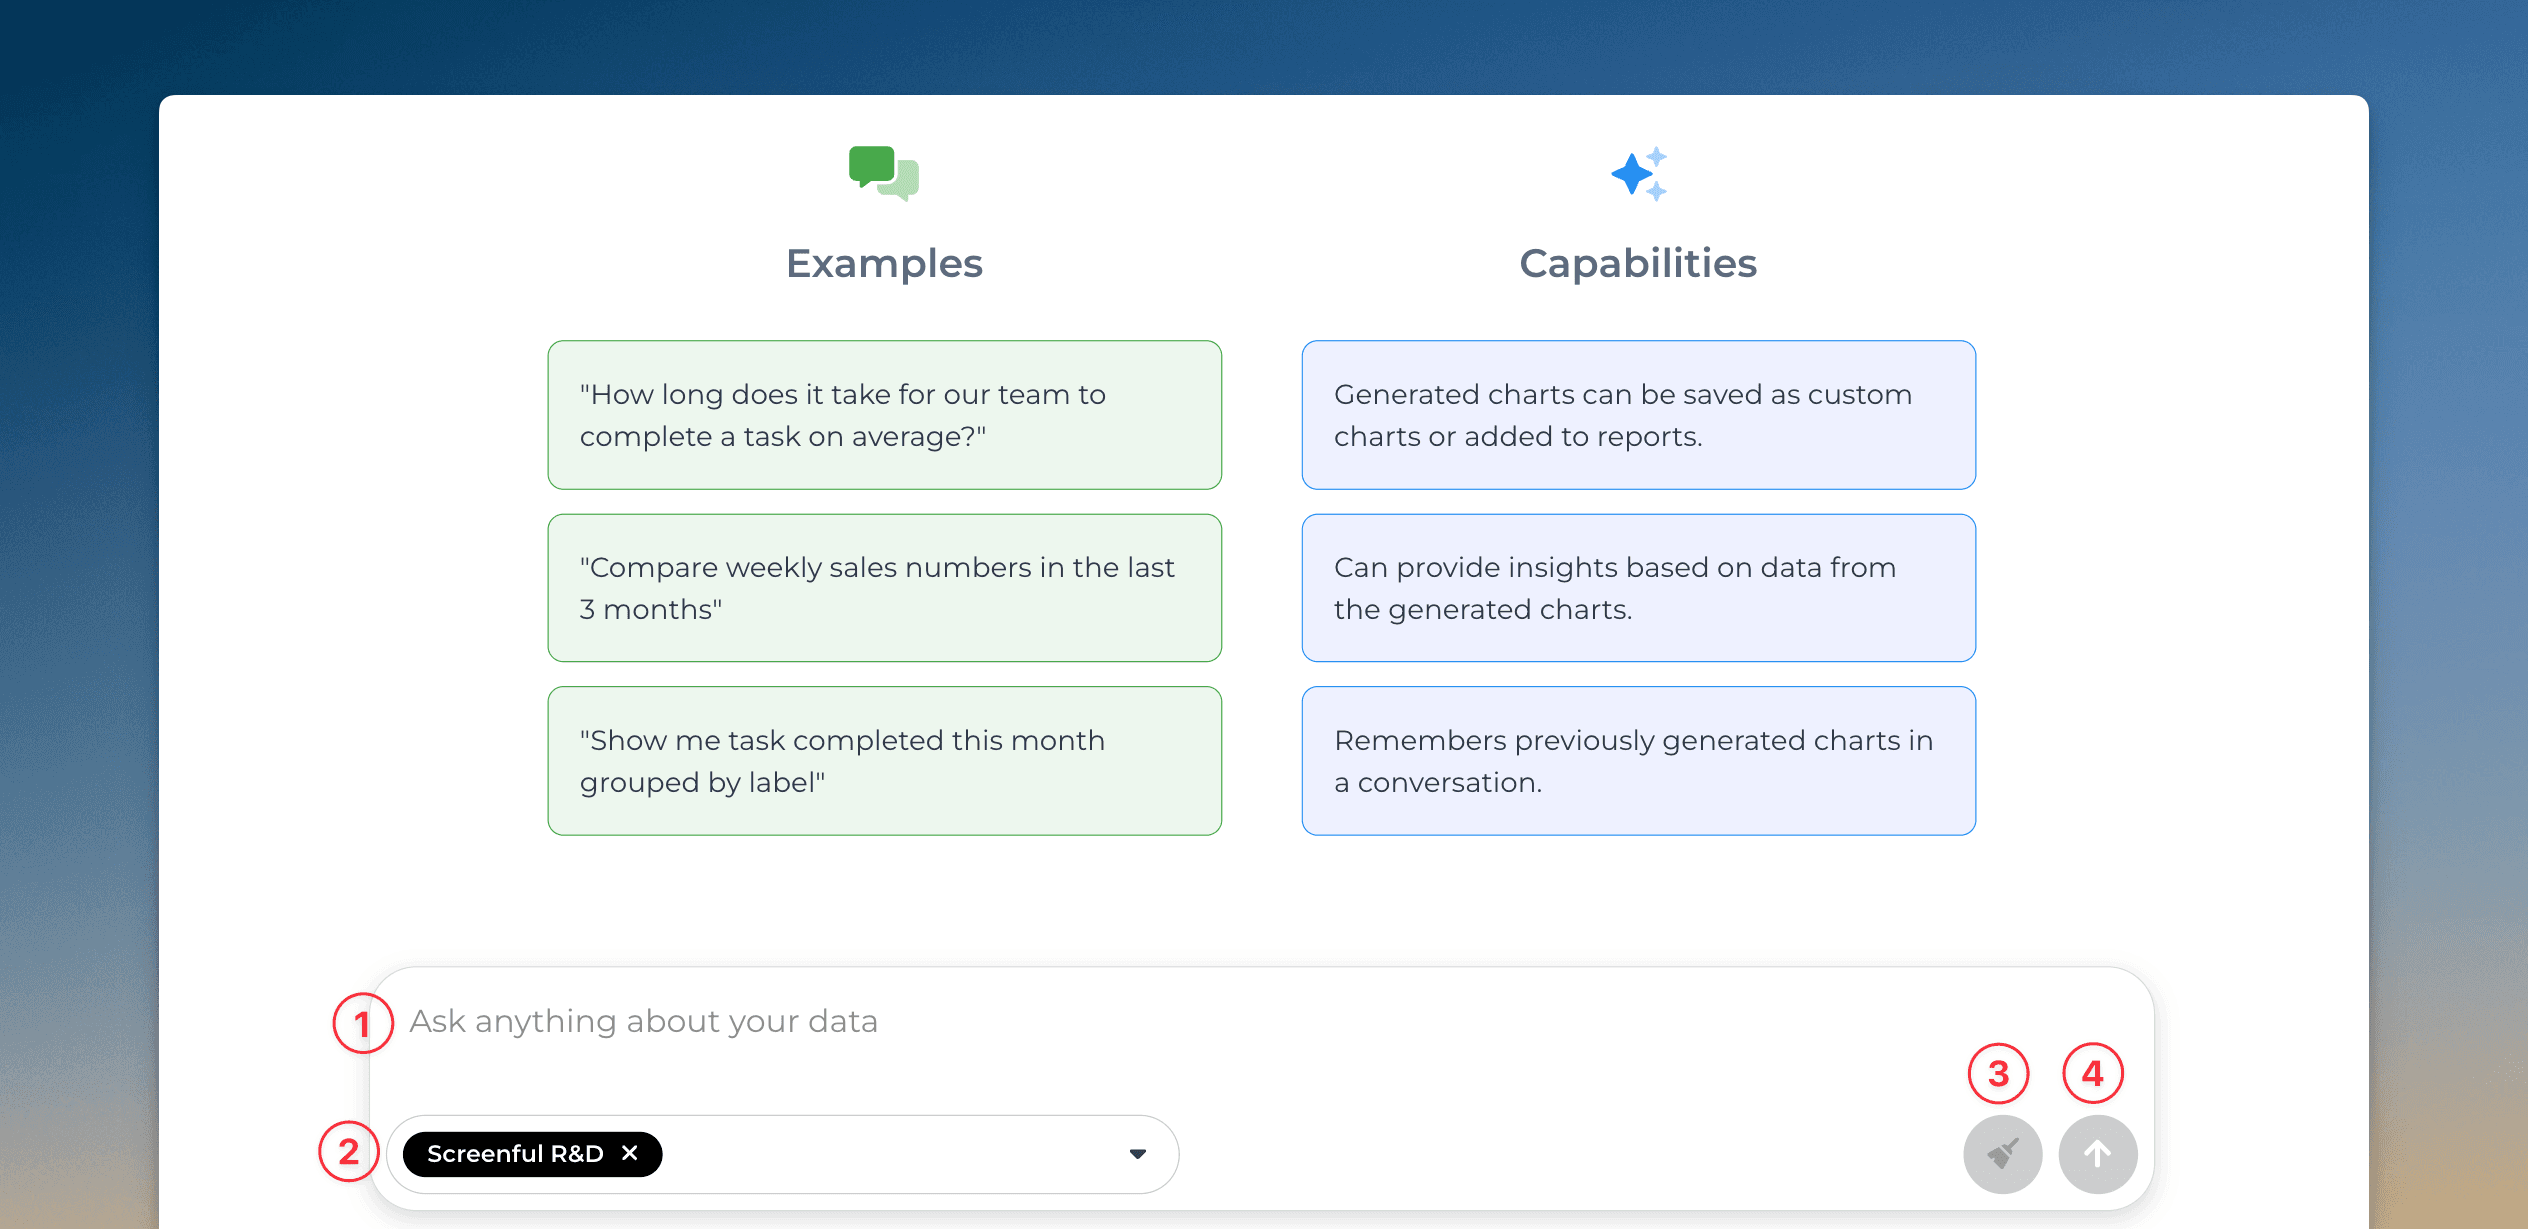
The numbered elements are:
Enter a prompt in a natural language (in English or your native language)
Select data sources from the drop-down menu.
Clear chat history. Removes chats and makes the assistant forget previous prompts.
Send message (same as pressing the enter key)
You can create a chart by describing it in natural language (any language). You can ask questions like
"Show me task completed this month grouped by label"
"Compare weekly sales numbers in the last 3 months"
"How long does it take for our team to complete a task on average?"
If the assistant understood your prompt, you should see a chart as a result. You can refine the chart with further asks:
"Switch the colors of the bars to blue and change the grouping to assignee"
The assistant adjusts the chart according to your request. You can always undo the latest change and try again with a different prompt.
At any time, you can open the chart for editing by clicking Edit below the chart. The chart editor is opened, and you can adjust the chart configuration.
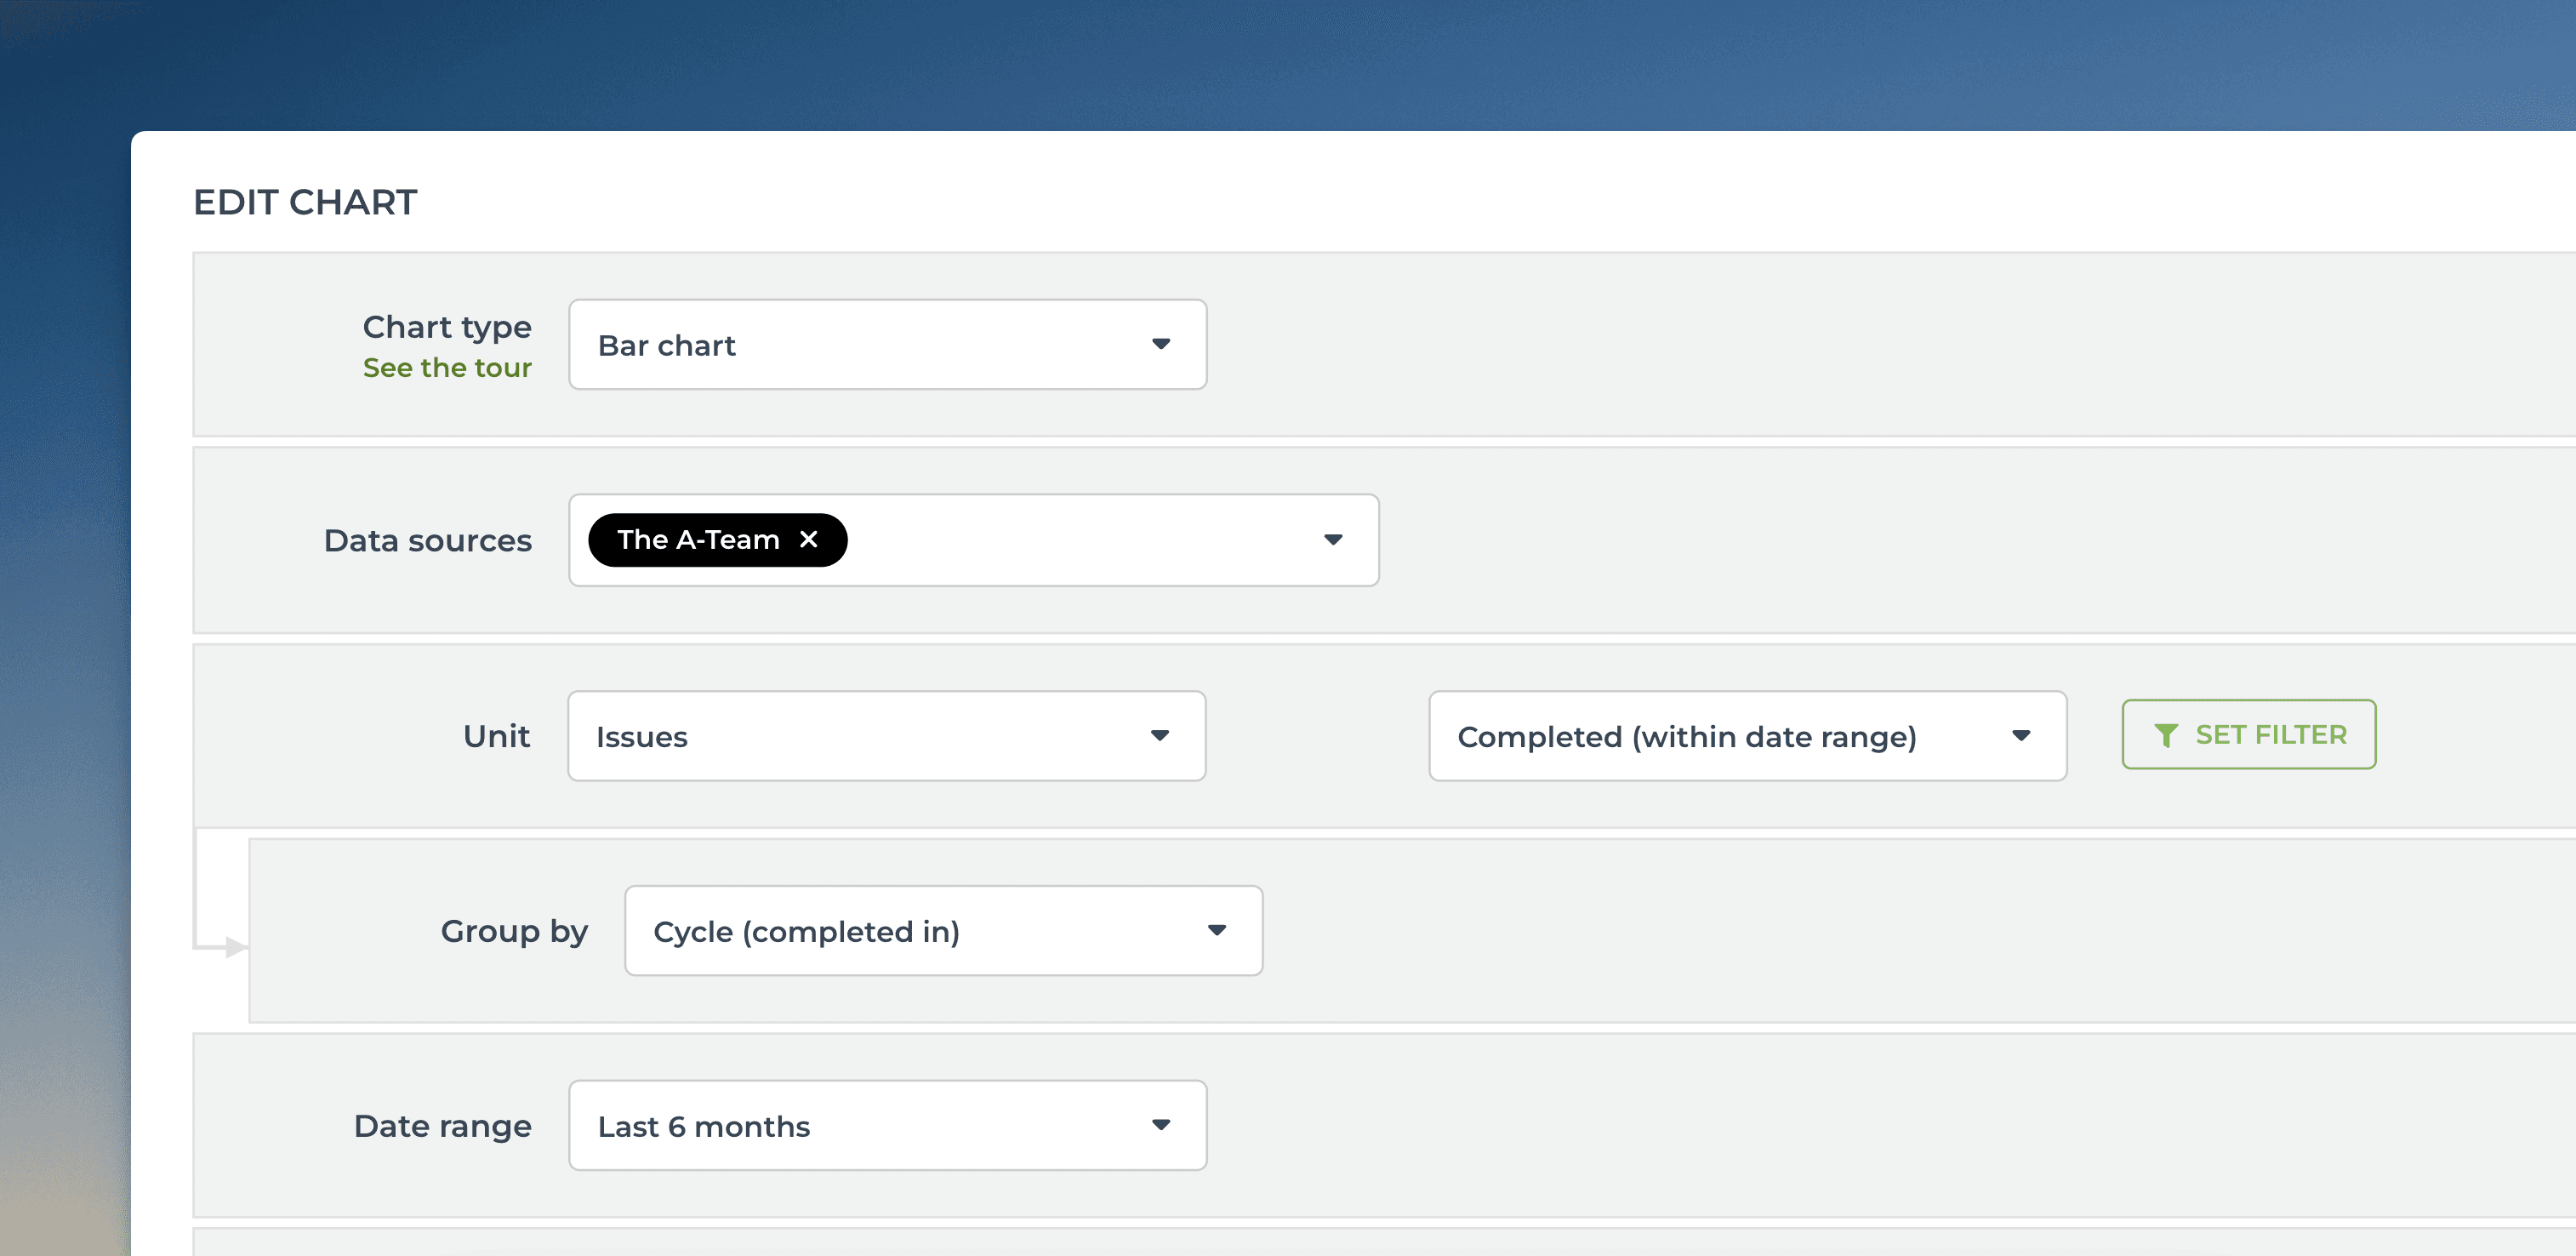
With the editor, you can change the unit, select metric, set filters, and grouping, and adjust the date range. Even if the chart created by the assistant is not exactly what you were looking for, you can always finish it with the editor.
Clicking Save below the chart saves it, and you can find it in the Charts tab.
Does it work? Tips for succesful prompting
As with any generative AI implementation, there is variation in the results. If you know the right prompts, it can feel like magic, but as soon as you try something more complicated, you may get a response that is in the correct territory but not exactly what you expected. Then you can fine-tune your prompt and try again.
The good news is that if a chart is generated, you can trust that the data is correct. We don't let AI assistant generate the numbers because then you wouldn't be able to trust what you see. Instead, the assistant helps you find the right chart configuration, which is then turned into a chart. It's an alternative to creating a chart with the editor.
Here are some tips for successful prompting:
If you don't get the correct chart on the first try, try to phrase it a bit differently.
Avoid too complicated prompts. The assistant knows a lot about your data. It knows your workflow, your projects, custom fields etc. You can just ask without explaining too much.
If you need to create something more complex, like a table chart with many columns, you'll likely need multiple prompts
Don't worry if the chart is not exactly what you wanted; you can always edit it manually.
You can learn more about the AI assistant from this guide.
Let us know if you have questions or feedback by contacting hello@screenful.com. To stay on the loop, read our blog, or follow us on LinkedIn.
That’s it for this release. As always, we’d love to hear from you. Please do not hesitate to contact us anytime if you have questions or feedback.
To give it a try with your own data, sign up for a free 14-day trial
Also, check out recent product updates and follow us on Twitter or Facebook.