
Tracking due dates of Asana tasks
Aug 1, 2025
Managing due dates in Asana is essential for keeping projects on track and teams aligned. Whether you're juggling multiple tasks or coordinating with a team, knowing what's due, what's overdue, and what's coming up is crucial. In this post, we'll walk through how to track overdue or upcoming tasks, analyze timely vs. late completions, and visualize your planned work for the future.
Contents:
Setting start and due dates for Asana tasks
To add a start date or a due date:
Click on the Due Date field within the task.
Click on or type in the due date.
Click on or type in your desired start date to the left of the due date.

Once you have added start or due dates for your tasks, Screenful reads them and lets you create task lists and charts based on those dates.
You can also use any of your custom Date fields to represent the start dates or due dates. Learn how to configure any custom date field as start or due date for tasks.
When you adjust the data in your board, the changes will be reflected in the chart after the next data sync, which runs automatically once per hour. You can trigger the sync manually from the main menu.
Tasks overdue or due soon
The Task list displays data as rows and columns. You can set a filter to limit the list to any subset of items.
You can see overdue tasks by setting a filter Status > Overdue

Here's the resulting chart:

To view which tasks are about to become overdue, you can set a filter that includes only tasks with a due date within the selected date range. Here's an example filter for Due date within the next 5 days

Here's the resulting chart:

The columns in the list are configurable, and you can add any task property as a column.
Completed on time vs. completed overdue
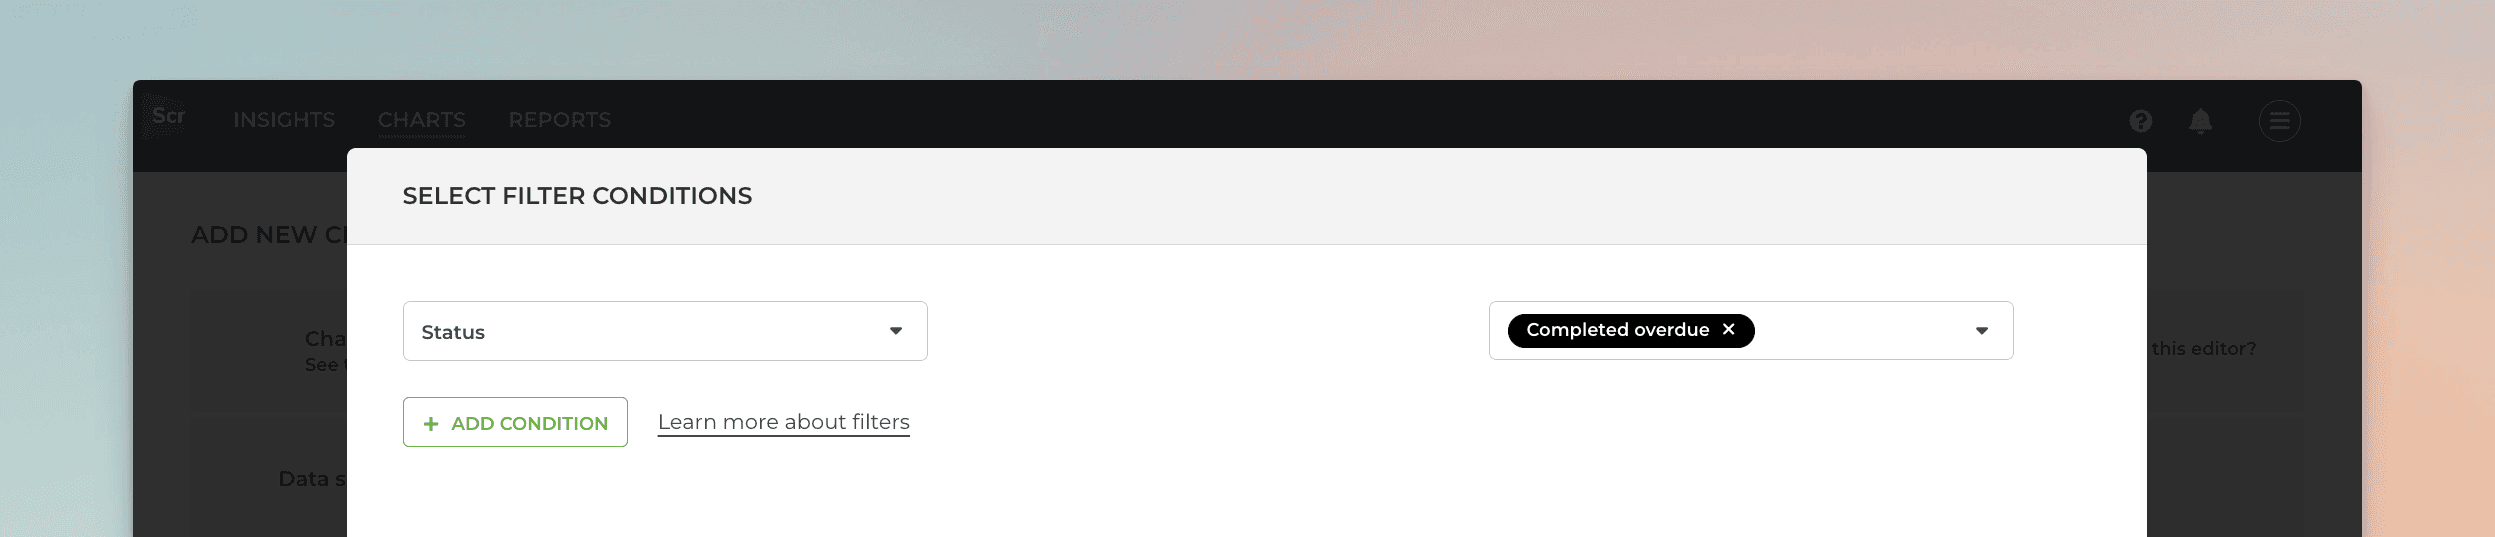
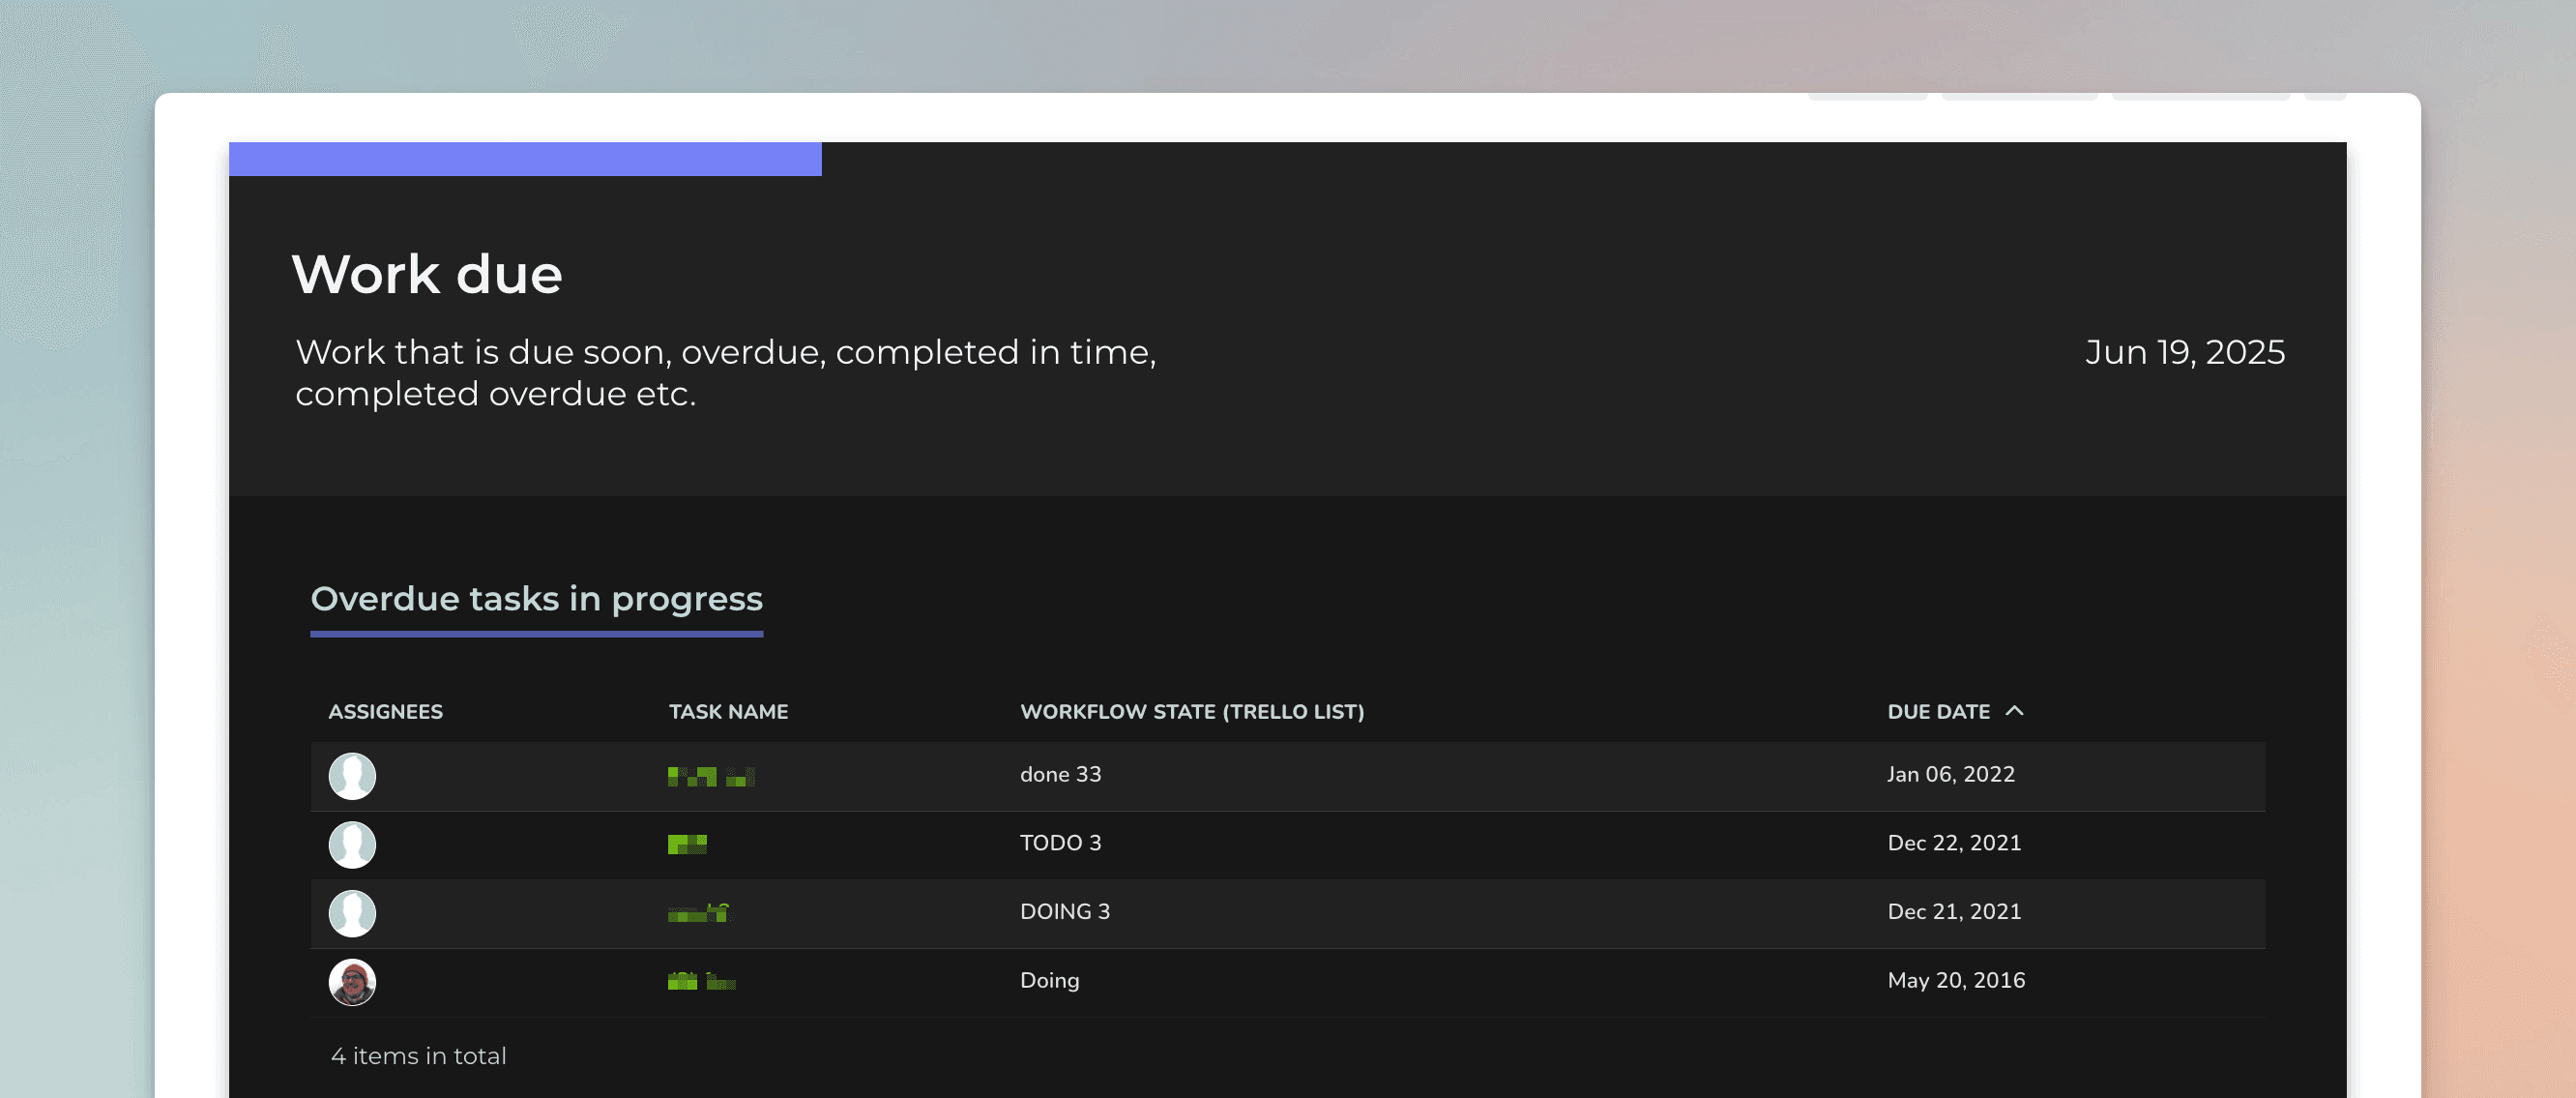
You can track how many tasks were completed overdue by creating a Task list and setting a filter for Completed overdue:
To see which tasks were completed on time, set a filter for Completed on time:

And here's the resulting list:

The list contains the tasks that were completed before the set due date. Clicking the name of the task opens it in your Asana board.
Guide: How to track work completed on time vs completed overdue?
Visualizing the work planned for the future
The Planned work chart shows how much work is planned for the future. It takes all the tasks with a set due date and shows a summary per day/week/month/quarter of the total planned work.
Here’s an example chart:

In this example, the chart is grouped by Week, and the bar segment is Assignee. The chart shows how much work is allocated per week for each assignee. The leftmost bar is the current week. The bars to the right are the future weeks.
The chart shows the work with planned duration. That means a task must have at least a due date set to be included in this chart. Tasks without any deadlines are not included in this chart.
You can mouse-hover the bars to see the work allocated for each indvidual for each week:

You can click through the bars to see the tasks and their due dates.
Create a work due report from a template
The quickest way to start tracking due dates for Asana tasks is by using a Screenful report template. Go to the Reports tab and click Add new report:
A modal opens, showing the available templates. Select Work due. You'll get a comprehensive report that includes the metrics introduced in this article.
The best thing is that each chart in the report is configurable, so you can create the exact report you need.
About Screenful
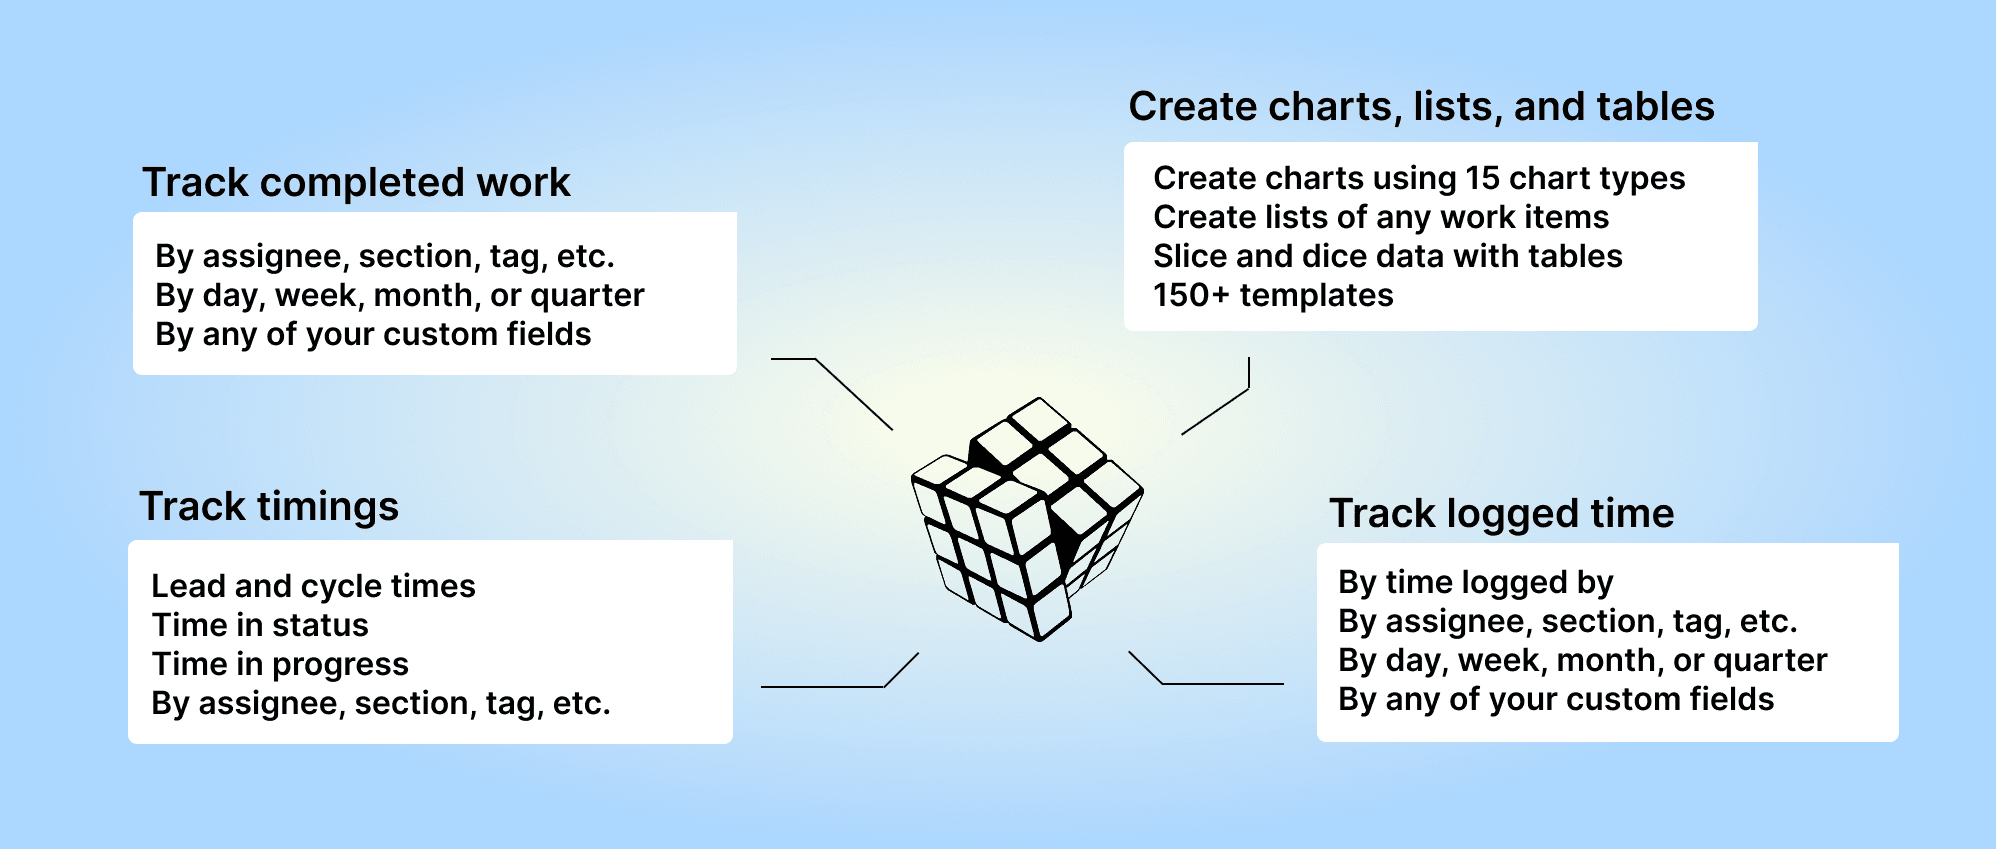
Screenful provides multidimensional analytics of the data in Asana. You can slice & dice your data with 15 different chart types, and click through to drill into details.
Analytics & Reports by Screenful is available on Asana Apps and Integrations.
Let us know if you have questions or feedback by contacting hello@screenful.com. To stay on the loop, read our blog, or follow us on LinkedIn.
