Track the amount of work that was completed on time (before due date) or overdue (after due date). Track trends and the percentage of work completed on time vs overdue.
You can do that with the combination of the Status> filter, and the table chart with formulas.
Tracking work completed on time
You can track work that was completed before the due date by setting a filter for Status> Completed on time:
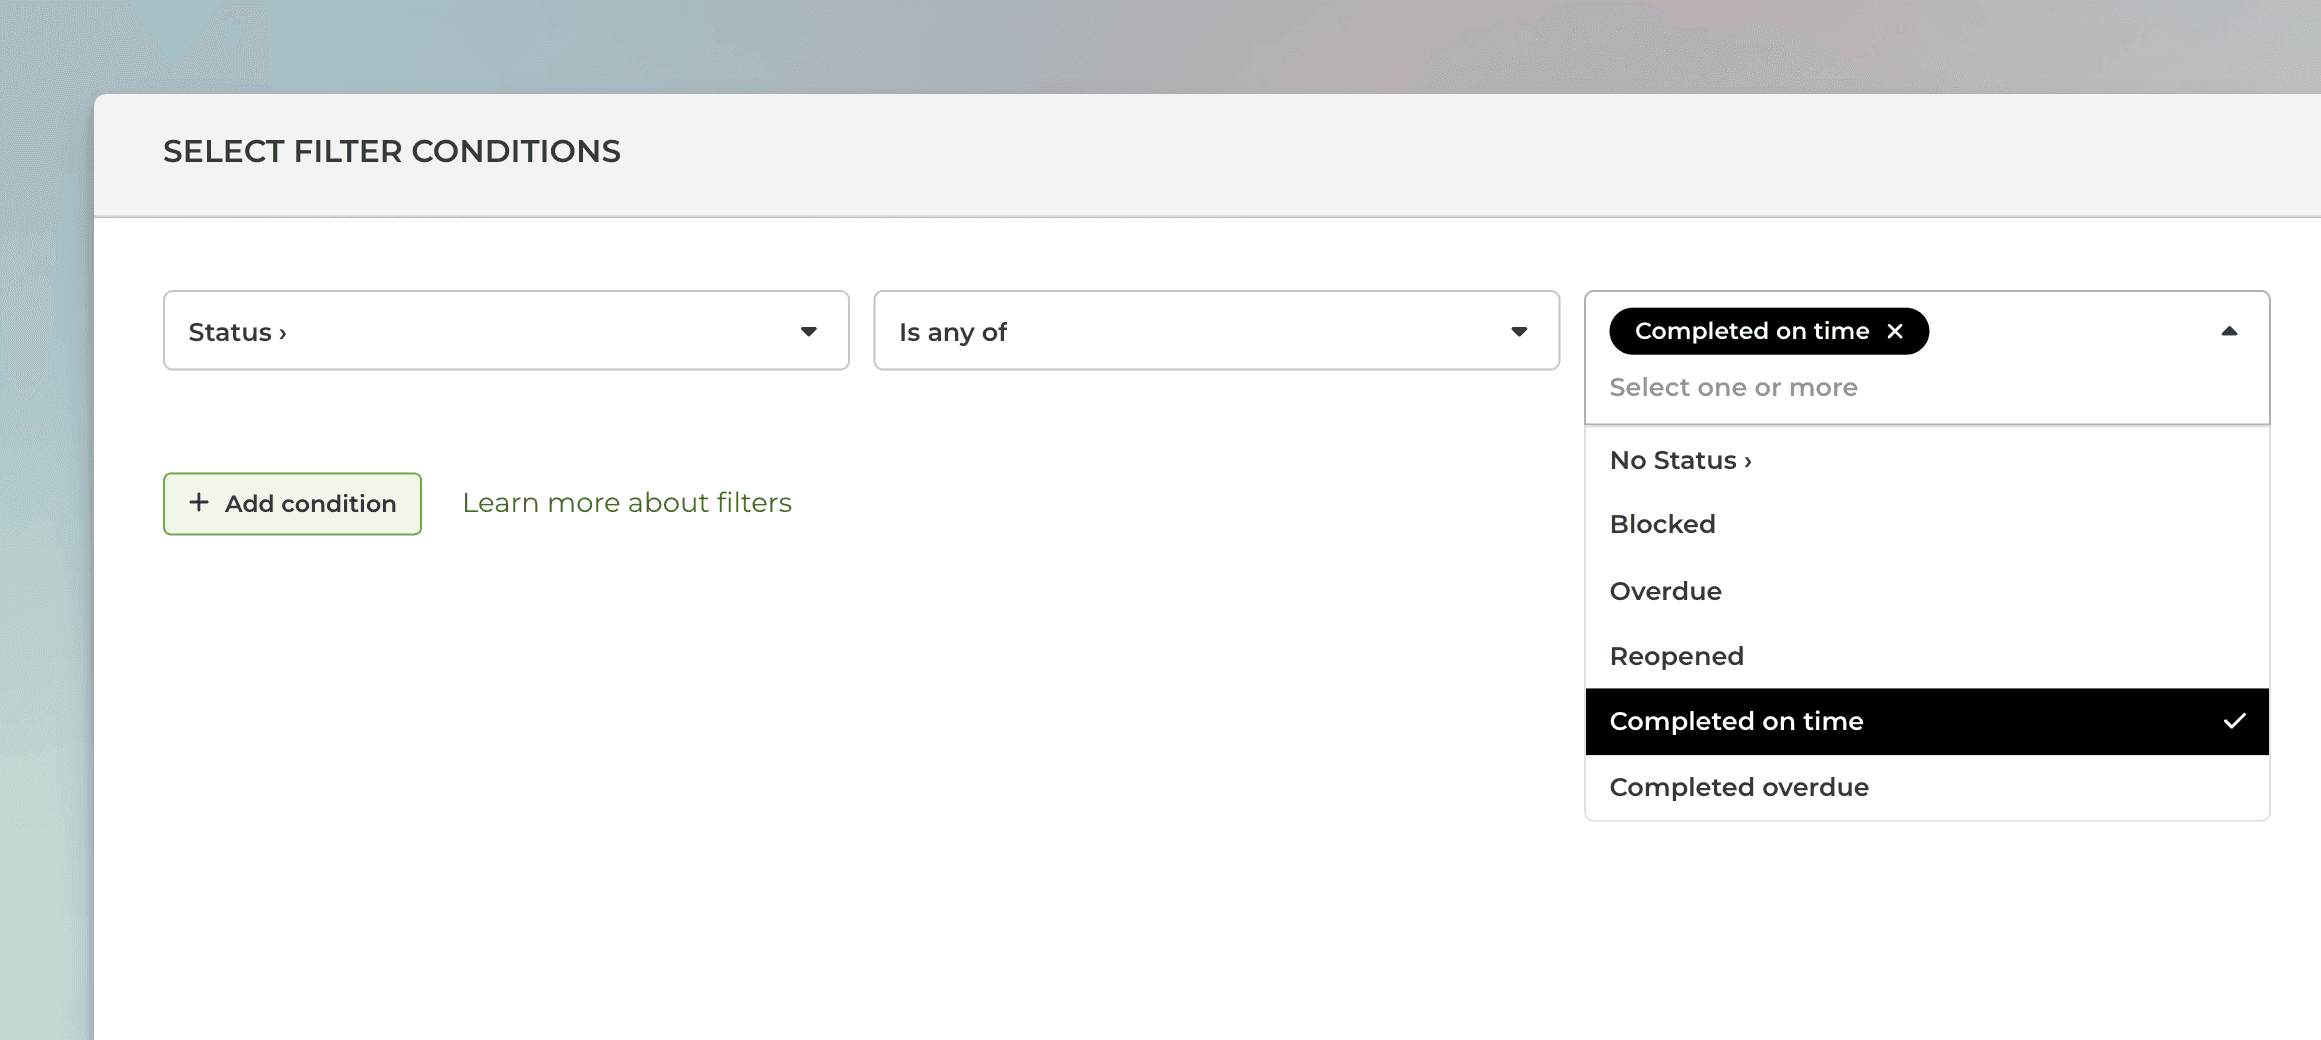
The resulting chart contains the items that have the due date set, and were completed before the due date. This filter is available in all charts.
Tracking work completed overdue
You can track work that was completed after the due date by setting a filter for Status> Completed overdue:
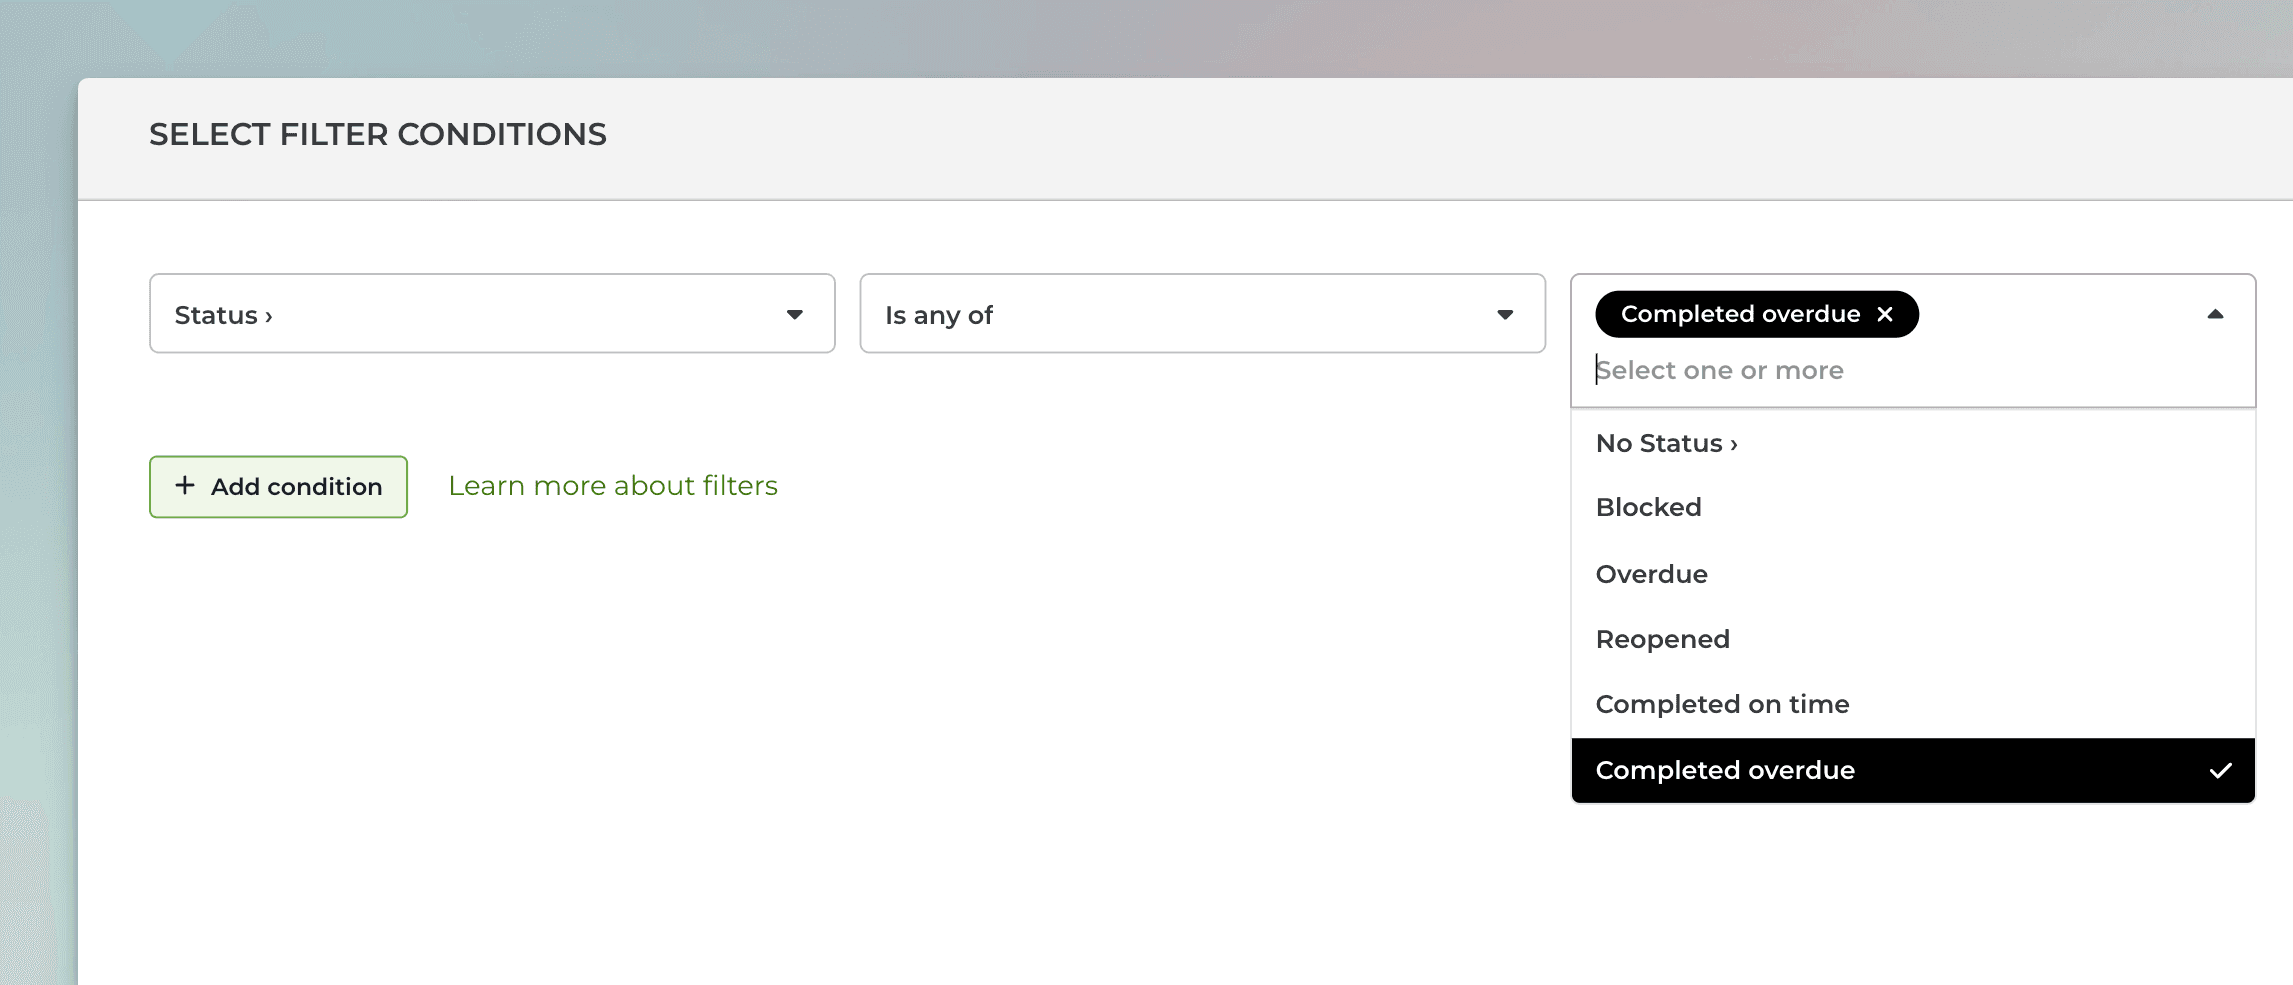
The resulting chart contains the items that have the due date set, and were completed after the due date.This filter is available in all charts.
Track the completed on time vs overdue trends
You can use the Line chart to track the trends of the number of tasks completed on time versus those that were completed overdue. You can do that by creating a line chart with two lines: one with the filter for completed on time, and another one with the filter for completed overtime.
Here's an example chart:
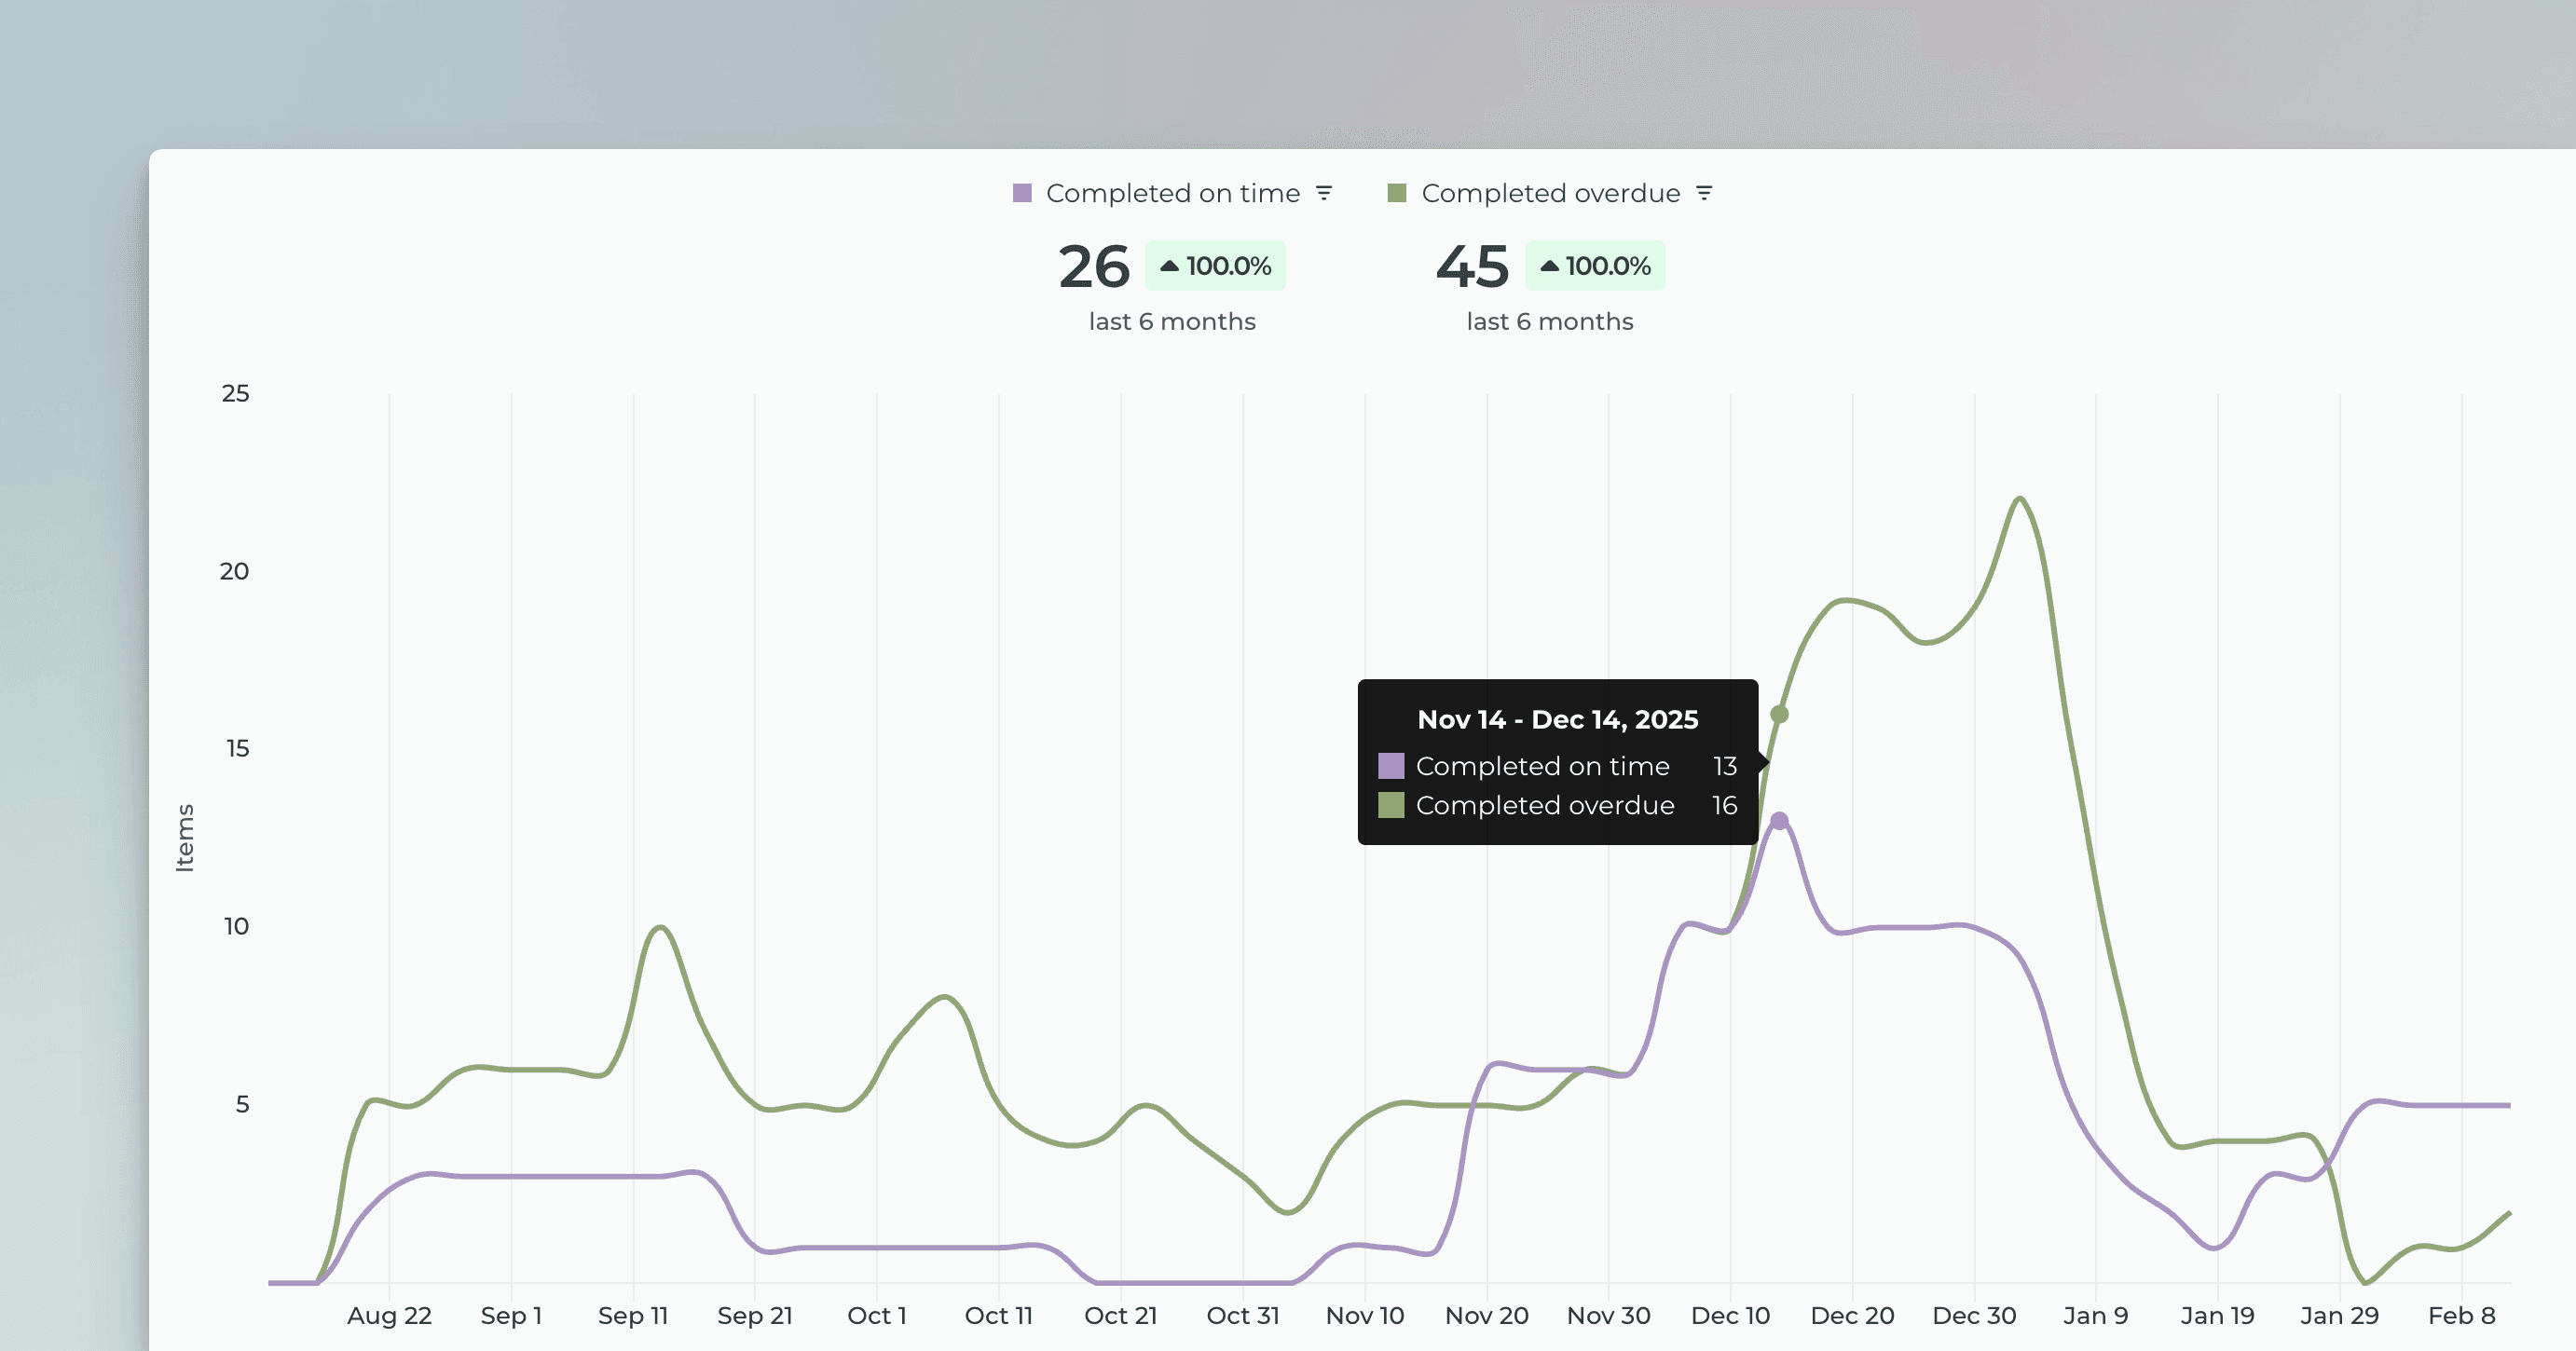
You can click through the lines to see the individual tasks behind the numbers at any point in history.
Track the completion ratio with percentages
The Table chart allows you to view data in rows and columns. It aggregates the task data into sums, averages, and other statistics. The table shows how much work was completed by assignee and the percentage of work completed on time vs overdue.
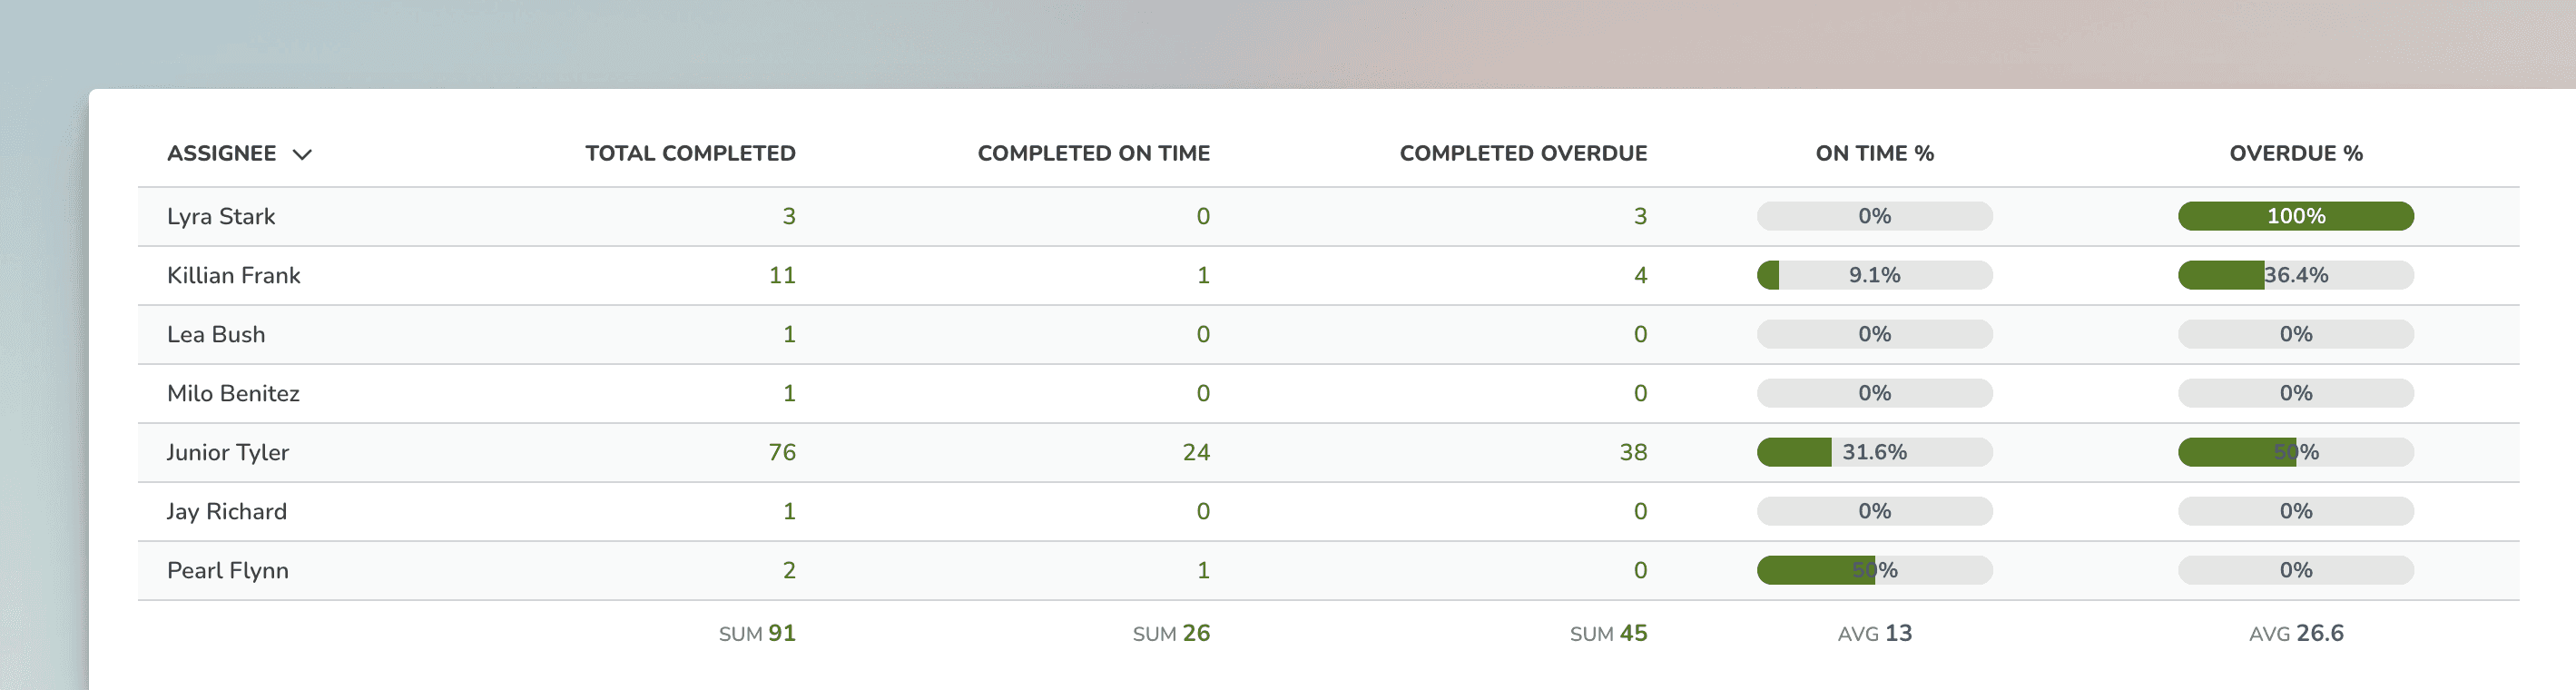
Columns are configurable, and you can set a separate filter for each column. You can also add calculated columns with custom formulas.
Create the Completed on time vs overdue report from a template
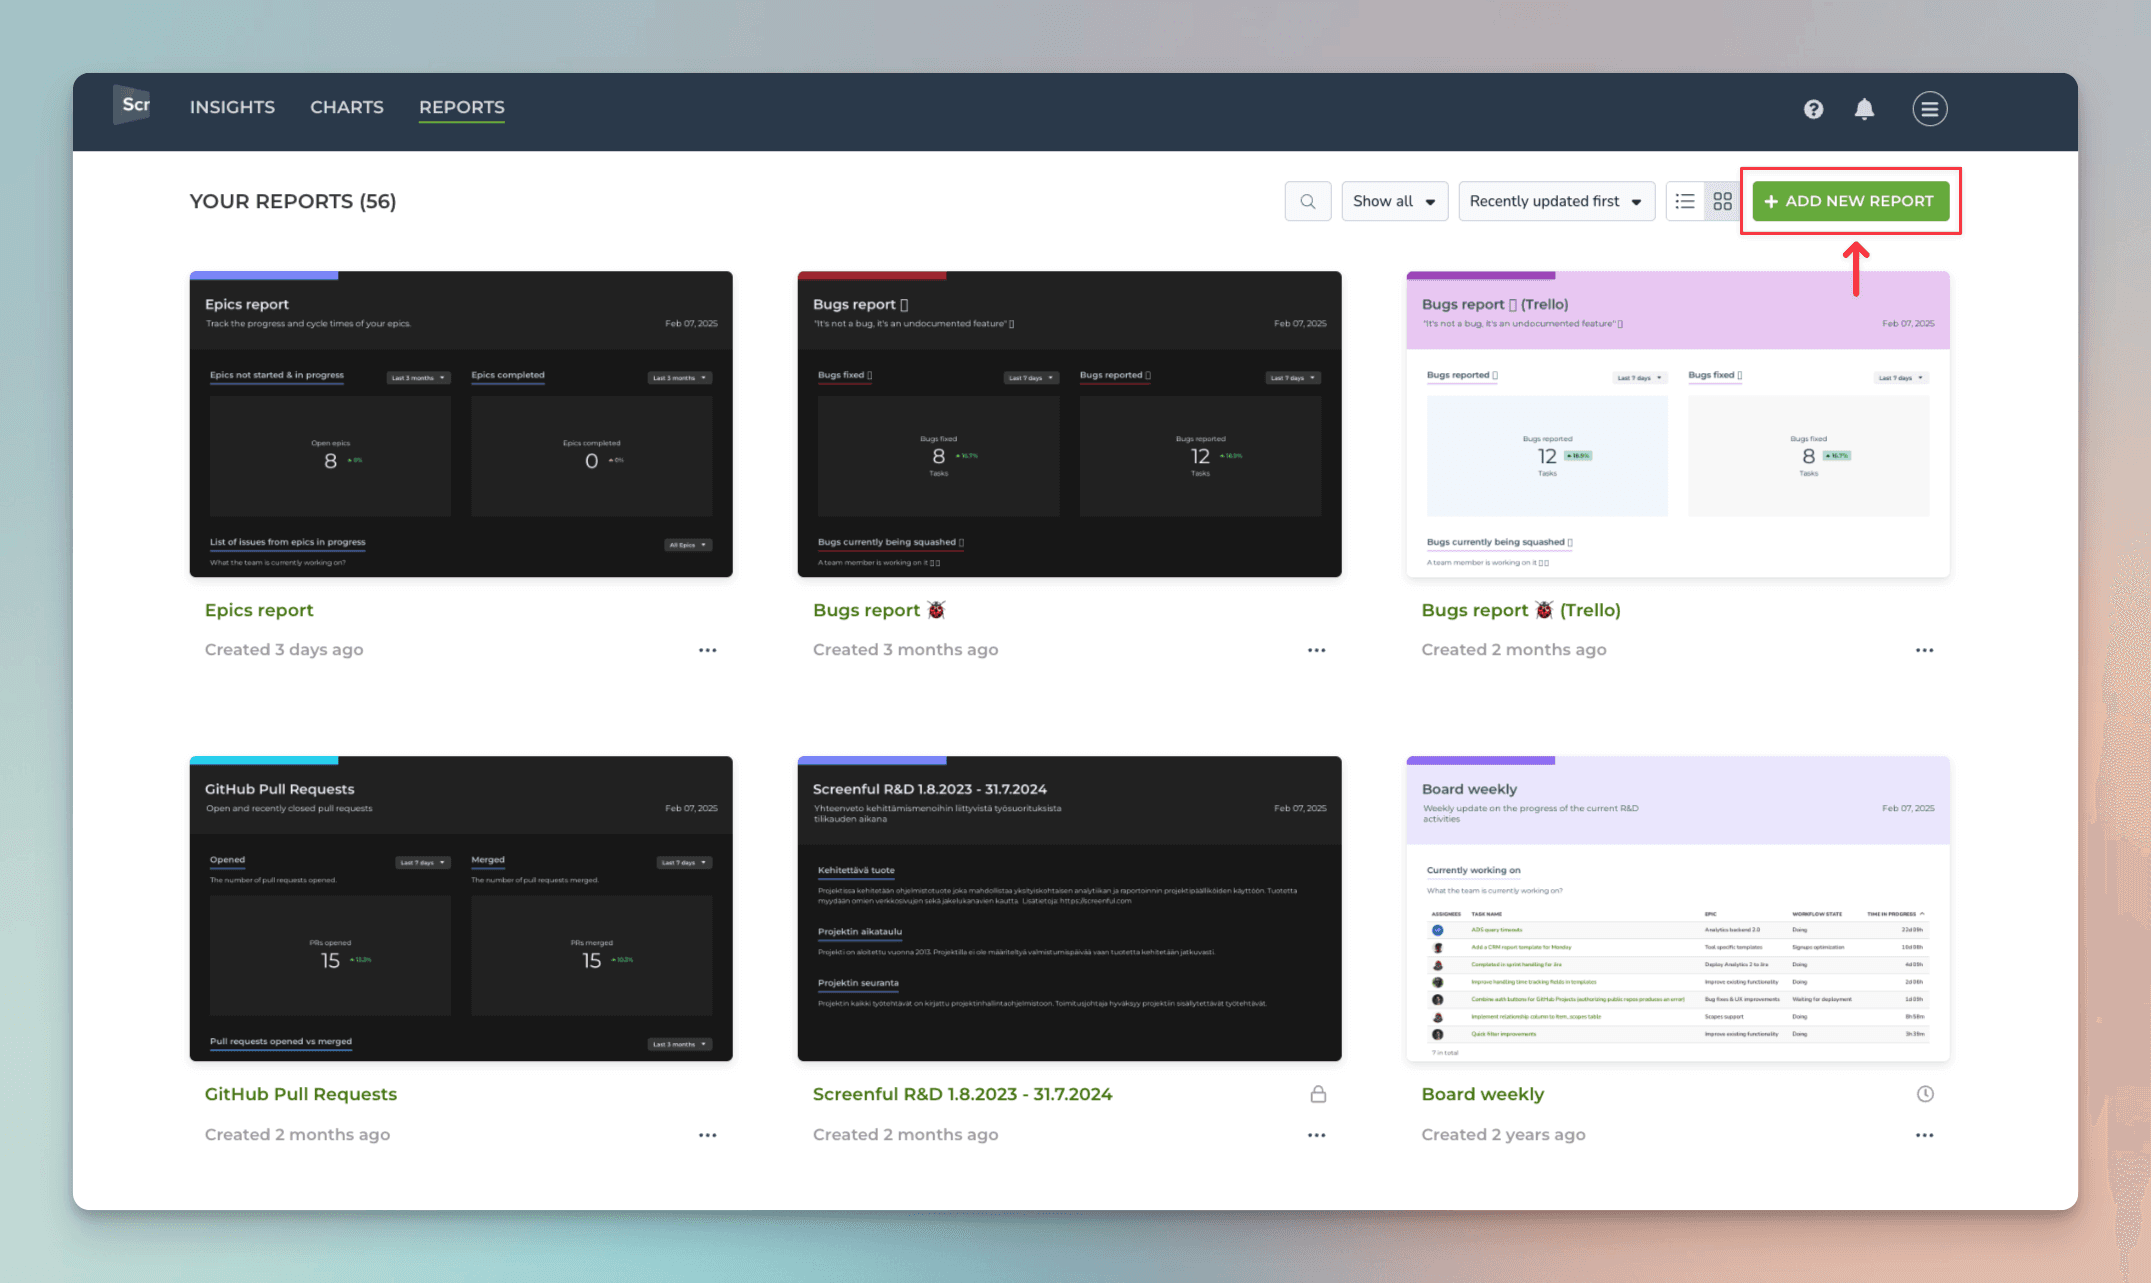
You can create Completed on time vs overdue report by using a report template. Go to the Reports tab and click Add new report on the top right corner:
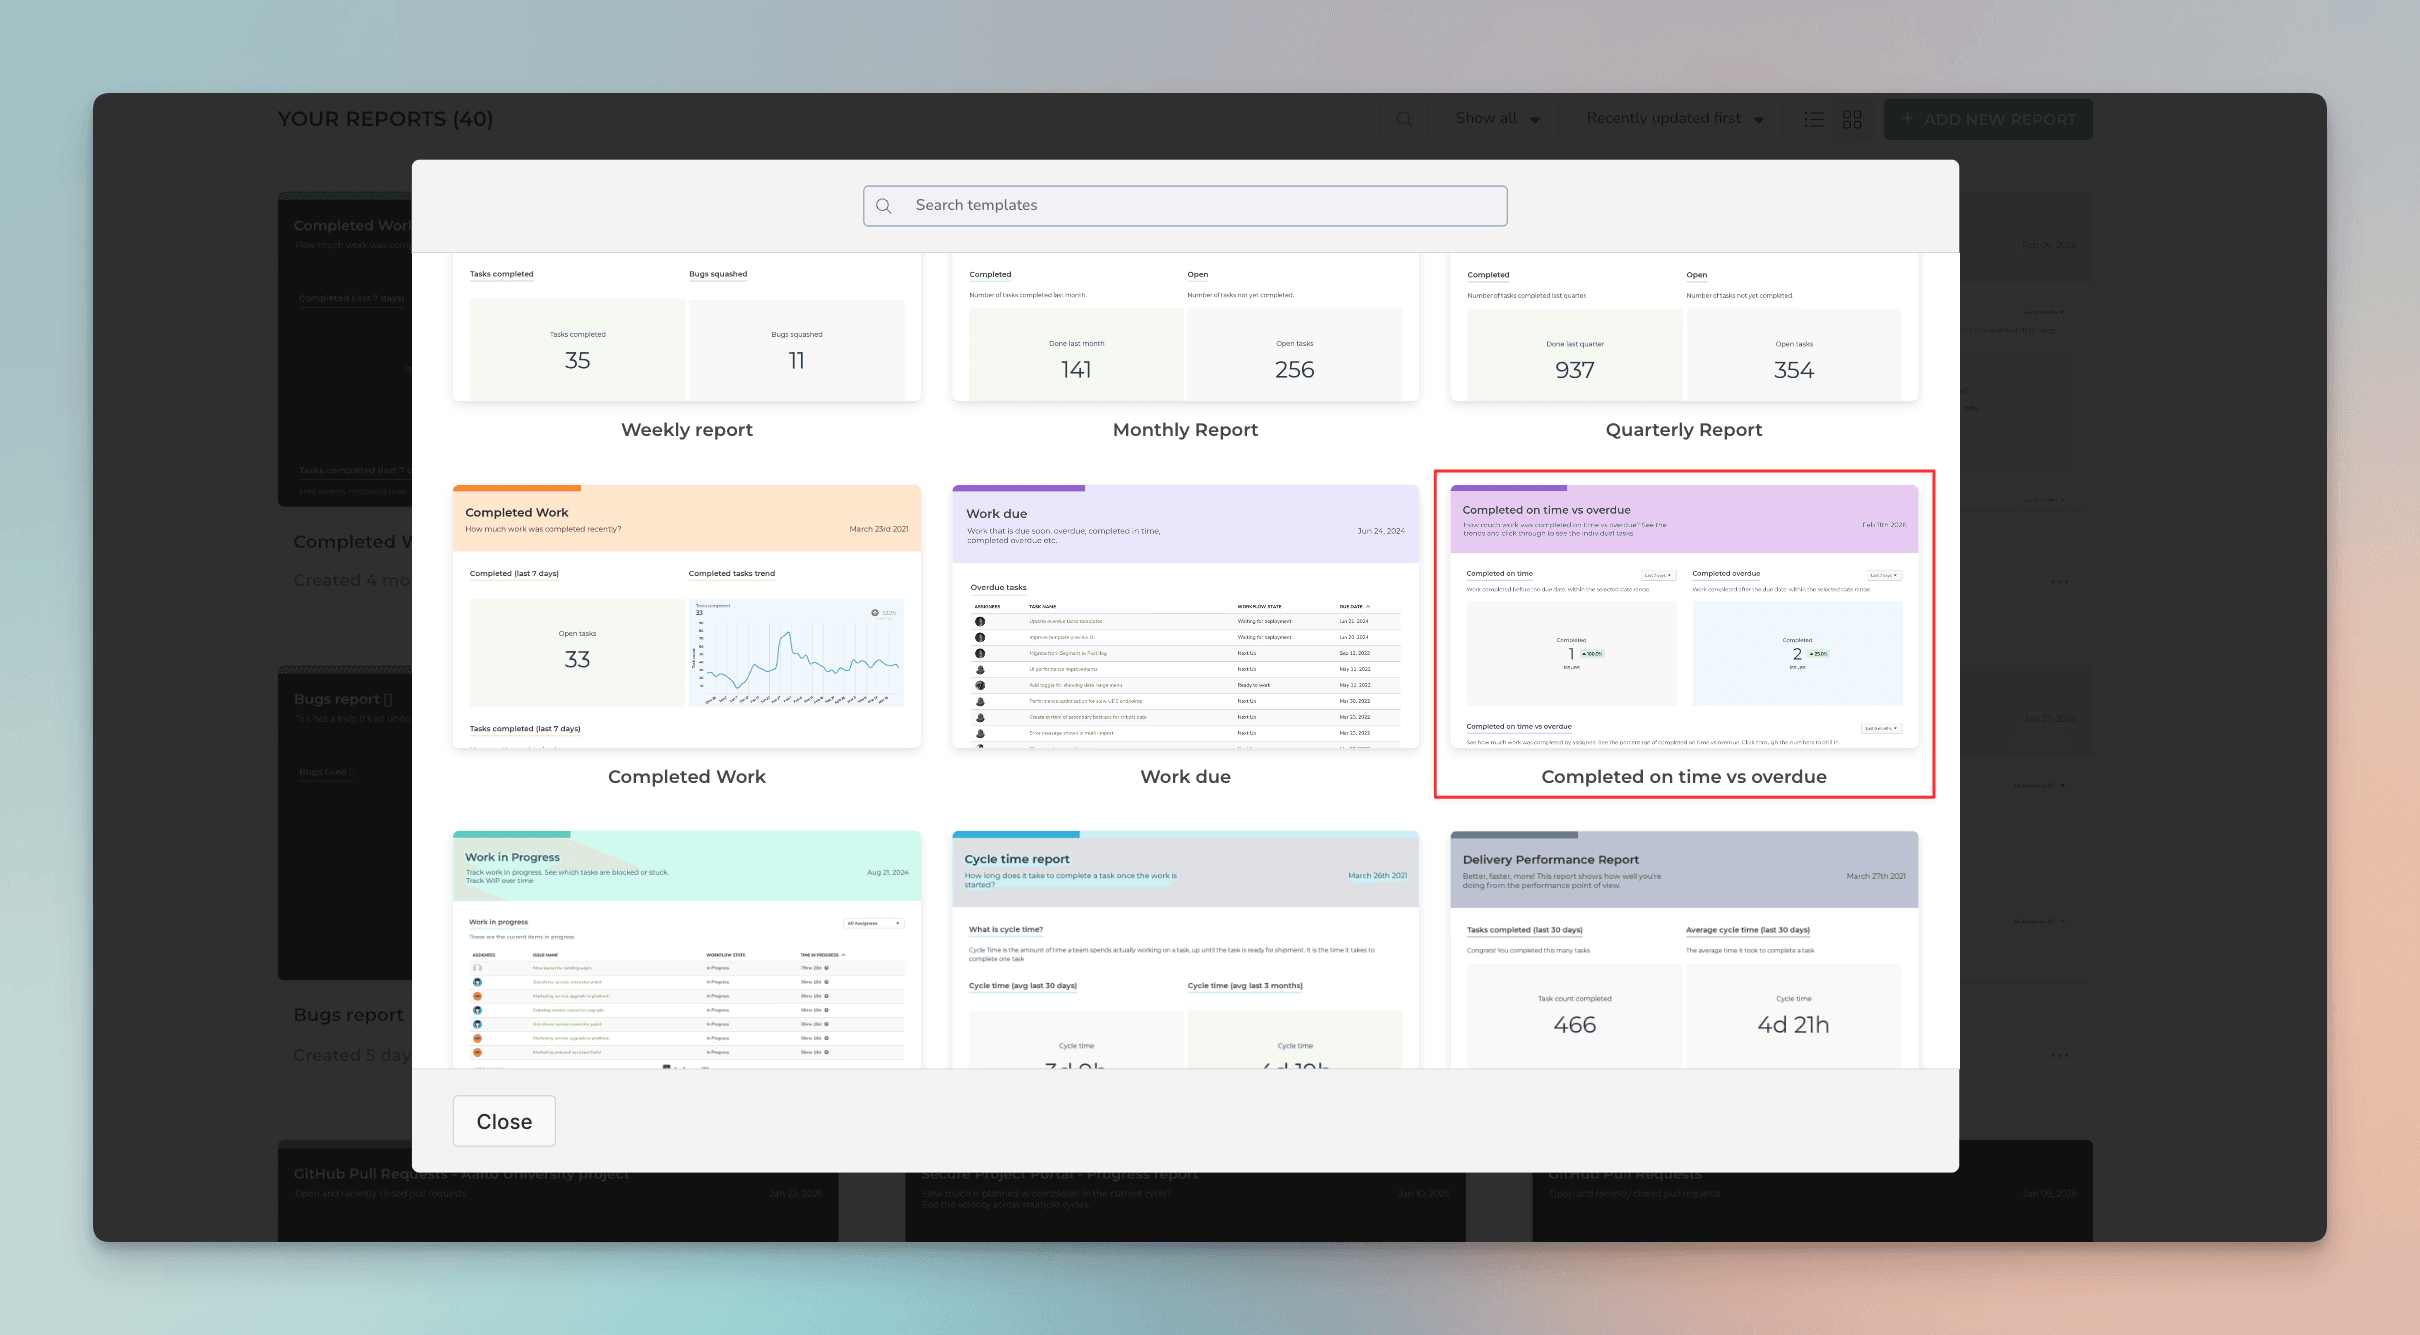
A modal opens, showing the available report templates. Select Completed on time vs overdue:
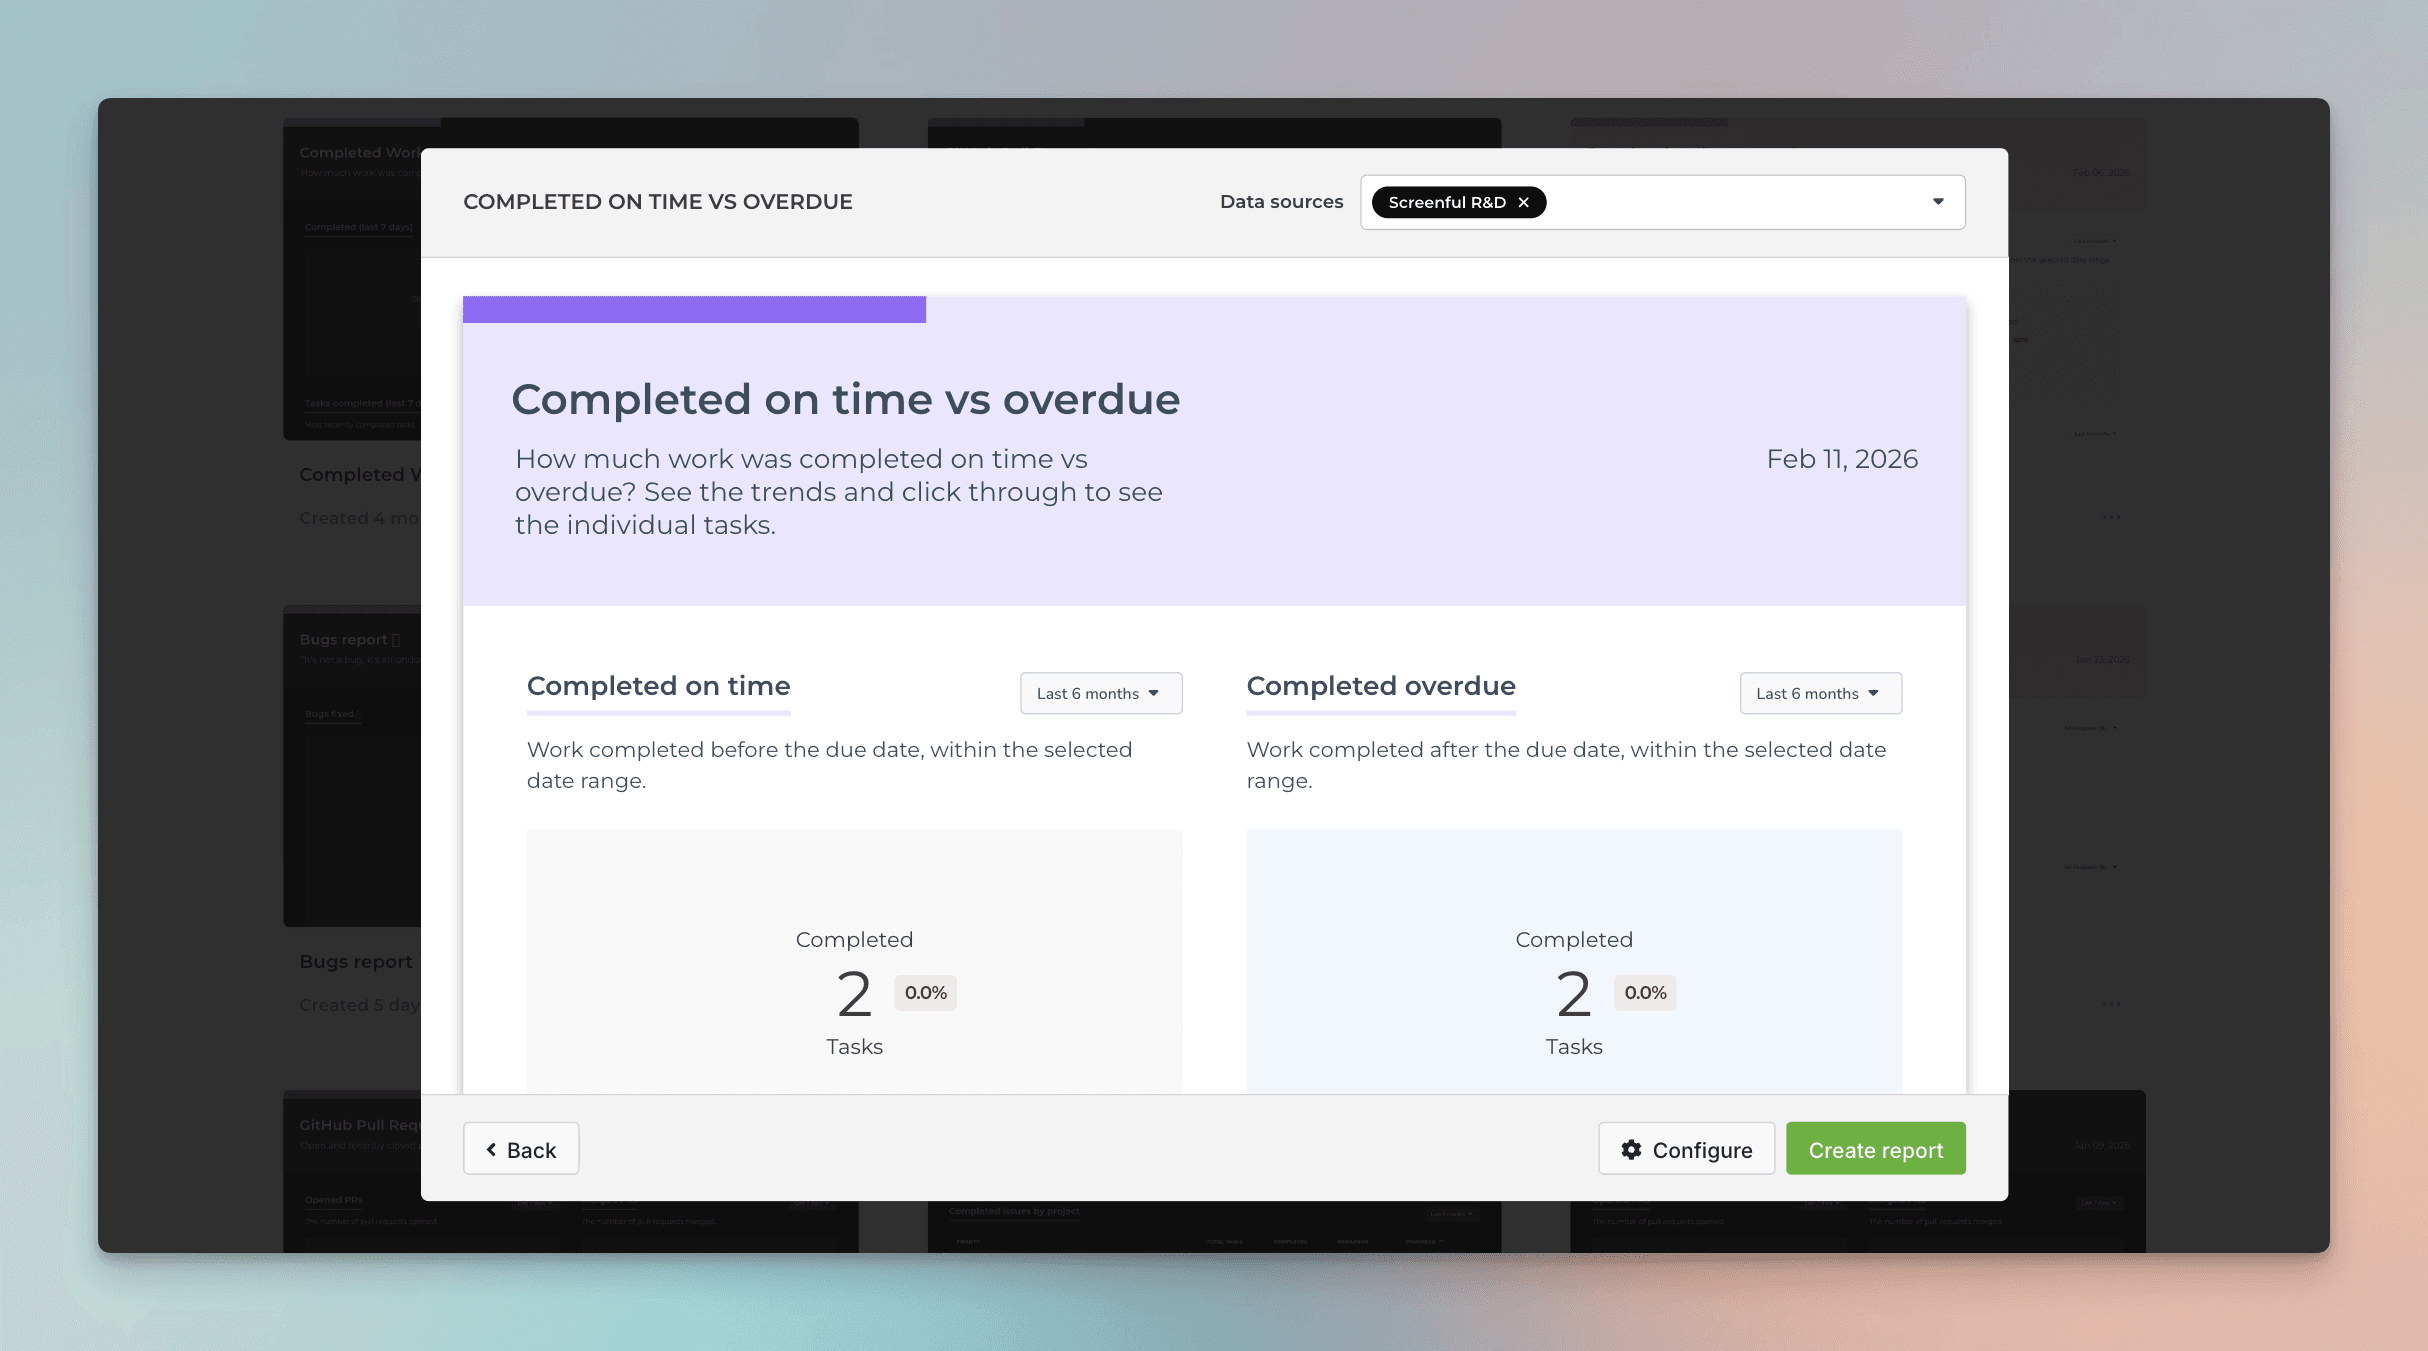
A report is generated with charts that allow you to track work completed on time and work completed past the due date.
You can customize the report and configure each chart using the drag-and-drop editor.
Once you have created the report, it appears under the Reports tab. From there, you can share it with a link or schedule to be sent via email or Slack.
Learn more
Book a free onboarding call
Need help with setting up your charts and reports? Don't find a metric you are looking for? Book a call with our expert. We'd love to help you supercharge your reporting!


