Get started with Screenful
Get started with Screenful

Step 1: Create a Screenful account or log in
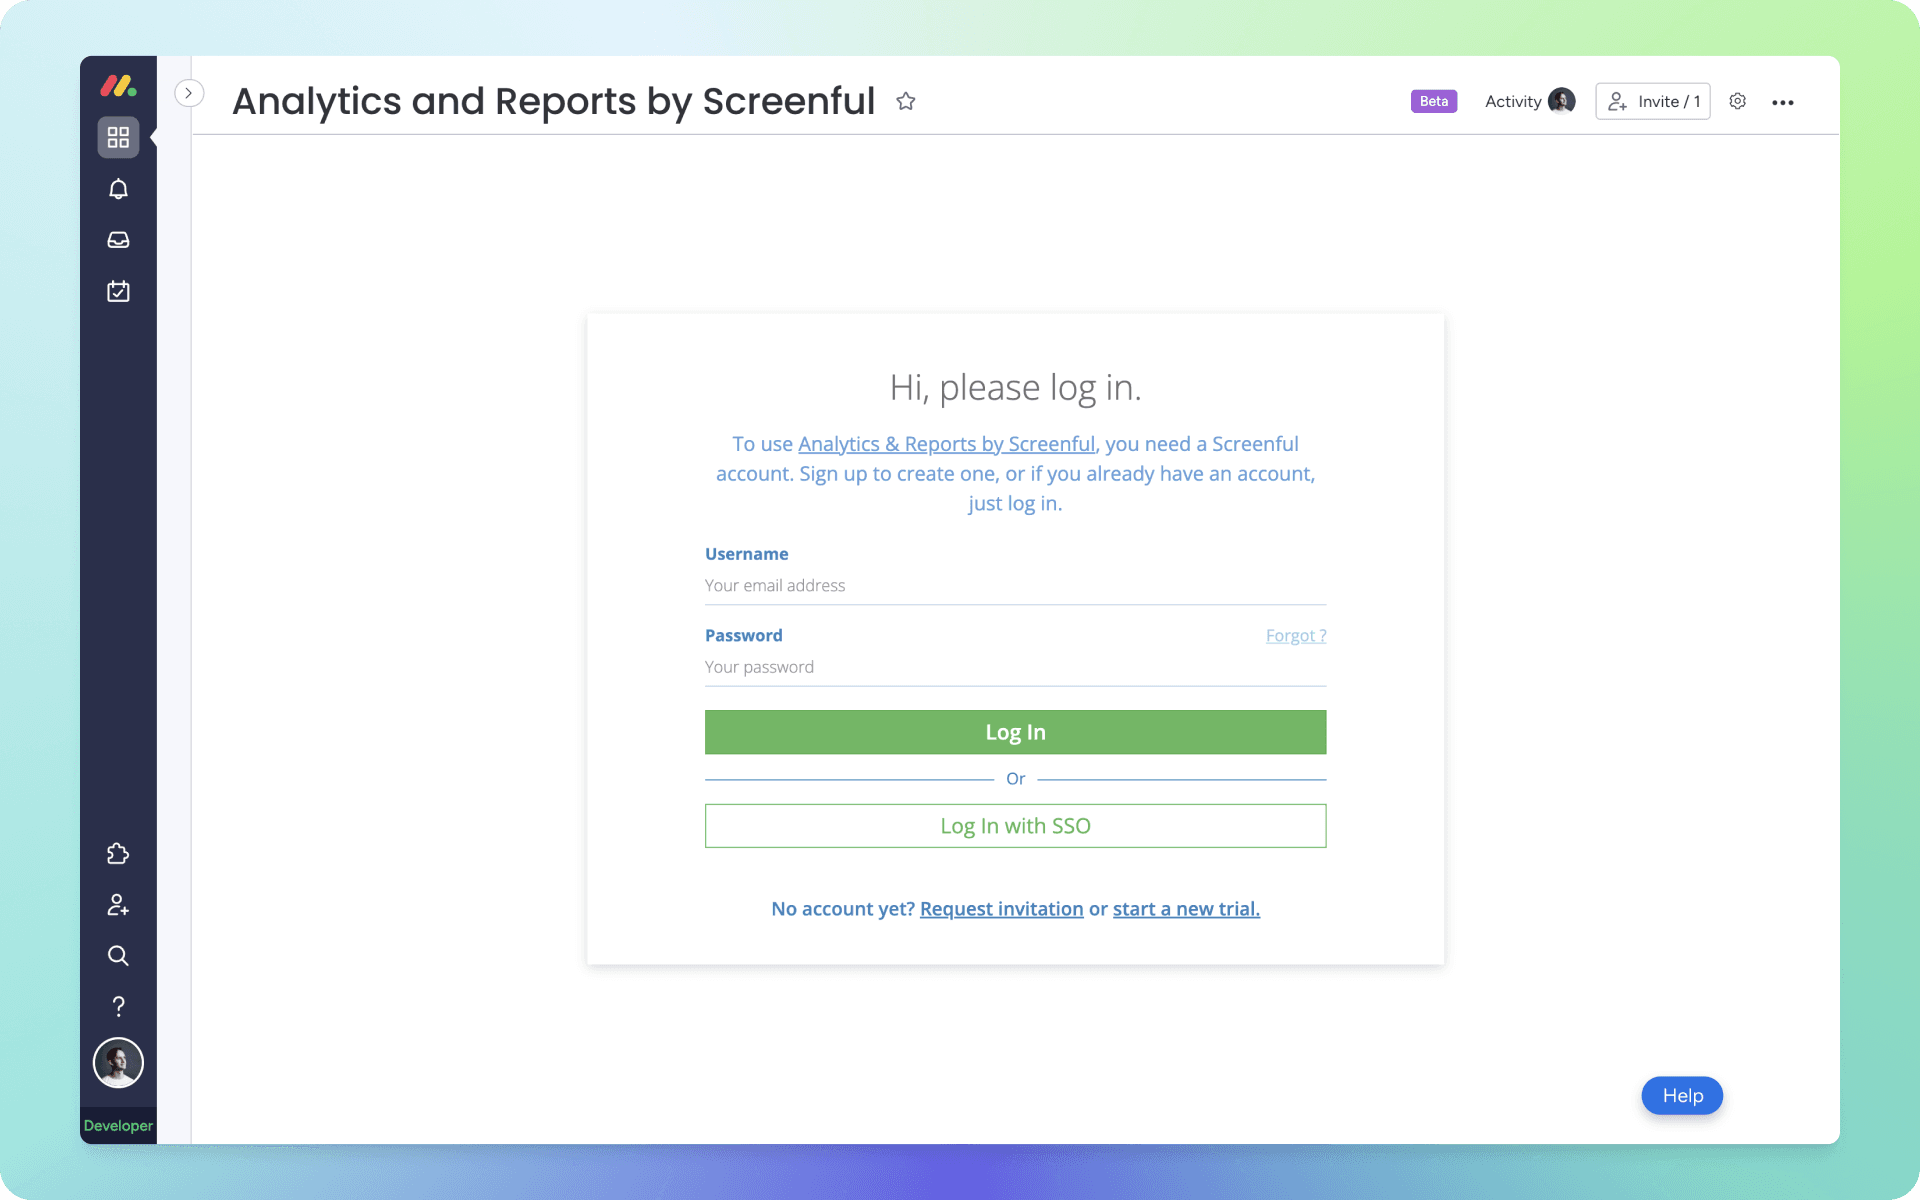
After you’ve installed Screenful, you can log in. If you do not have a Screenful account, you can sign up for a new trial, or request an invitation if your organization already has an account.
Step 2: Explore the Insights
Screenful's Insights feature provides a quick overview of different aspects of your data so that you can start exploring without having to configure any charts or reports. It is designed to give you the maximum value of Screenful out of the box.
The Insights tab contains four sections: Open work, Completed work, Timings, and Forecasting. Each chart comes with a summary text shown on the left, separately from the chart on the right. The summary describes the data shown in the chart. If you are unsure what some number or text in the chart means, check the summary section for more detail. Summaries also contain clickable links, which open a modal displaying a list of tasks, revealing the data behind the numbers.

This is a great way to explore the data, as you can see the big picture in the chart, understand what the chart represents by reading the summary, and then click through to see the individual items behind the numbers.
Both the settings and the filters in the Insights tab are personal to you only. By default, the data is pulled from all of your data sources, and you can narrow it down by excluding certain data sources or applying filters to all insights.
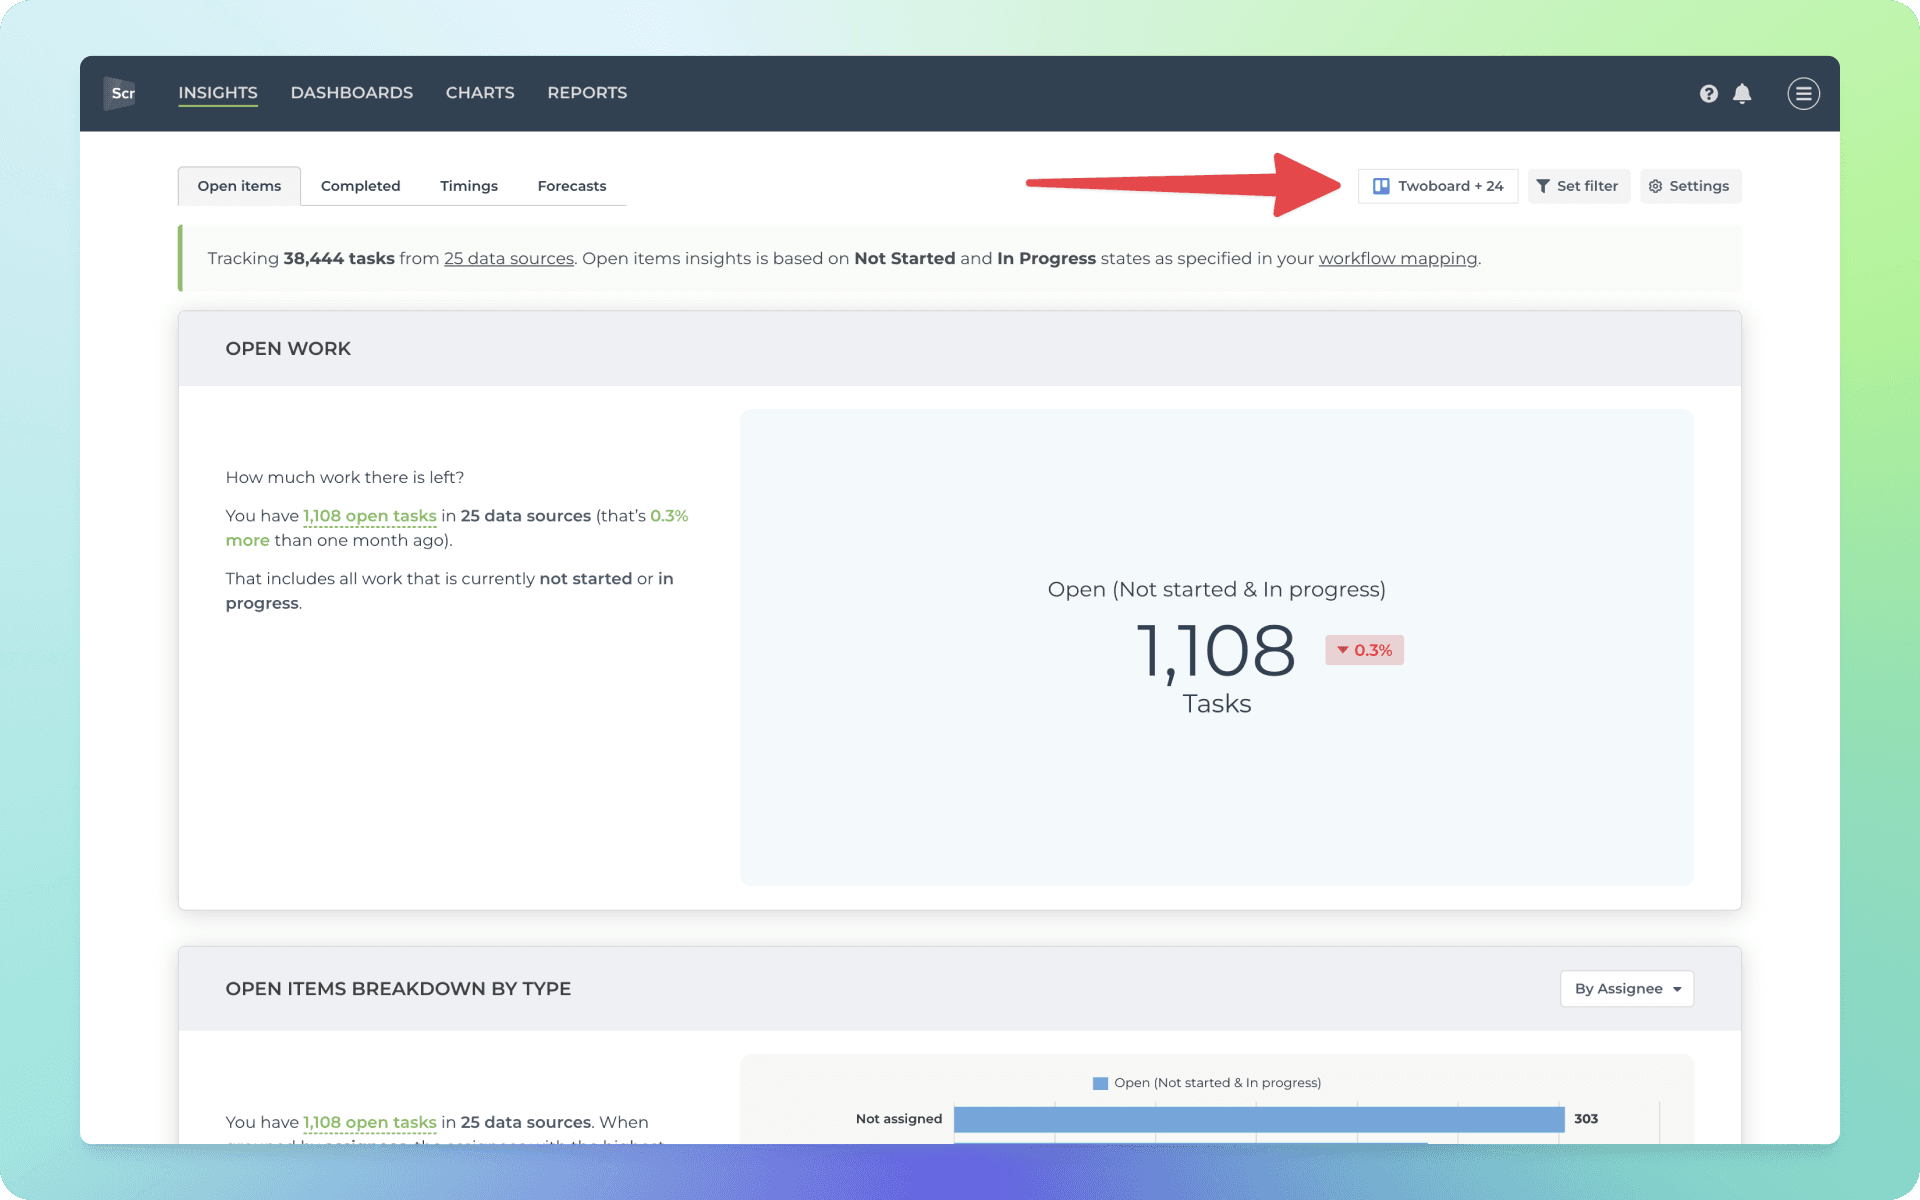
Whatever you change here won't affect what others see. With the Insights tab, you can easily access key charts and metrics for your own consumption.
Step 3: Create your first custom chart
To create a custom chart
Navigate to the Charts tab
Click Add new chart on the top right corner
A modal is opened with a set of chart templates. You can either create a new chart from scratch or pick one of the predefined charts.
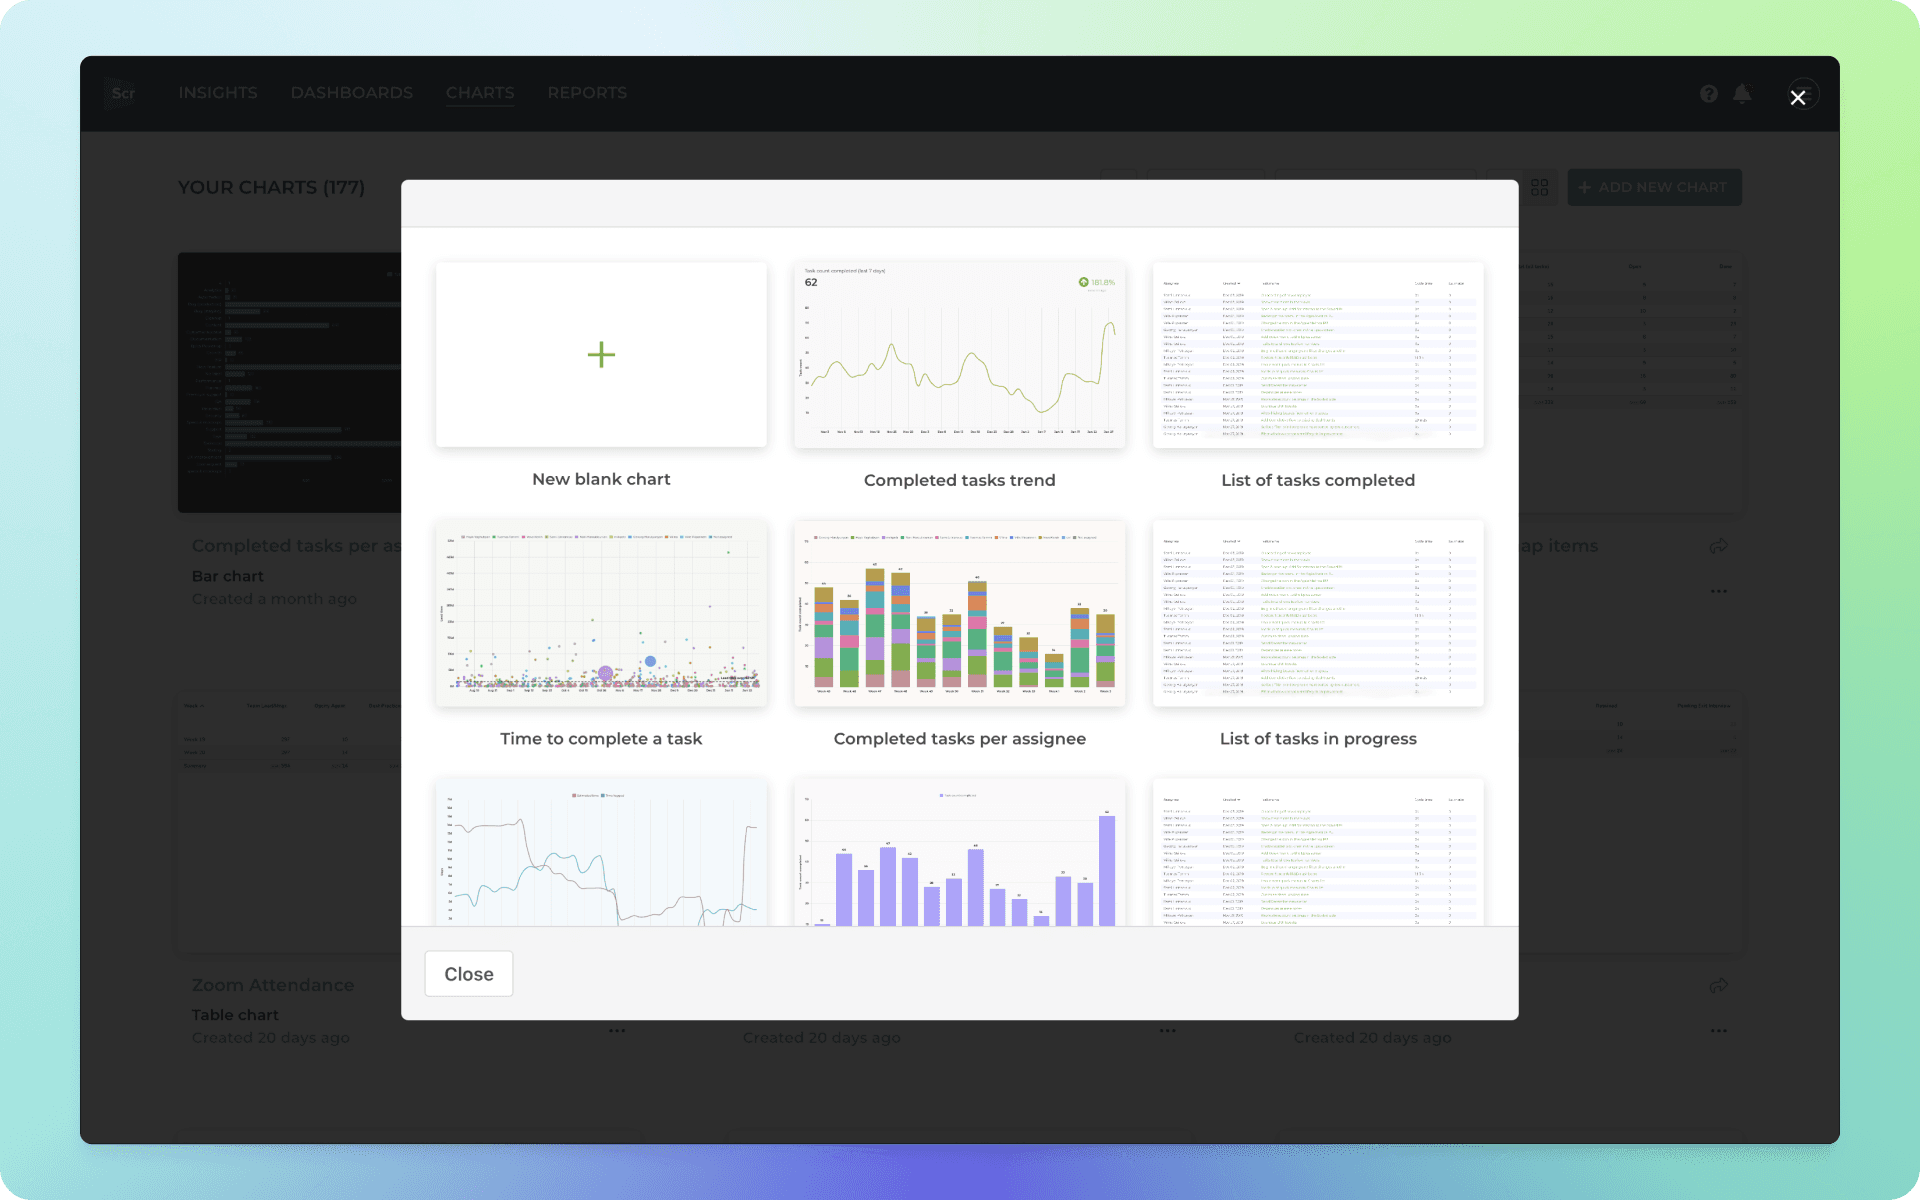
Clicking one of chart templates opens a preview with real data. You can select the data sources from the Data source menu above the chart. You can pick one or more data sources for your chart and see the results immediately.
After picking a template, you can click the Configure icon on the top right corner to open the chart for editing.
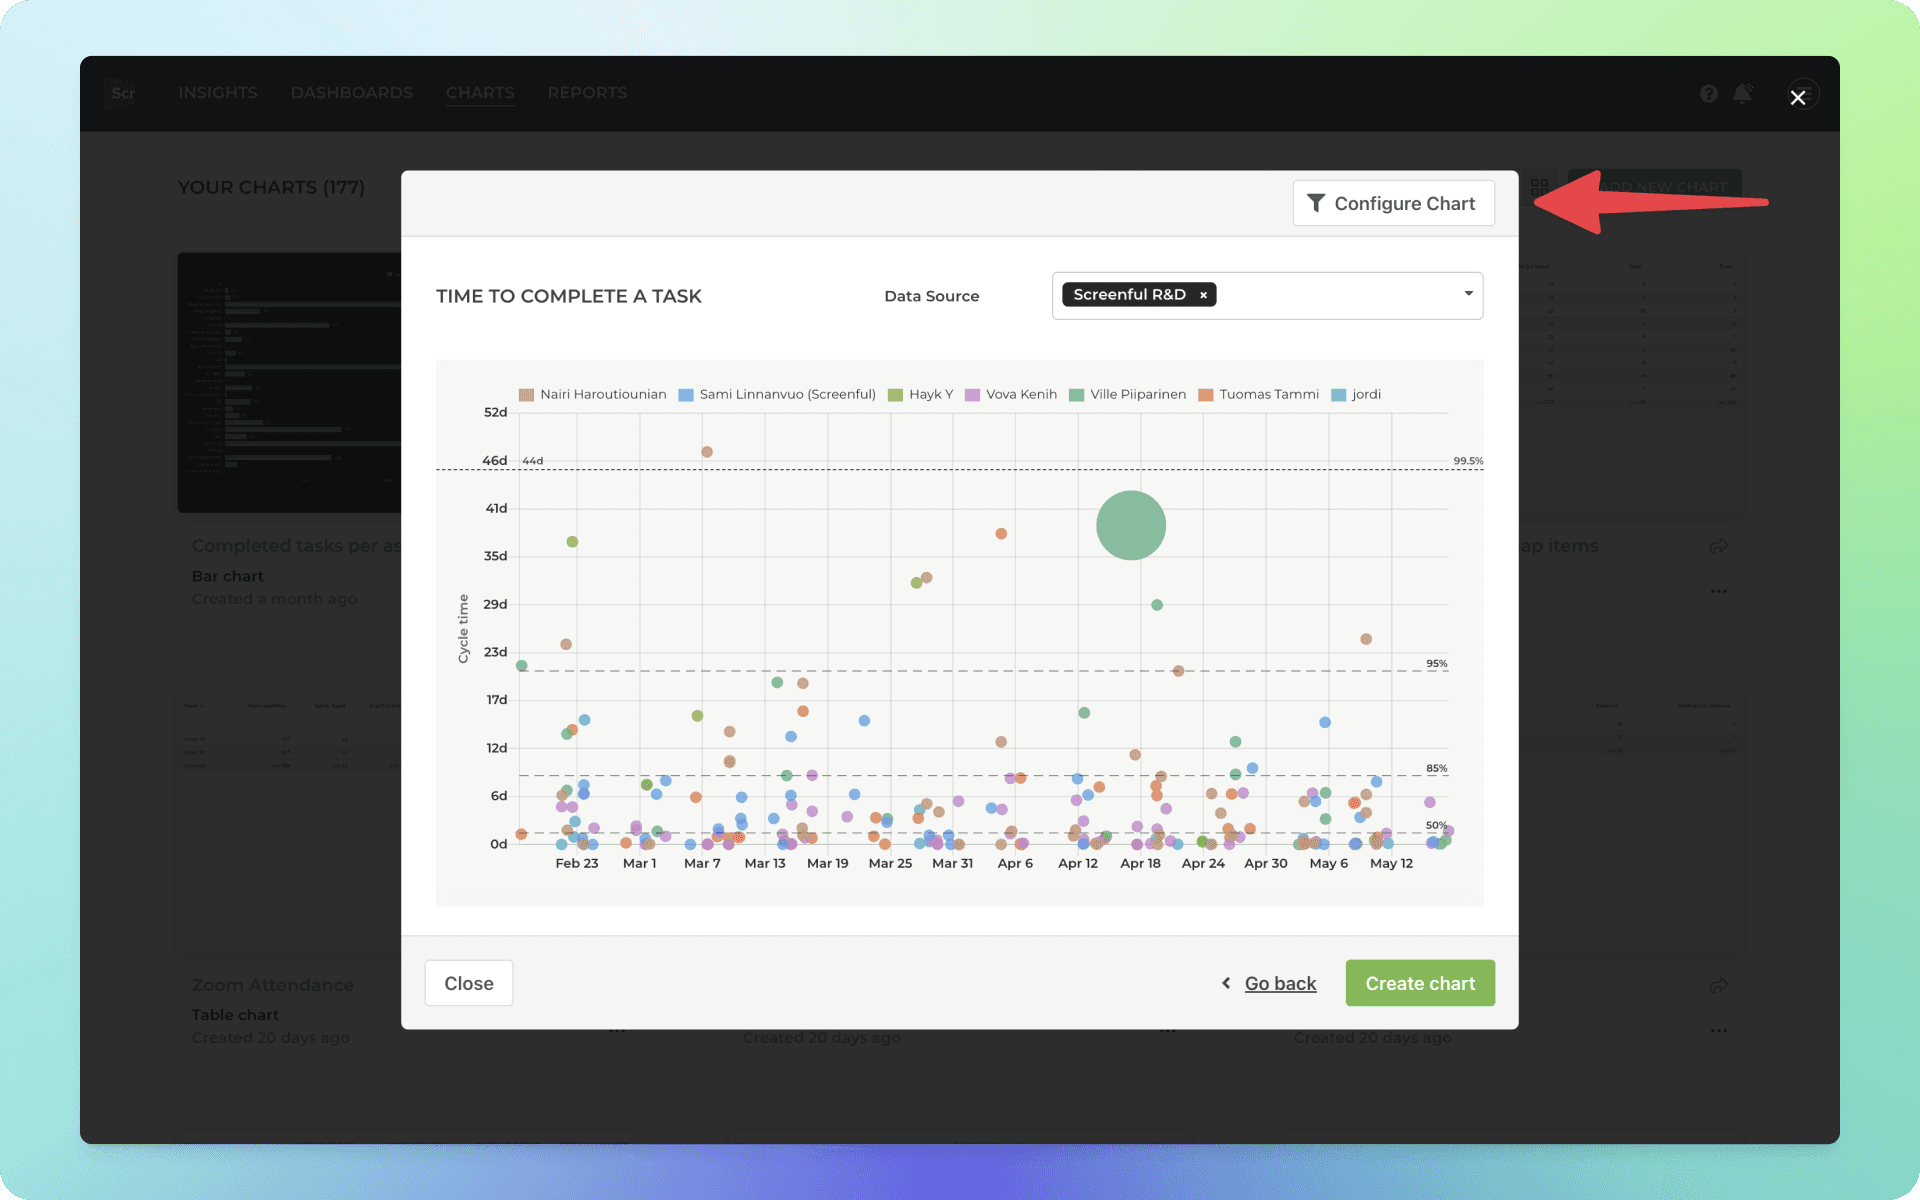
The chart editor opens revealing the chart settings. If the chart is anywhere close to what you’re looking for, you should be able to make it perfect with just a few adjustments.
When you click Create chart, the chart is created and you can find it under the Charts tab under the main navigation.
Now you can assign it to a report, or share it with others using the share links.
Step 4: Invite your team
With Screenful, you can invite an unlimited number of users for free. To invite new users, go to Account Settings in the main menu and open the Manage Users tab. There, you will see a list of users and their roles.
Click Invite a user on the bottom left to invite a new user. Enter the email address to send an invitation email. There are two different user roles available:
Admin - Can change settings, manage users and plans & billing
Member - Can change settings and invite new users
Observer - Can only view data, and cannot change any settings
The invited user will receive an invitation email.
Before the user has completed registration, the Pending status is shown for that user.
You can resend the invitation by clicking Re-send invitation in the user details at Account Settings ► Manage users ► [User name]
Admins can also click a username to edit details or to change their password.

Step 1: Create a Screenful account or log in
After you’ve installed Screenful, you can log in. If you do not have a Screenful account, you can sign up for a new trial, or request an invitation if your organization already has an account.

Step 2: Explore the Insights
Screenful's Insights feature provides a quick overview of different aspects of your data so that you can start exploring without having to configure any charts or reports. It is designed to give you the maximum value of Screenful out of the box.
The Insights tab contains four sections: Open work, Completed work, Timings, and Forecasting. Each chart comes with a summary text shown on the left, separately from the chart on the right. The summary describes the data shown in the chart. If you are unsure what some number or text in the chart means, check the summary section for more detail. Summaries also contain clickable links, which open a modal displaying a list of tasks, revealing the data behind the numbers.

This is a great way to explore the data, as you can see the big picture in the chart, understand what the chart represents by reading the summary, and then click through to see the individual items behind the numbers.
Both the settings and the filters in the Insights tab are personal to you only. By default, the data is pulled from all of your data sources, and you can narrow it down by excluding certain data sources or applying filters to all insights.

Whatever you change here won't affect what others see. With the Insights tab, you can easily access key charts and metrics for your own consumption.
Step 3: Create your first custom chart
To create a custom chart
Navigate to the Charts tab
Click Add new chart on the top right corner
A modal is opened with a set of chart templates. You can either create a new chart from scratch or pick one of the predefined charts.

Clicking one of chart templates opens a preview with real data. You can select the data sources from the Data source menu above the chart. You can pick one or more data sources for your chart and see the results immediately.
After picking a template, you can click the Configure icon on the top right corner to open the chart for editing.

The chart editor opens revealing the chart settings. If the chart is anywhere close to what you’re looking for, you should be able to make it perfect with just a few adjustments.
When you click Create chart, the chart is created and you can find it under the Charts tab under the main navigation.
Now you can assign it to a report, or share it with others using the share links.
Step 4: Invite your team
With Screenful, you can invite an unlimited number of users for free. To invite new users, go to Account Settings in the main menu and open the Manage Users tab. There, you will see a list of users and their roles.
Click Invite a user on the bottom left to invite a new user. Enter the email address to send an invitation email. There are two different user roles available:
Admin - Can change settings, manage users and plans & billing
Member - Can change settings and invite new users
Observer - Can only view data, and cannot change any settings
The invited user will receive an invitation email.
Before the user has completed registration, the Pending status is shown for that user.
You can resend the invitation by clicking Re-send invitation in the user details at Account Settings ► Manage users ► [User name]
Admins can also click a username to edit details or to change their password.

Step 1: Create a Screenful account or log in
After you’ve installed Screenful, you can log in. If you do not have a Screenful account, you can sign up for a new trial, or request an invitation if your organization already has an account.

Step 2: Explore the Insights
Screenful's Insights feature provides a quick overview of different aspects of your data so that you can start exploring without having to configure any charts or reports. It is designed to give you the maximum value of Screenful out of the box.
The Insights tab contains four sections: Open work, Completed work, Timings, and Forecasting. Each chart comes with a summary text shown on the left, separately from the chart on the right. The summary describes the data shown in the chart. If you are unsure what some number or text in the chart means, check the summary section for more detail. Summaries also contain clickable links, which open a modal displaying a list of tasks, revealing the data behind the numbers.

This is a great way to explore the data, as you can see the big picture in the chart, understand what the chart represents by reading the summary, and then click through to see the individual items behind the numbers.
Both the settings and the filters in the Insights tab are personal to you only. By default, the data is pulled from all of your data sources, and you can narrow it down by excluding certain data sources or applying filters to all insights.

Whatever you change here won't affect what others see. With the Insights tab, you can easily access key charts and metrics for your own consumption.
Step 3: Create your first custom chart
To create a custom chart
Navigate to the Charts tab
Click Add new chart on the top right corner
A modal is opened with a set of chart templates. You can either create a new chart from scratch or pick one of the predefined charts.

Clicking one of chart templates opens a preview with real data. You can select the data sources from the Data source menu above the chart. You can pick one or more data sources for your chart and see the results immediately.
After picking a template, you can click the Configure icon on the top right corner to open the chart for editing.

The chart editor opens revealing the chart settings. If the chart is anywhere close to what you’re looking for, you should be able to make it perfect with just a few adjustments.
When you click Create chart, the chart is created and you can find it under the Charts tab under the main navigation.
Now you can assign it to a report, or share it with others using the share links.
Step 4: Invite your team
With Screenful, you can invite an unlimited number of users for free. To invite new users, go to Account Settings in the main menu and open the Manage Users tab. There, you will see a list of users and their roles.
Click Invite a user on the bottom left to invite a new user. Enter the email address to send an invitation email. There are two different user roles available:
Admin - Can change settings, manage users and plans & billing
Member - Can change settings and invite new users
Observer - Can only view data, and cannot change any settings
The invited user will receive an invitation email.
Before the user has completed registration, the Pending status is shown for that user.
You can resend the invitation by clicking Re-send invitation in the user details at Account Settings ► Manage users ► [User name]
Admins can also click a username to edit details or to change their password.