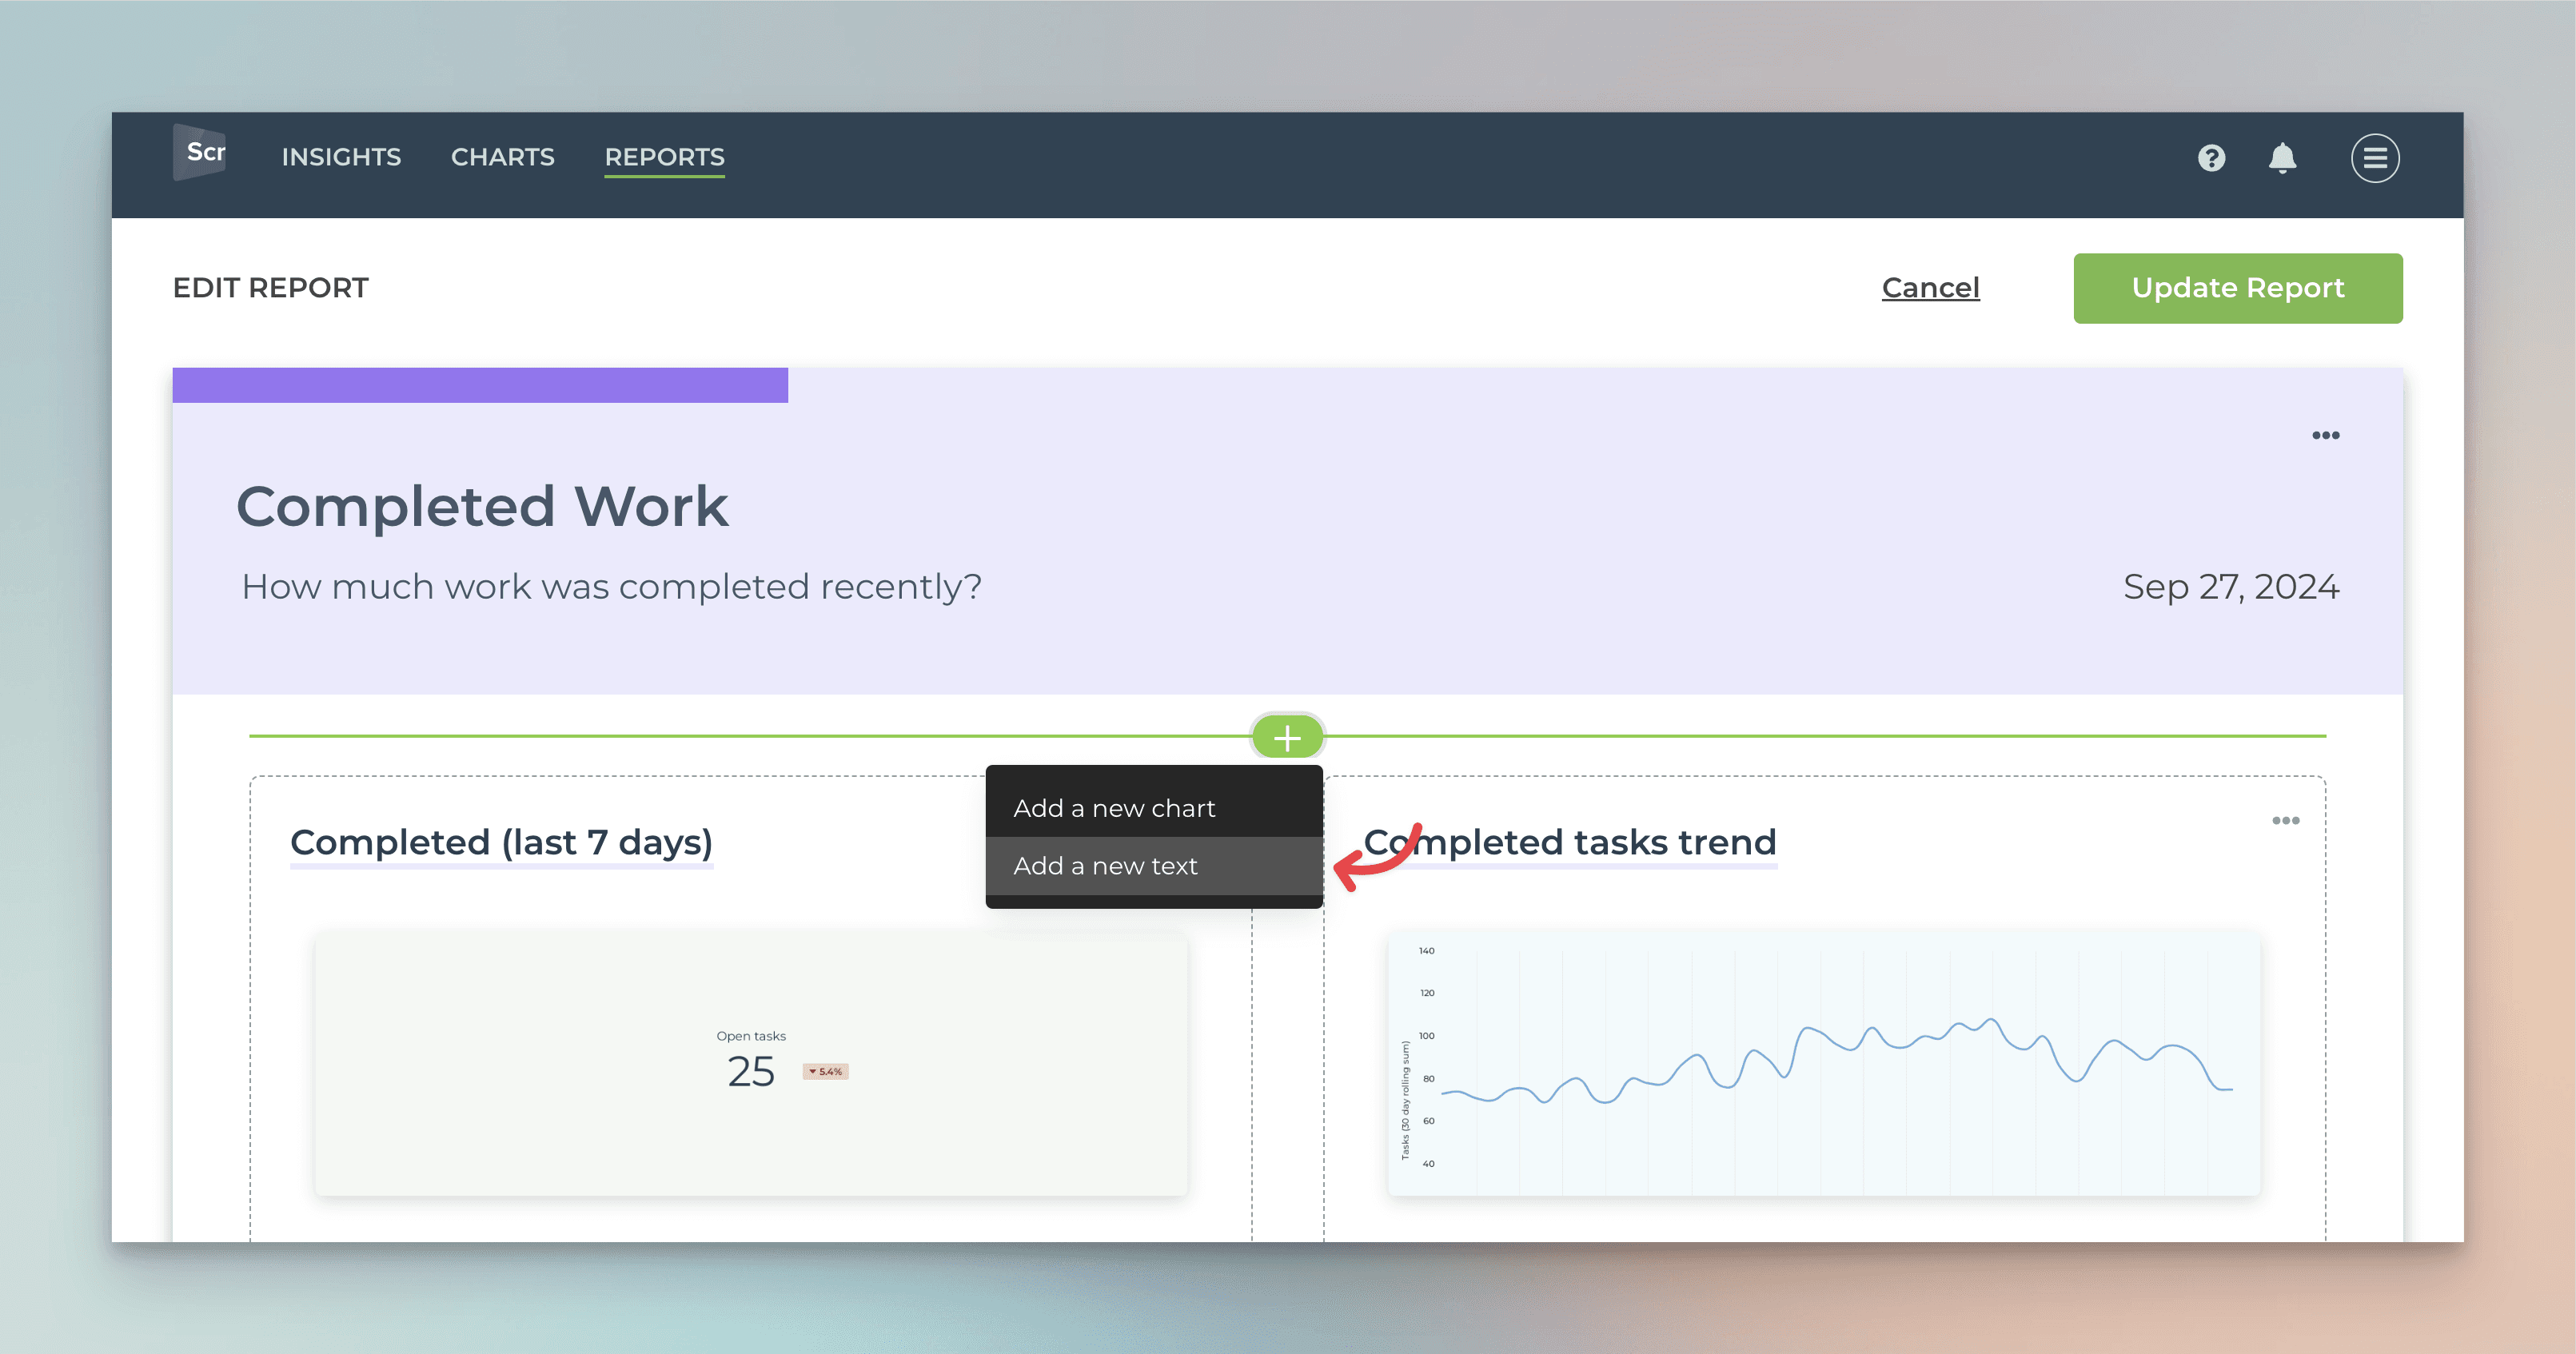
To add a chart to a report, select Edit report from the report context menu to open it for editing. In the report editor, hover the mouse over any side of an existing chart and click the “+” to add either a chart or a text block.
Adding an existing charts to a report
To add an existing chart to a report, select Edit report from the report context menu to open it for editing:

In the report editor, hover over any side of an existing chart and click the “+” button to add a chart:

A modal is opened, showing a list of charts to be added to the report:

These are the charts previously created under the Charts tab. Clicking a chart adds it to the report:

You can add more charts in the same way and drag & drop them to the desired position in the report.
Creating new charts within a report
You can also create a new chart within the report. You can do that by hovering over any side of an existing chart and clicking the “+” button to add a new chart:

In the chart window, select Add new chart:

You'll be shown a list of chart templates. You can create a new chart from a template, or you can create a new chart from scratch by selecting New blank chart:

When you create a chart within a report, it exists only within that report. It won't be visible for you or anyone else under the Charts tab. It can be edited only within that report.
Adding text blocks
You can add commentary to your reports with the Text block. To add a Text block, hover the mouse over any side of an existing chart and click “+“. Select Add a new text from the menu:
A new text block is added to the report:
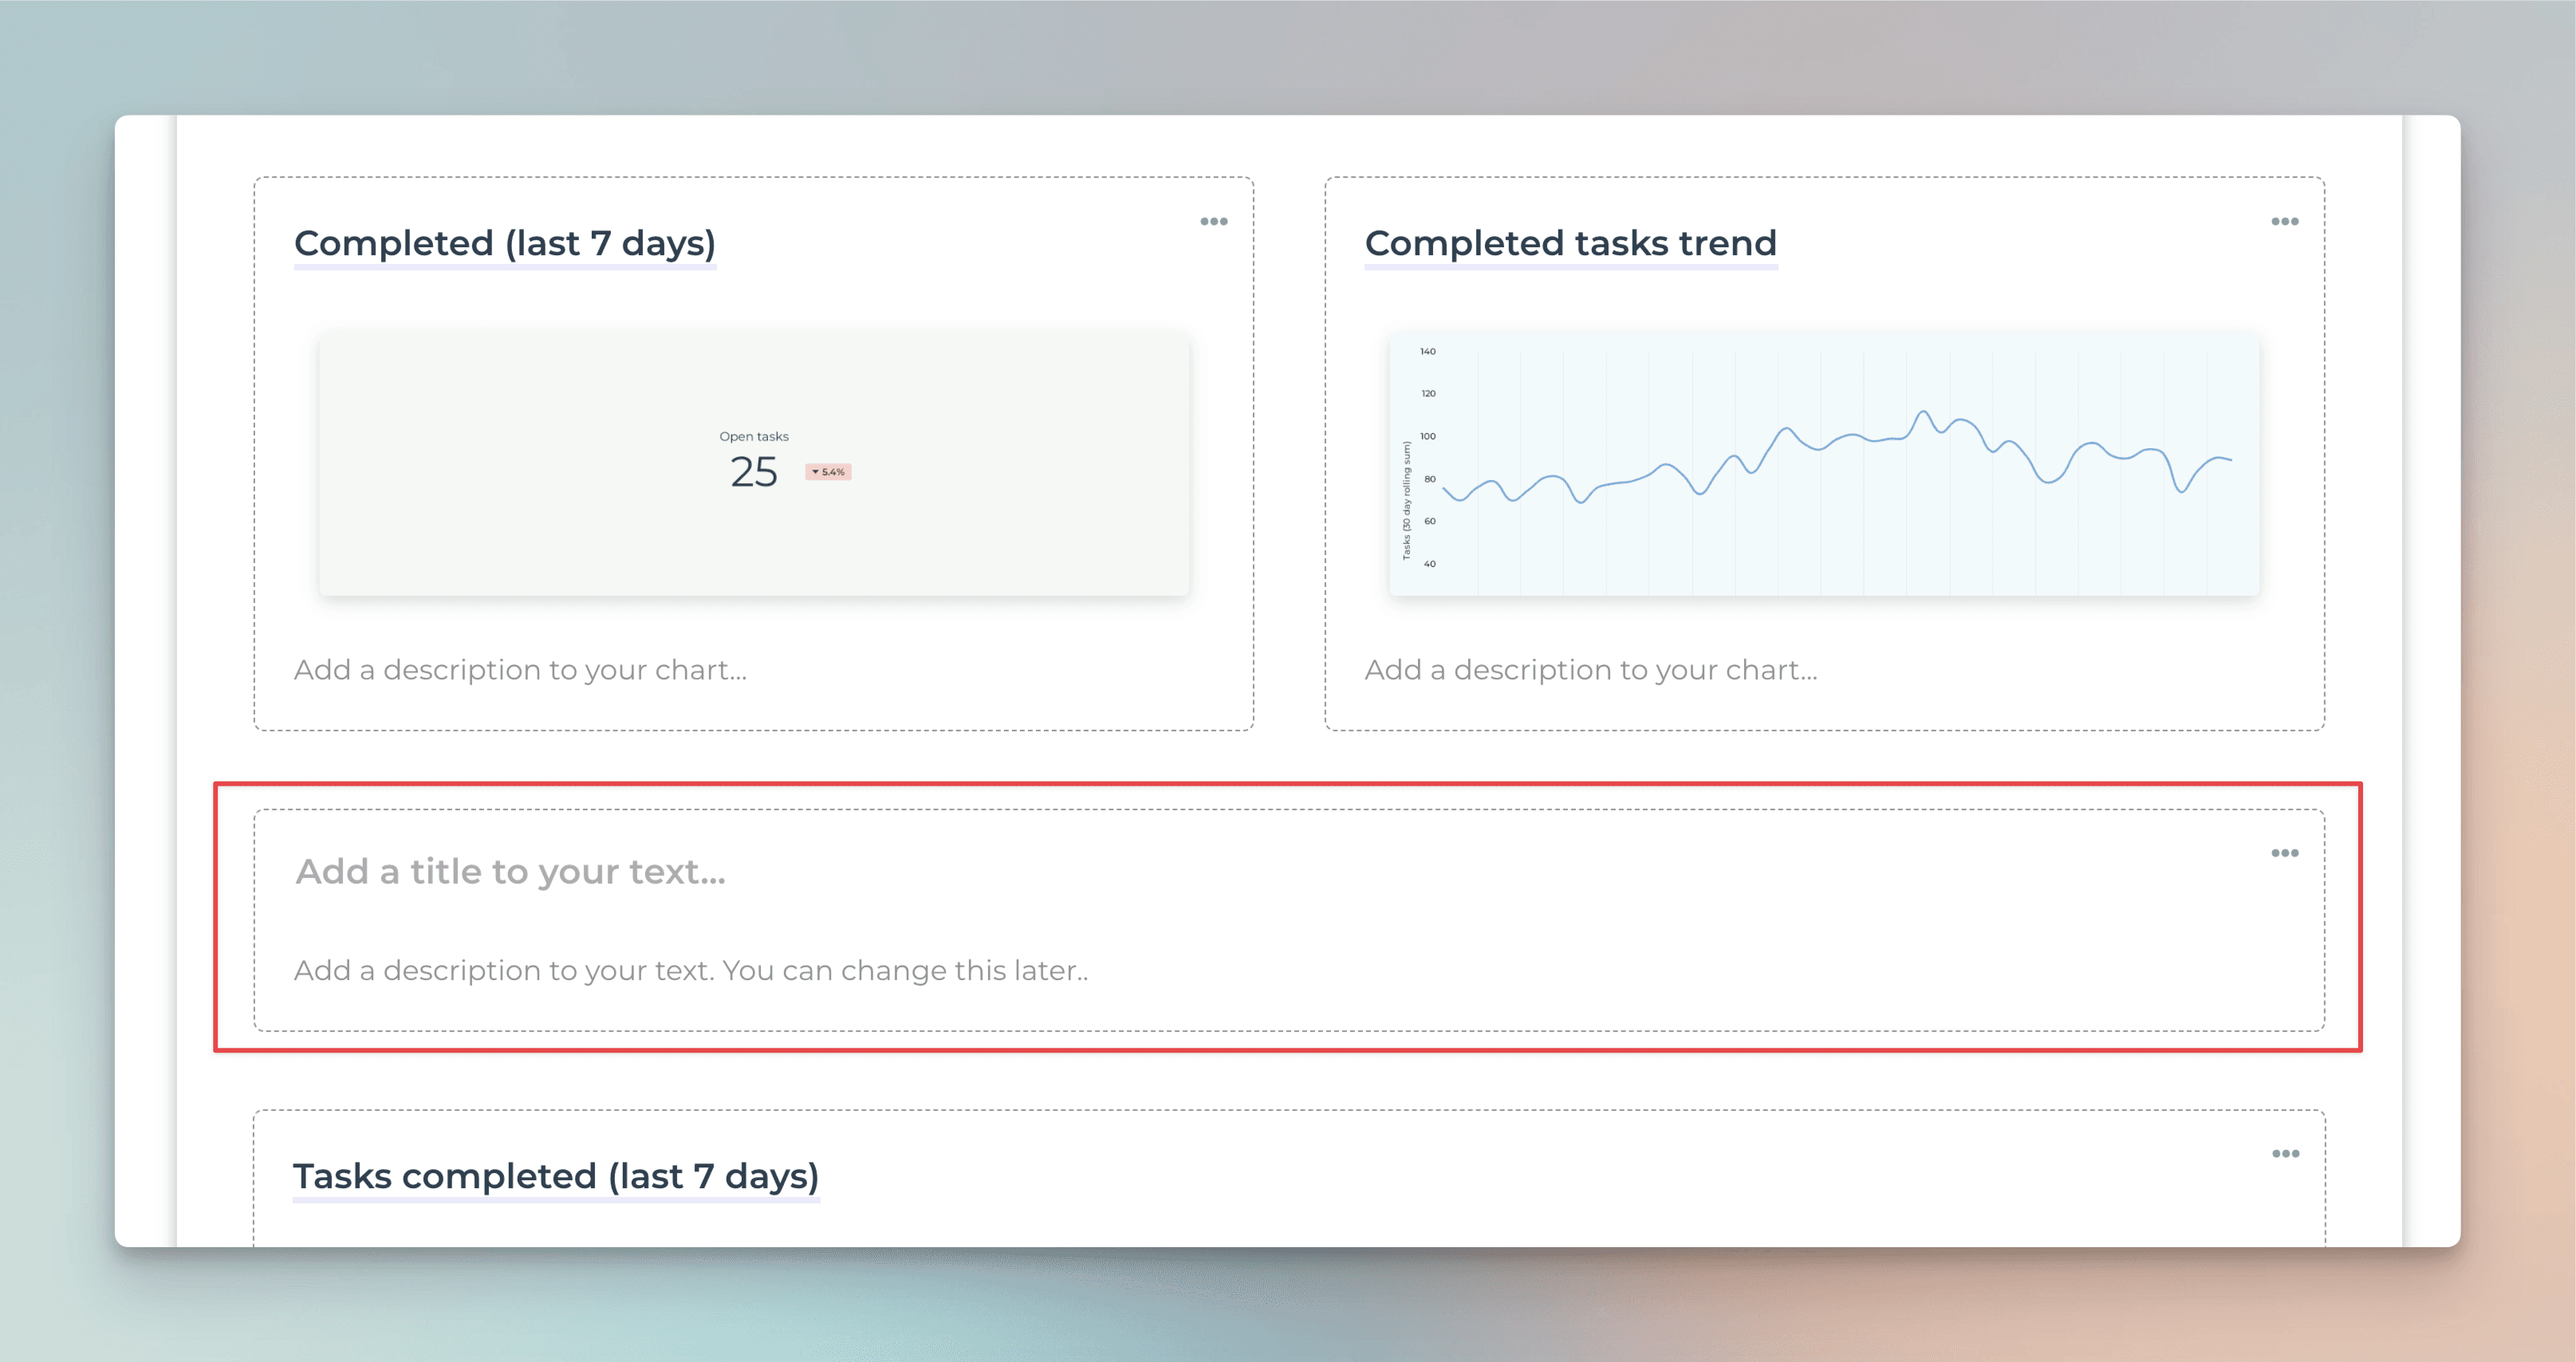
You can enter the title for the text block (optional) and add any commentary in the text field. Drag & drop the text block to the desired position.
Use Text block to provide commentary and to educate the person reading the report!
Learn more
Book a free onboarding call
Need help with setting up your charts and reports? Don't find a metric you are looking for? Book a call with our expert. We'd love to help you supercharge your reporting!


