The custom reports feature allows you to create reports and share them via email and Slack. The basic building block of a report is a custom chart. You can combine multiple charts into a report and reorder them by drag & drop. Add text fragments between the chart to include your comments and descriptions.
Create a report from scratch
To create a new report, go to the Reports tab and click Add new report on the top right corner.

A modal is opened with a set of report templates. You can either create a new report from scratch or pick one of the predefined reports.
To create a new report from scratch, select New blank report. Once you’re in the editor, you can give a name to your report and start adding charts and text blocks.

When you’re editing a report, you can insert any of your existing charts or create new ones within the report editor. You can also add atext fragments and commentary between the charts.
You can reorder the content blocks with drag & drop:
When you click Create report, the report is created, and you can find it in the Reports tab under the top navigation. From there, you can download it as a PDF, schedule it to be sent via email, or share it with others using the share links.
You can set the visibility to be either private or public in the report settings.

Private reports are seen only by you, but you can still share the report via a public share link or schedule it to be sent via email.
Creating a report from a template
To create a new report from a template, go to the Reports tab and click Add new report on the top right corner.
A modal is opened with a set of report templates.
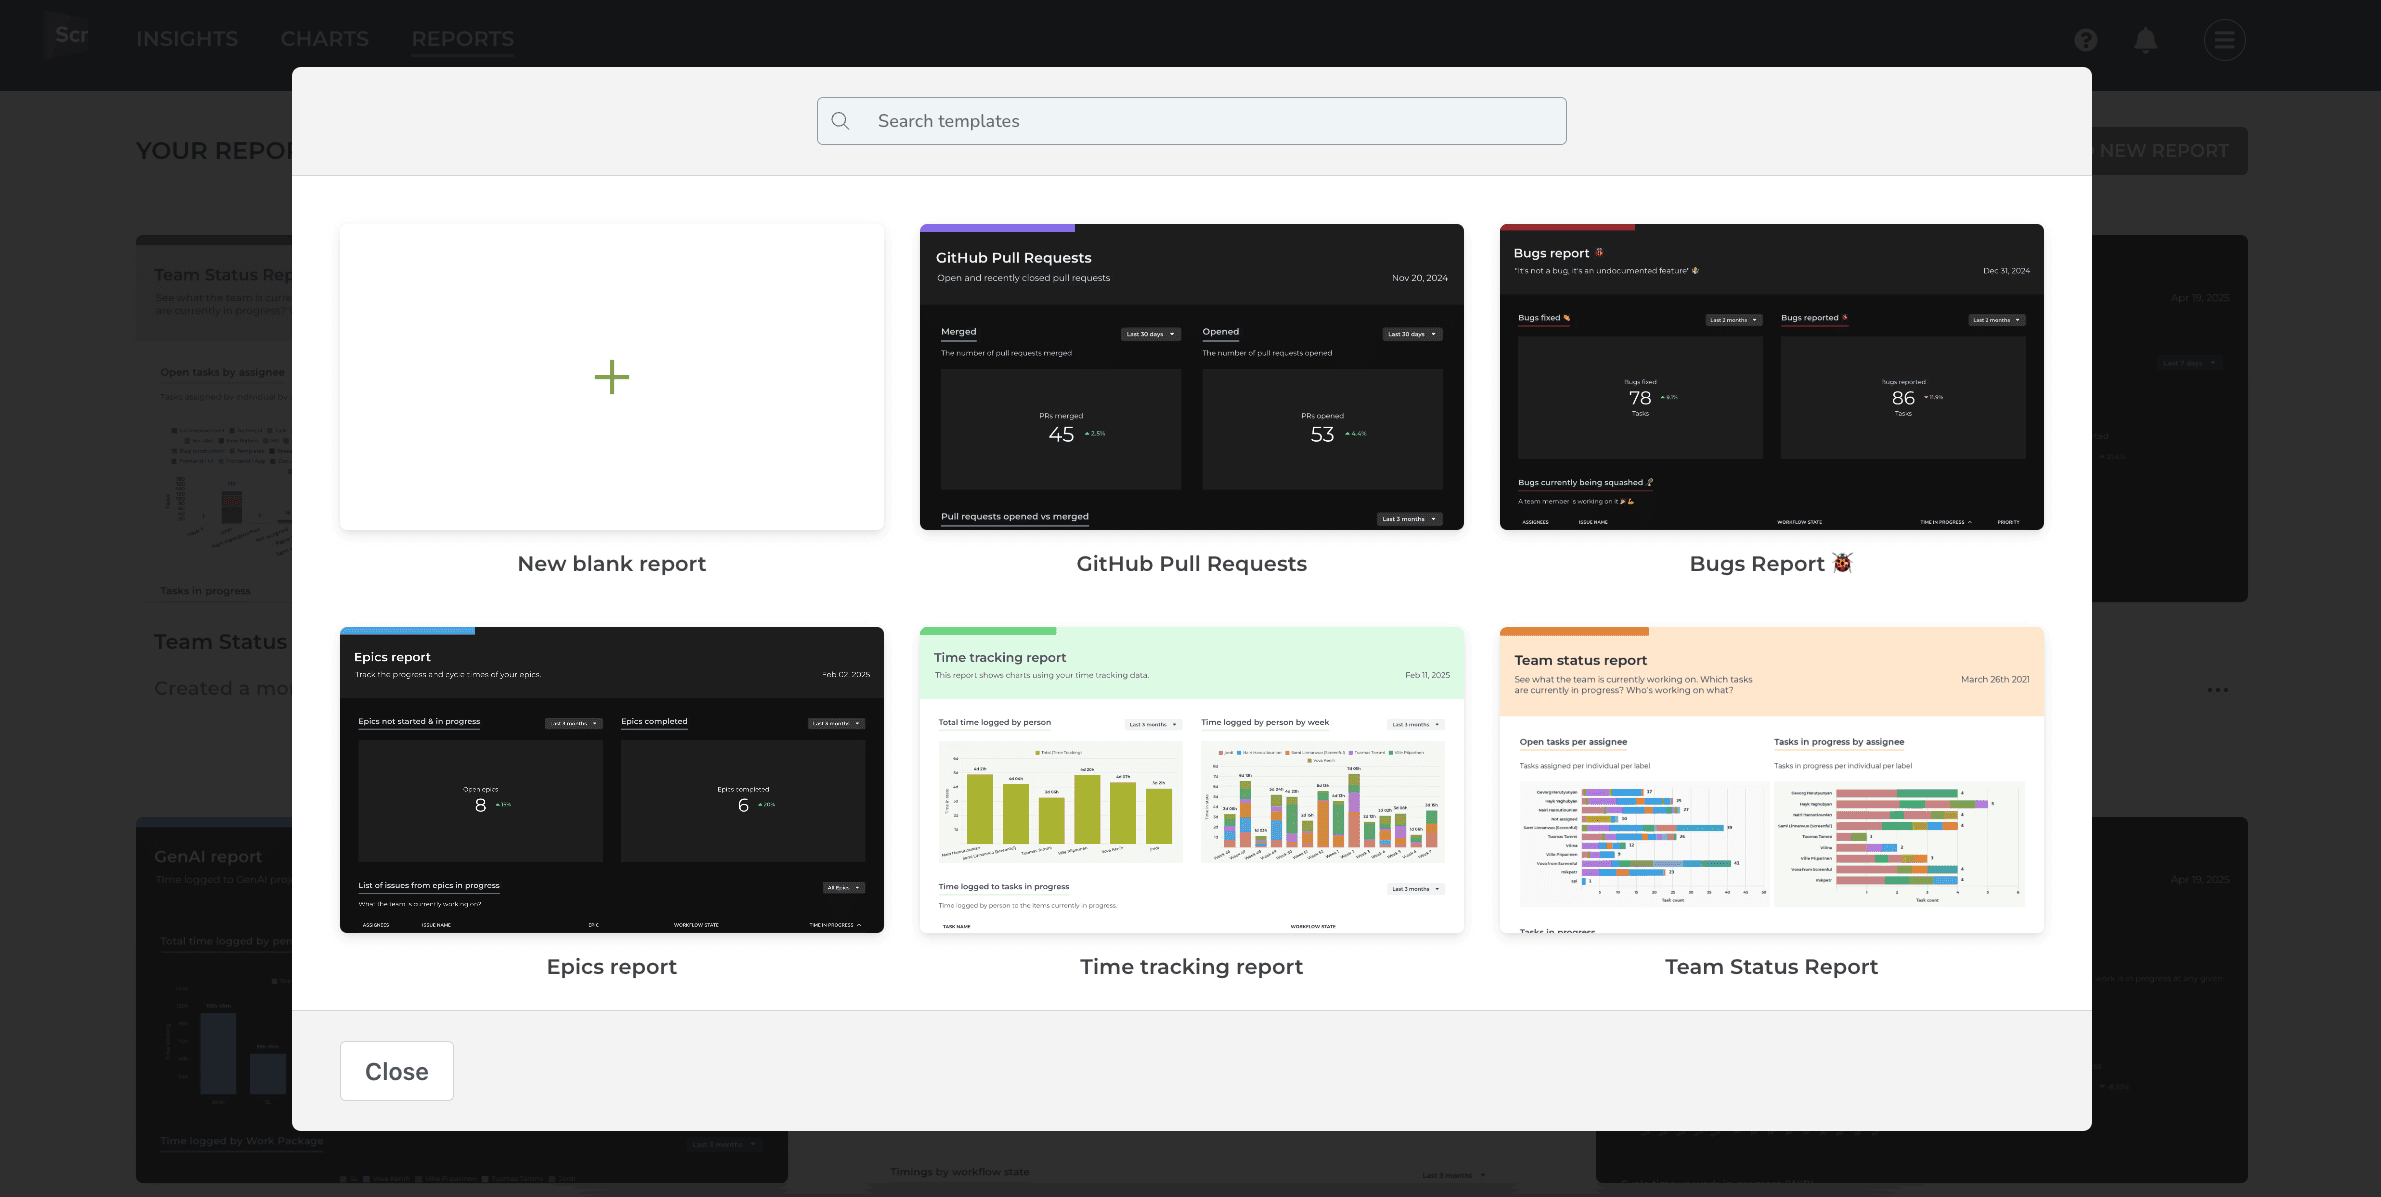
Clicking one of the templates opens a preview with real data:
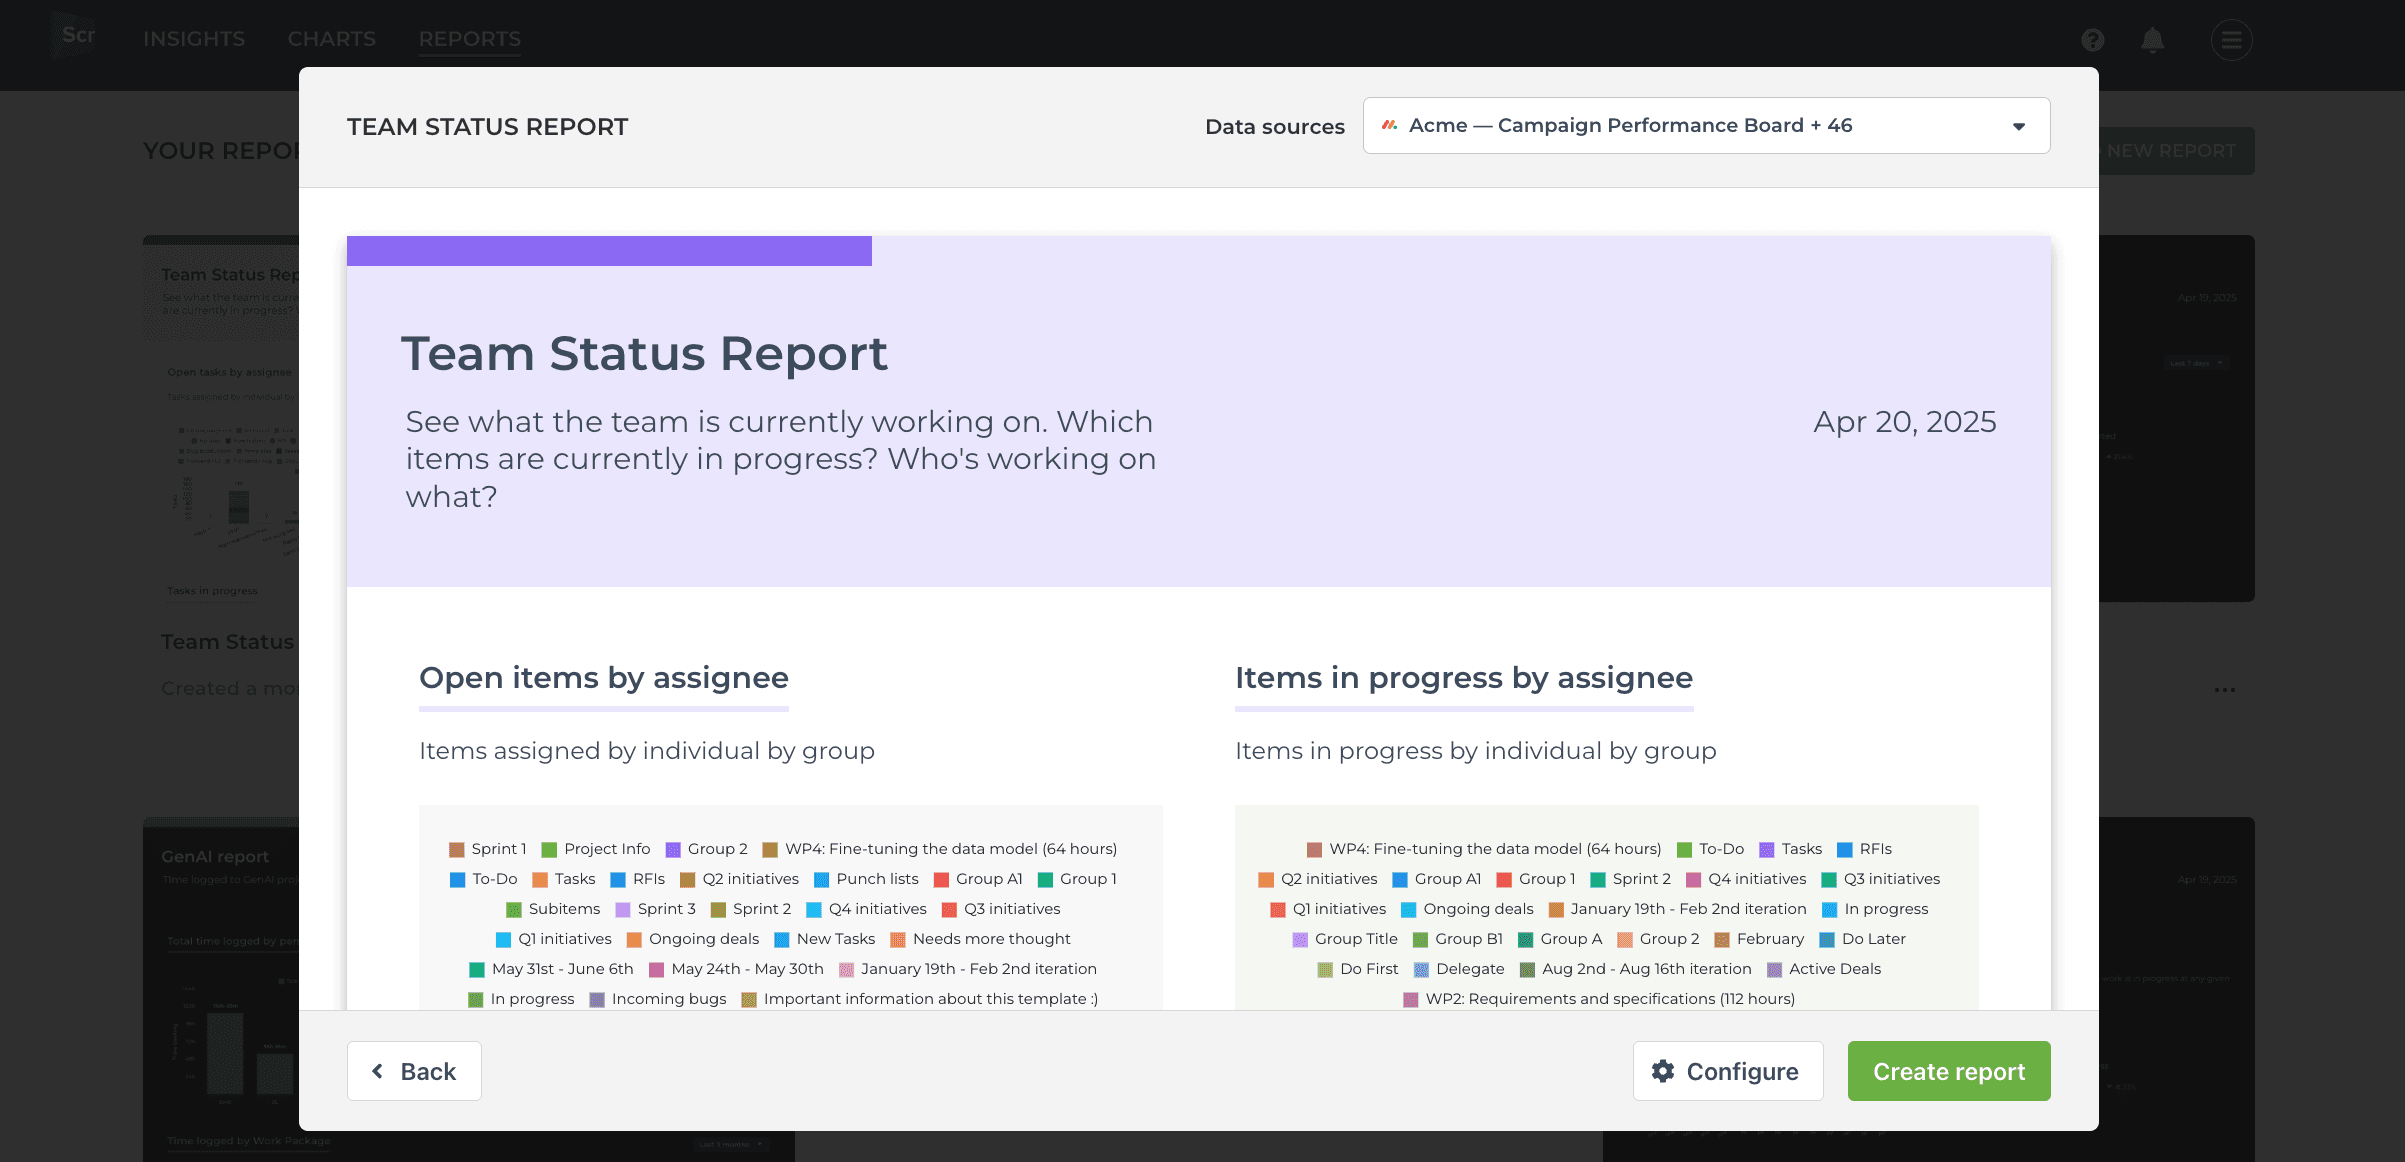
You can select the data sources from the Data sources menu above the report. You can pick one or more data sources for your reports and have them applied to all the charts within the report.
To modify the report, click Configure to open the report for editing. The report editor opens, showing the predefined content. You can add or remove charts and text blocks, and adjust the layout of the report.
Clicking Create report saves the report, and it becomes available under the Reports tab.
Learn more
Book a free onboarding call
Need help with setting up your charts and reports? Don't find a metric you are looking for? Book a call with our expert. We'd love to help you supercharge your reporting!


