
Introducing AI-based workflow mapping 🤖
Apr 30, 2023
We are committed to bringing you the most user-friendly analytics tool in existence. Today we are one step closer to that goal by introducing automated workflow mapping. Previously, when you imported a data source, you were asked to specify when the work is started on a task and when it was completed. That information is used e.g. for calculating the Timing metrics. Now you don’t have to bother anymore as AI will do it for you.
Here’s how it works. Once you have selected one or more boards for importing, you will be shown a suggested mapping.
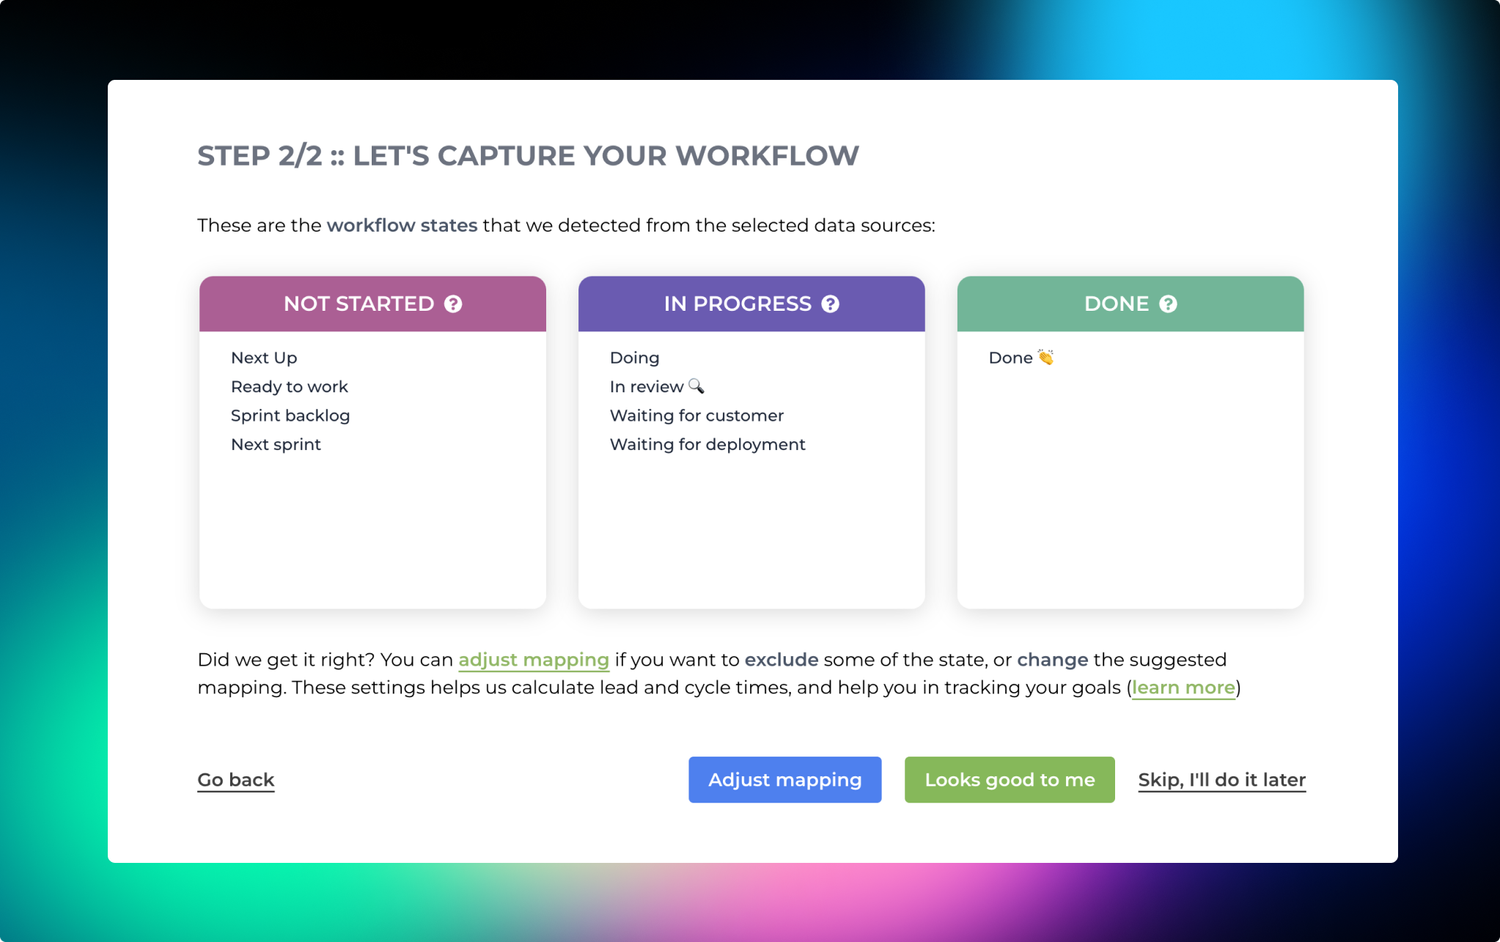
If the suggested mapping looks correct, you can accept it by clicking Looks good to me. You are done, and you can navigate to the Insights tab to see the automatically generated charts and metrics.
If AI mapped something incorrectly, you can click Adjust mapping. The boxes become editable, and you can drag & drop items between them.
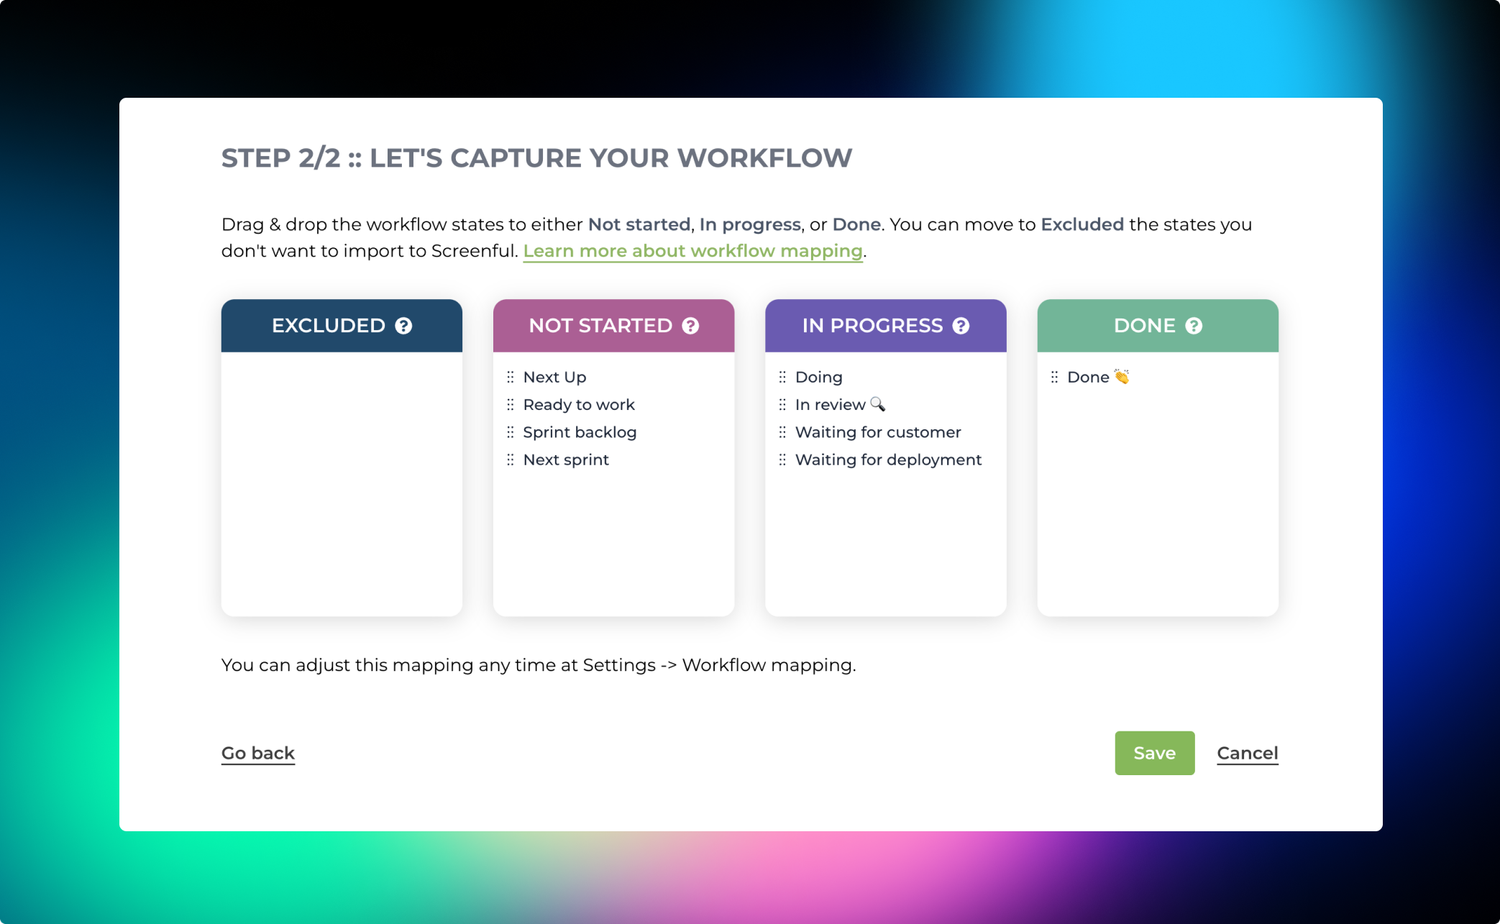
Once you click Save, you’re done, and you can navigate to the Insights tab to see the automatically generated charts and metrics.
When new workflow states are added afterward, they are also automatically mapped. This happens by default for all new data sources. For existing data sources, you can set the default in the Workflow tab under the General settings.
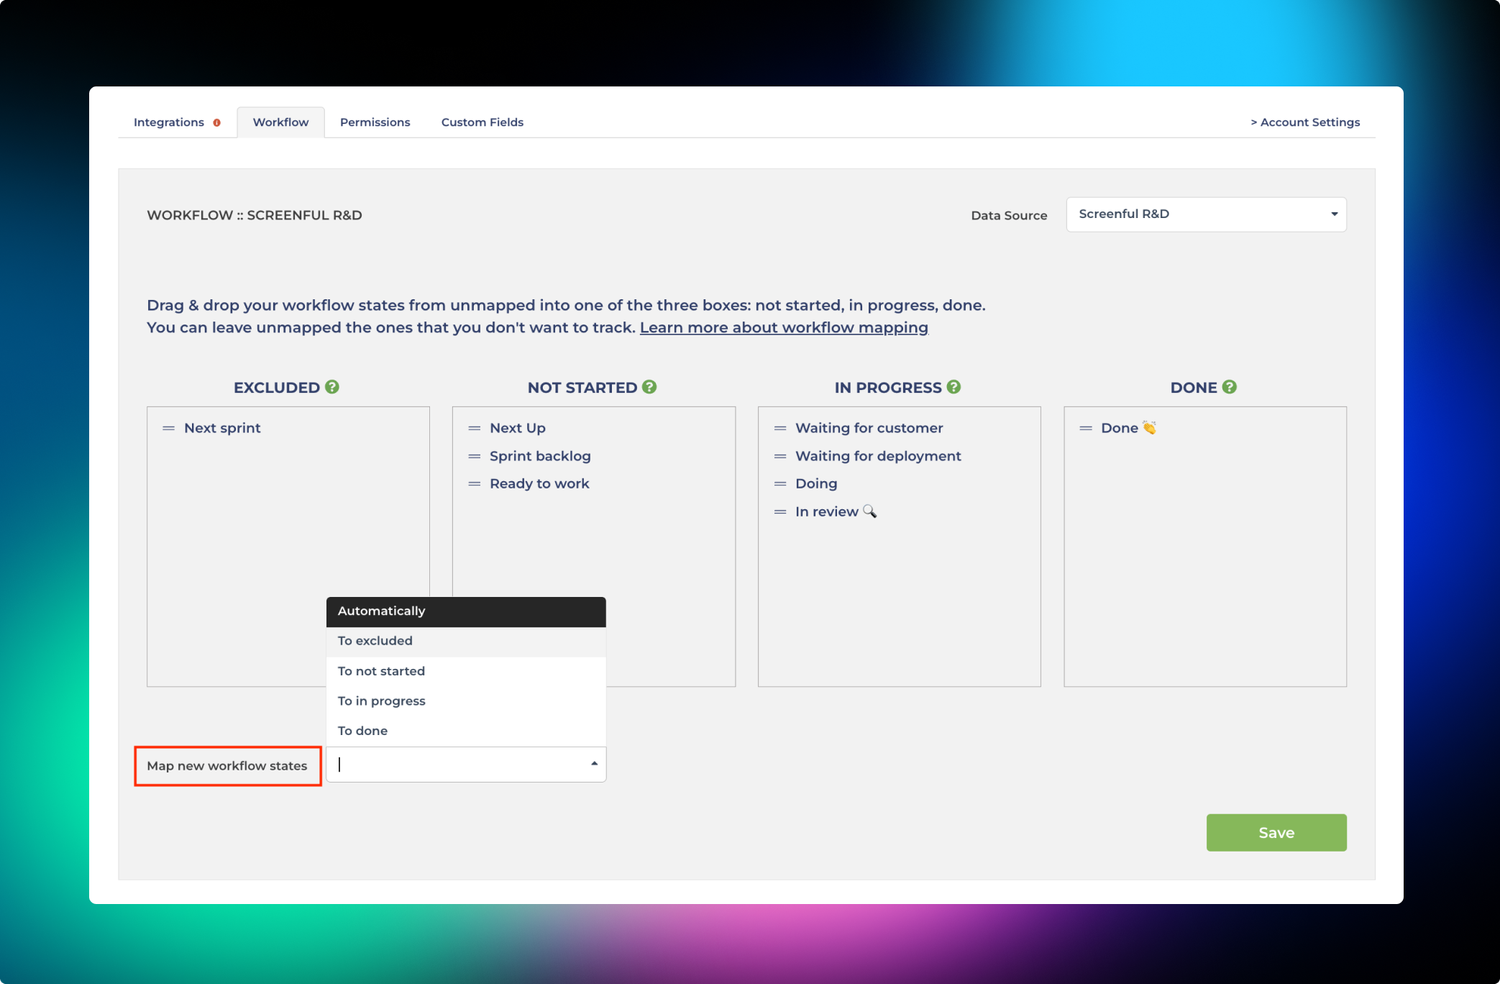
You can choose to map automatically to either Not started, In progress, or Done, or Excluded, in which case they are ignored. If you select Automatically, new states are mapped automatically by AI.
Let us know if you have questions or feedback by contacting hello@screenful.com. To stay on the loop, read our blog, or follow us on LinkedIn.