Guide contents:
Adding data sources
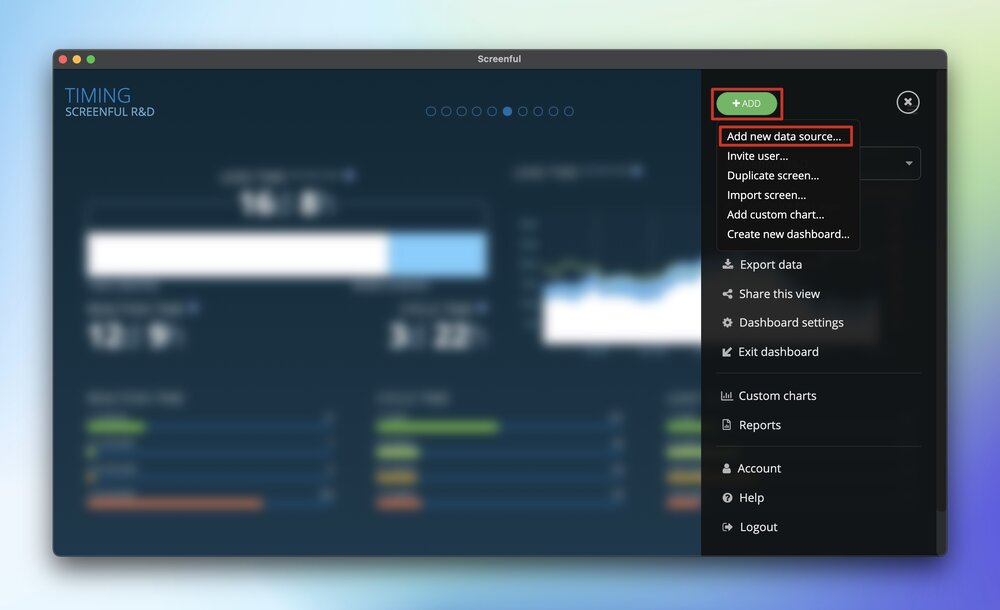
You can add a new data source to your dashboard by clicking on Add ▶ Add new data source under the main menu.
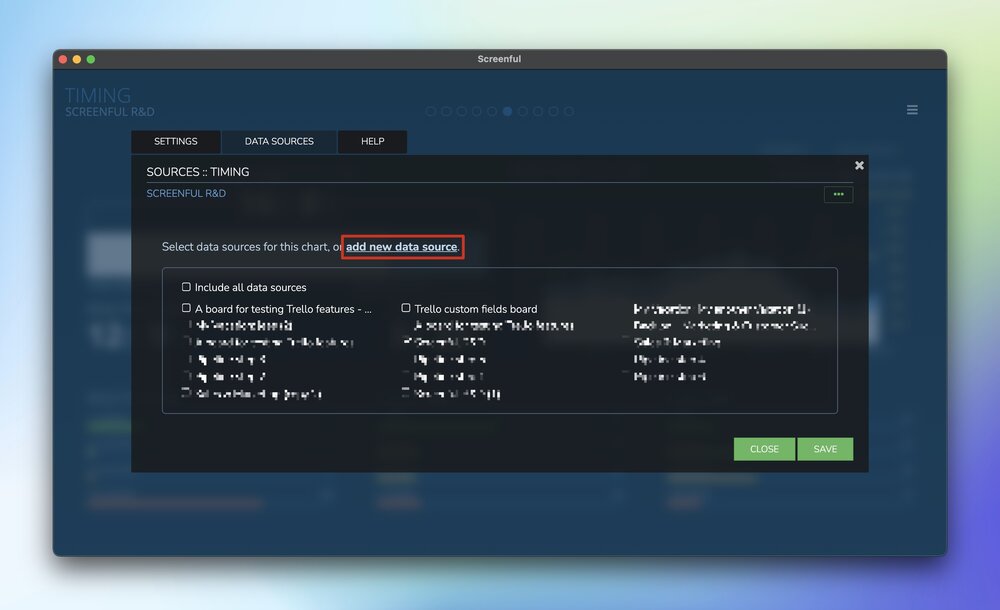
You will see a list of data sources that are already imported to your account. You can add any of them to your dashboard simply checking the box.
If the board or a project you’re looking for is not included in the list, you can add a new data source by clicking add new data source
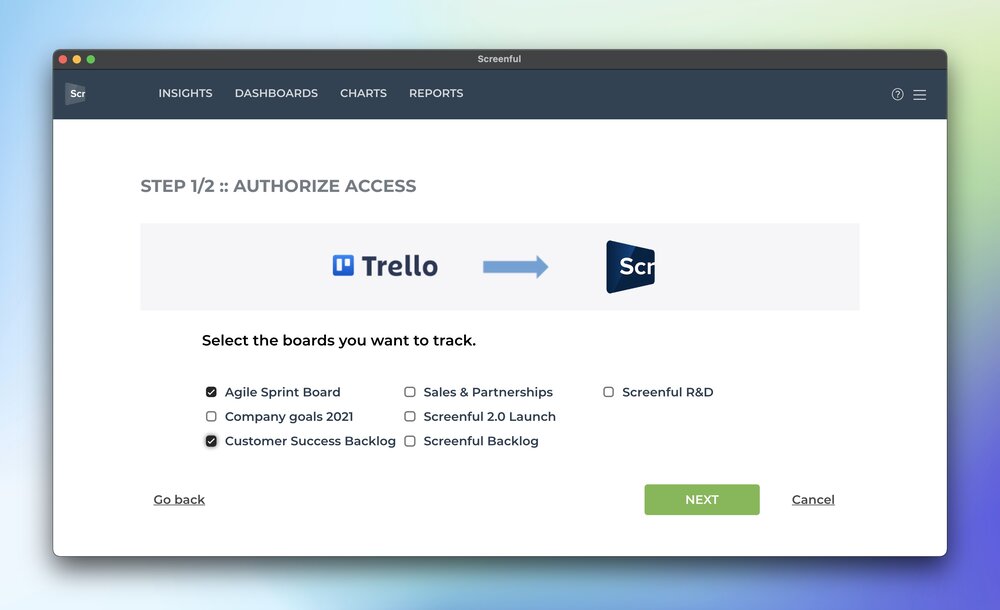
You’ll be first prompted to authorize your tool. Once you’re done with the authorization, you’ll be shown a list of available data sources.
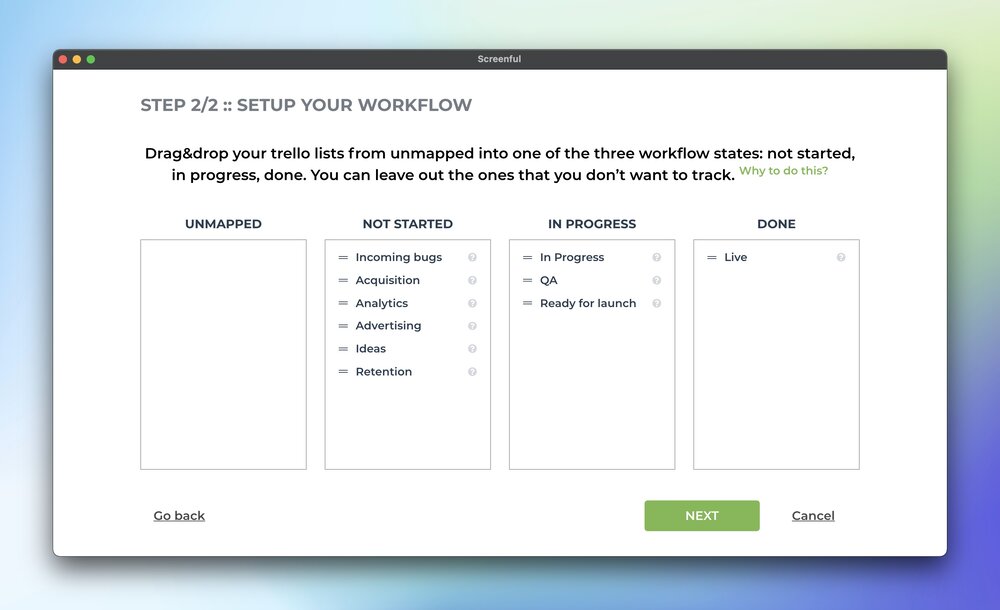
Once you’ve selected one or more data sources, you’ll be shown the workflow mapping step which allows you to specify when the work is started on a task, and when it's completed.
In the last step, you get to choose which screens in your dashboard should get the new data sources.
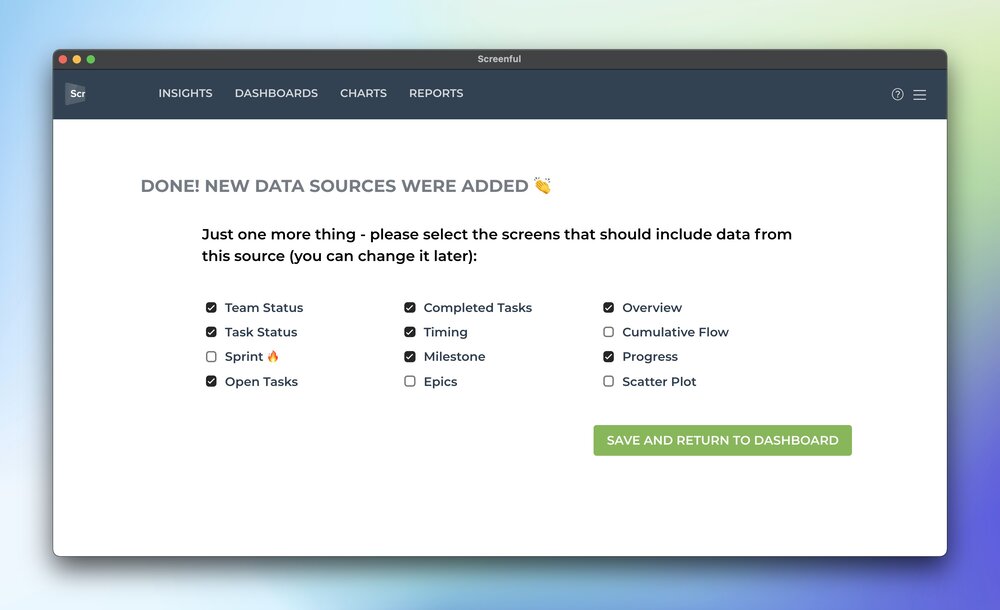
Click Save and return to dashboard to complete the process.
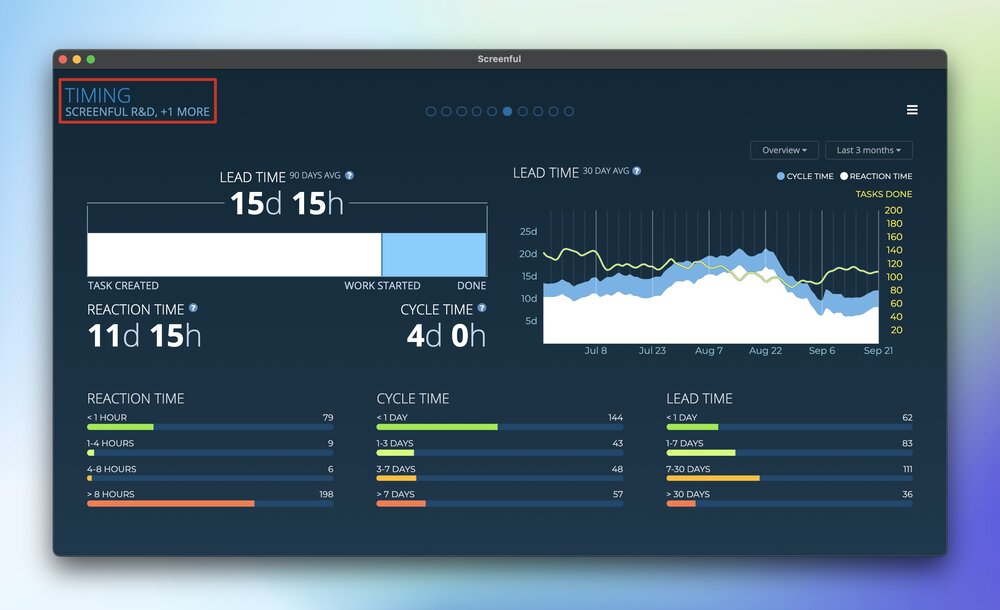
The newly added source is now visible. You can see that a new source has been added by looking at the upper left corner of your screen.
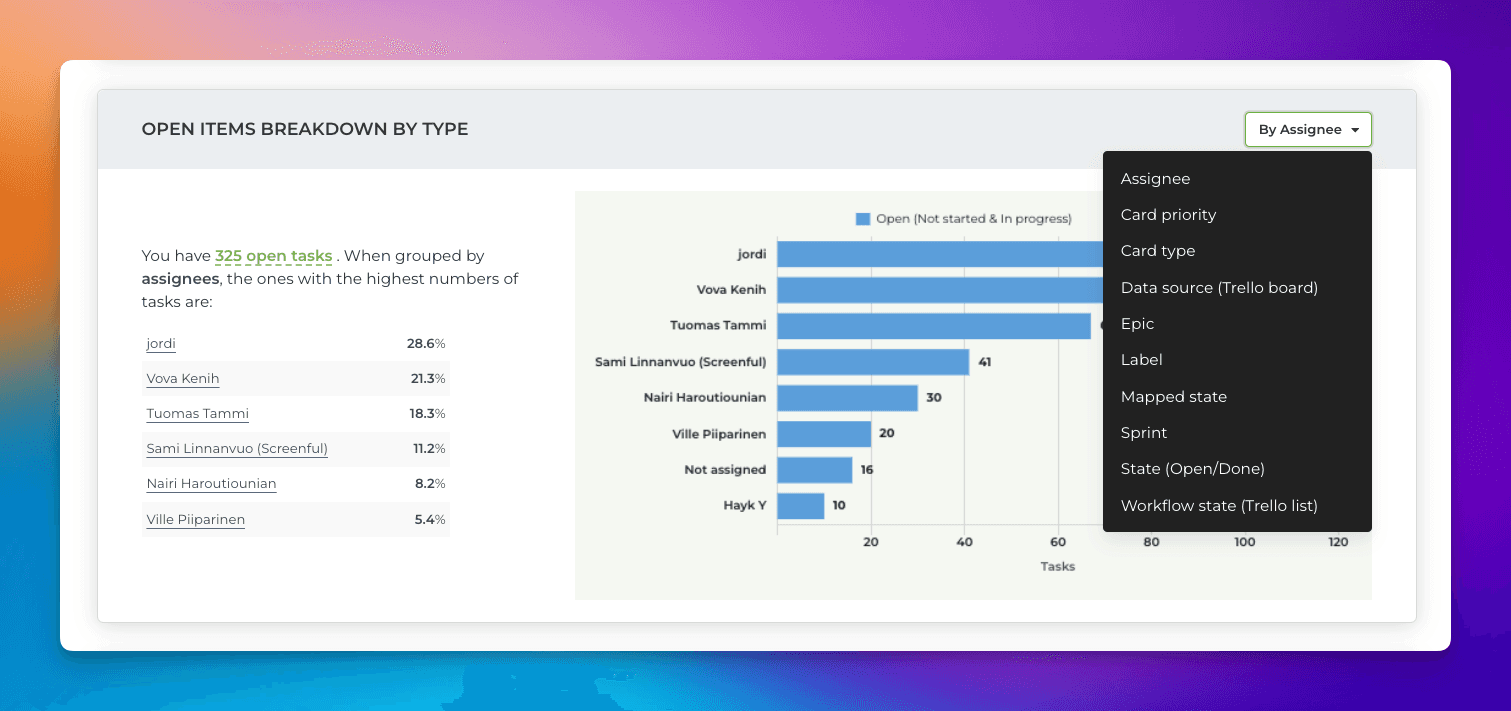
Adjust the charts with quick menus
Some of the charts display grouped data. You can change the grouping by selecting a property from the Group by menu:
If a chart displays time-based data, you can adjust the date range:
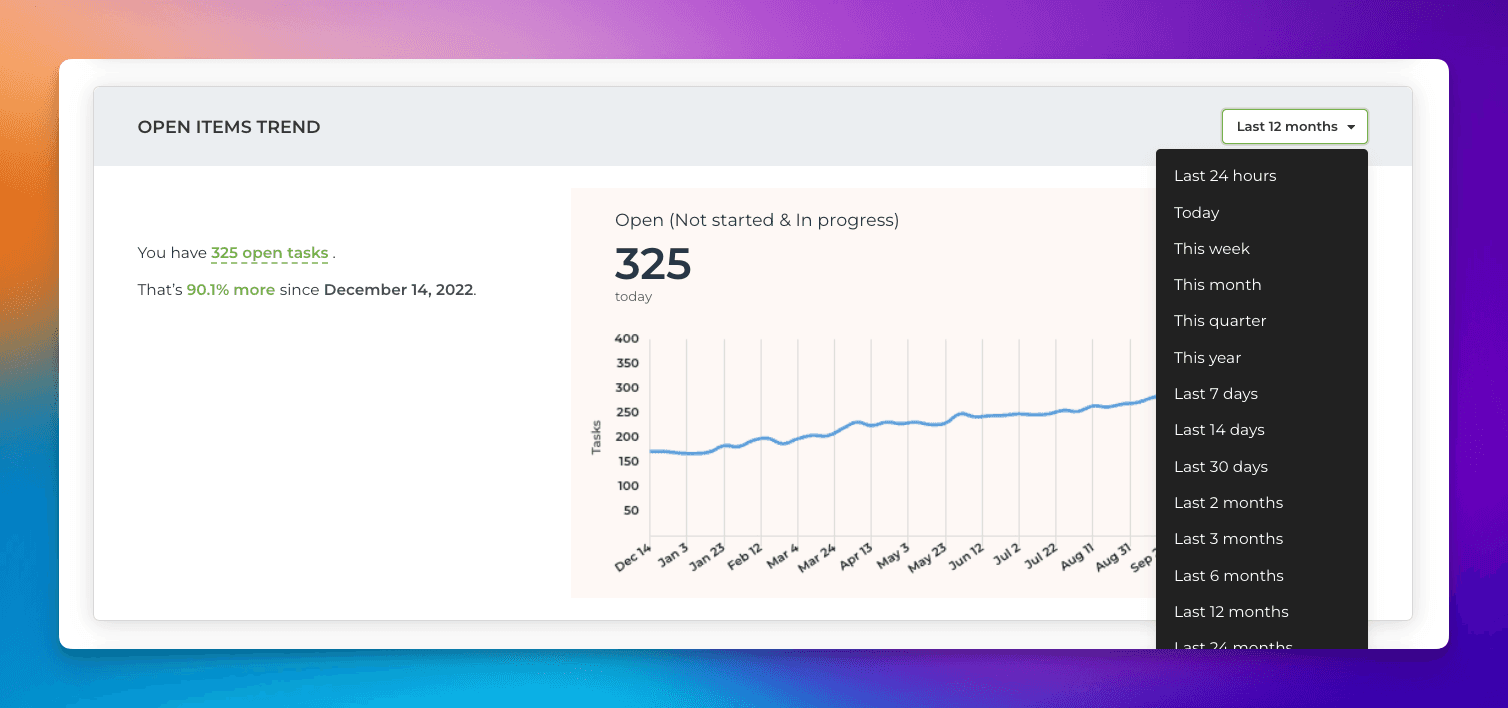
Notice that the length of the available history depends on the plan. For trial accounts, it is six months.