Introducing chart templates 📊
Introducing chart templates 📊
Jan 30, 2021


New year, new tricks! We’ve made it much easier to add custom charts to your dashboards and reports. Previously you had to go through a somewhat laborious process of picking options in the chart editor in order to create custom charts. Now that process becomes easier with the introduction of the chart templates.
Create new charts with just a few clicks
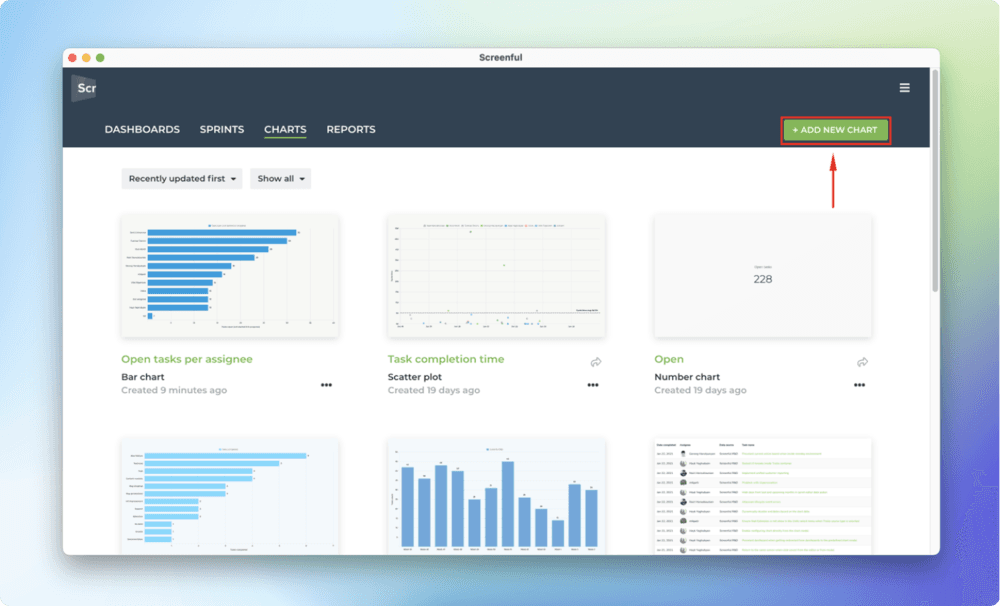
To create a new chart from a template, go to the Charts tab and click Add new chart on the top right corner.
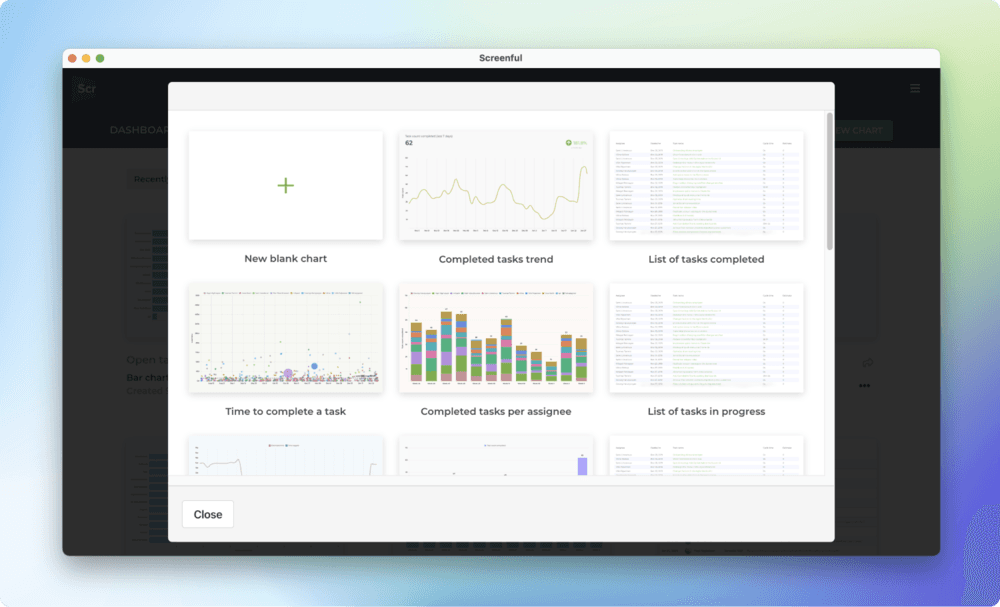
A modal is opened with a set of chart templates. You can either create a new chart from scratch or pick one of the predefined charts.
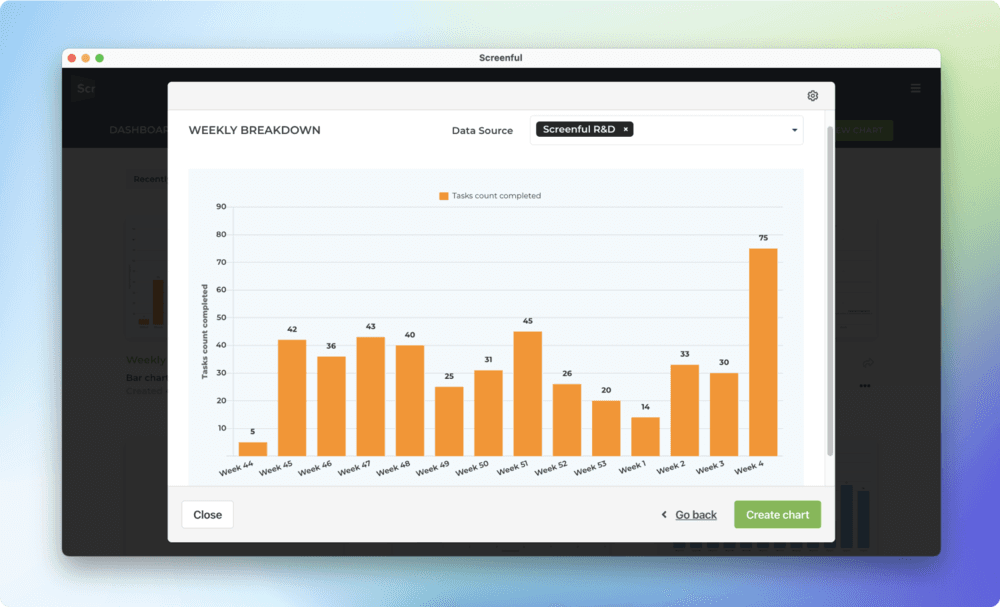
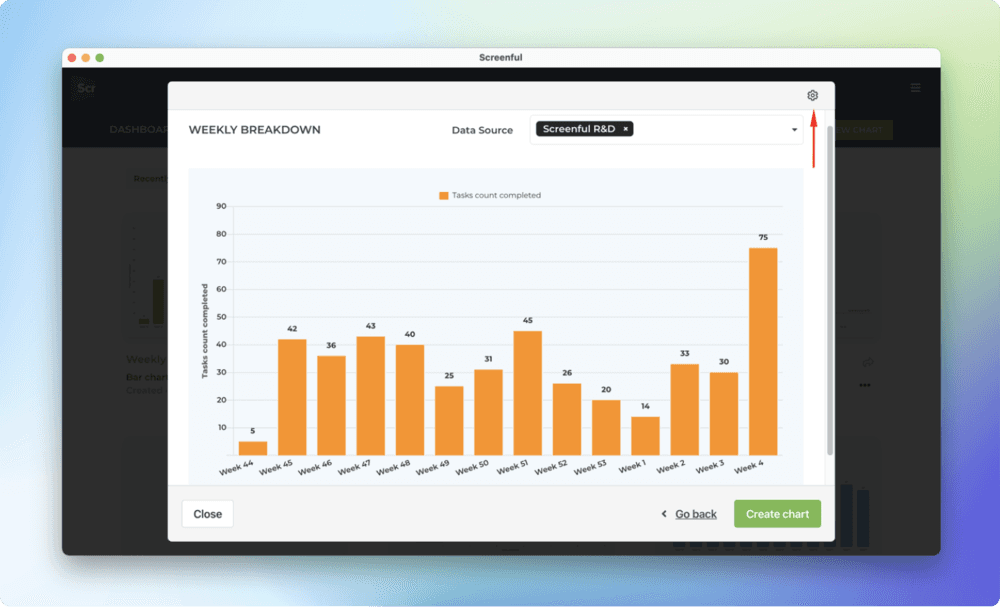
Clicking one of chart templates opens a preview with real data. You can select the data sources from the Data source menu above the chart. You can pick one or more data sources for your chart and see the results immediately.
When you click Create chart, the chart is created and you can find it under the Charts tab under the main view.
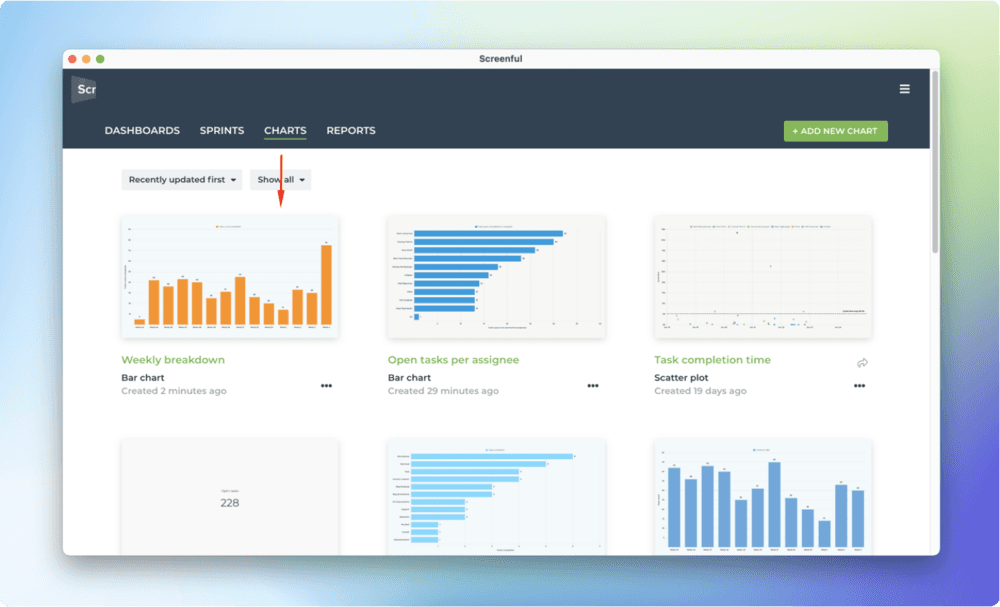
From there, you can assign to dashboards or reports, or share with others using the share links.
Configuring the chart templates
While picking from the ready made templates is the quickest way to get started, your use case may require more customised approach. No worries, you can click the Configure icon on the top right corner to open the chart for editing.
The chart editor opens with all of the chart settings pre configured. If the chart is anywhere close to what you’re looking for, you should be able to make it perfect with just slight adjustments with the editor.
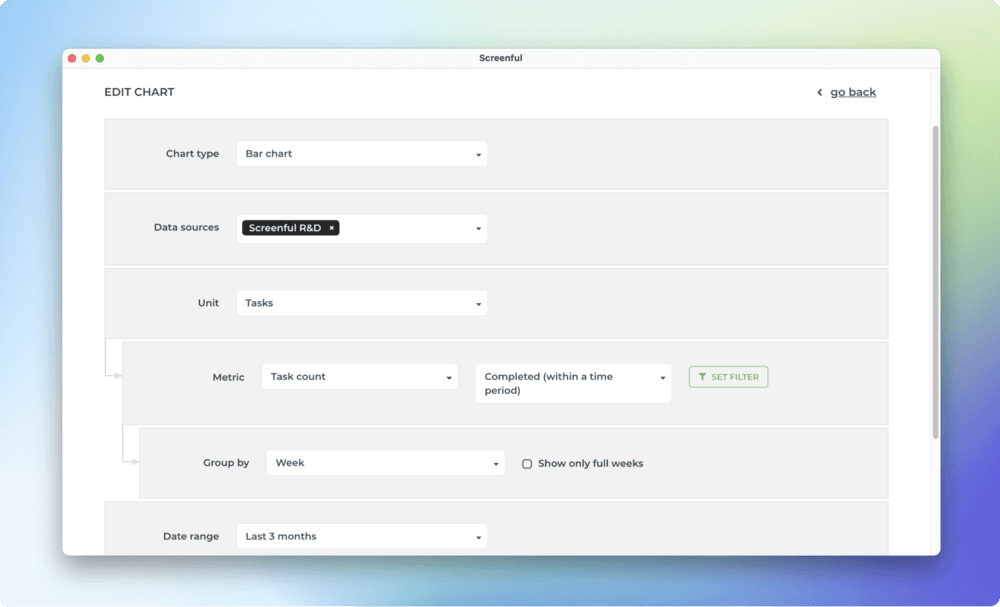
Whenever you create a new custom chart, whether from within a dashboard or even when editing a report, you have the ability to pick one of the chart templates, or to create a new chart from scratch.
Summary
Chart templates are now available for all users. You can easily create charts from templates and share them with others using share links and scheduled reports. We’ll be adding more templates to the library over time.
Here’s how the chart creation from a template works:
We’re also working on some improvements to the chart editor, and even some new chart types, so stay tuned for the upcoming release notes!
New year, new tricks! We’ve made it much easier to add custom charts to your dashboards and reports. Previously you had to go through a somewhat laborious process of picking options in the chart editor in order to create custom charts. Now that process becomes easier with the introduction of the chart templates.
Create new charts with just a few clicks
To create a new chart from a template, go to the Charts tab and click Add new chart on the top right corner.

A modal is opened with a set of chart templates. You can either create a new chart from scratch or pick one of the predefined charts.

Clicking one of chart templates opens a preview with real data. You can select the data sources from the Data source menu above the chart. You can pick one or more data sources for your chart and see the results immediately.

When you click Create chart, the chart is created and you can find it under the Charts tab under the main view.

From there, you can assign to dashboards or reports, or share with others using the share links.
Configuring the chart templates
While picking from the ready made templates is the quickest way to get started, your use case may require more customised approach. No worries, you can click the Configure icon on the top right corner to open the chart for editing.

The chart editor opens with all of the chart settings pre configured. If the chart is anywhere close to what you’re looking for, you should be able to make it perfect with just slight adjustments with the editor.

Whenever you create a new custom chart, whether from within a dashboard or even when editing a report, you have the ability to pick one of the chart templates, or to create a new chart from scratch.
Summary
Chart templates are now available for all users. You can easily create charts from templates and share them with others using share links and scheduled reports. We’ll be adding more templates to the library over time.
Here’s how the chart creation from a template works:
We’re also working on some improvements to the chart editor, and even some new chart types, so stay tuned for the upcoming release notes!
New year, new tricks! We’ve made it much easier to add custom charts to your dashboards and reports. Previously you had to go through a somewhat laborious process of picking options in the chart editor in order to create custom charts. Now that process becomes easier with the introduction of the chart templates.
Create new charts with just a few clicks
To create a new chart from a template, go to the Charts tab and click Add new chart on the top right corner.

A modal is opened with a set of chart templates. You can either create a new chart from scratch or pick one of the predefined charts.

Clicking one of chart templates opens a preview with real data. You can select the data sources from the Data source menu above the chart. You can pick one or more data sources for your chart and see the results immediately.

When you click Create chart, the chart is created and you can find it under the Charts tab under the main view.

From there, you can assign to dashboards or reports, or share with others using the share links.
Configuring the chart templates
While picking from the ready made templates is the quickest way to get started, your use case may require more customised approach. No worries, you can click the Configure icon on the top right corner to open the chart for editing.

The chart editor opens with all of the chart settings pre configured. If the chart is anywhere close to what you’re looking for, you should be able to make it perfect with just slight adjustments with the editor.

Whenever you create a new custom chart, whether from within a dashboard or even when editing a report, you have the ability to pick one of the chart templates, or to create a new chart from scratch.
Summary
Chart templates are now available for all users. You can easily create charts from templates and share them with others using share links and scheduled reports. We’ll be adding more templates to the library over time.
Here’s how the chart creation from a template works:
We’re also working on some improvements to the chart editor, and even some new chart types, so stay tuned for the upcoming release notes!
That’s it for this release. As always, we’d love to hear from you. Please do not hesitate to contact us anytime if you have questions or feedback.
To give it a try with your own data, sign up for a free 14-day trial
Also, check out recent product updates and follow us on Twitter or Facebook.