If you add any numerical or timing fields as columns to the Task list chart, the values are summarized on the bottom row. To configure this behavior, go to Chart settings and toggle Show summary row to enable or disable the summary row for the chart.
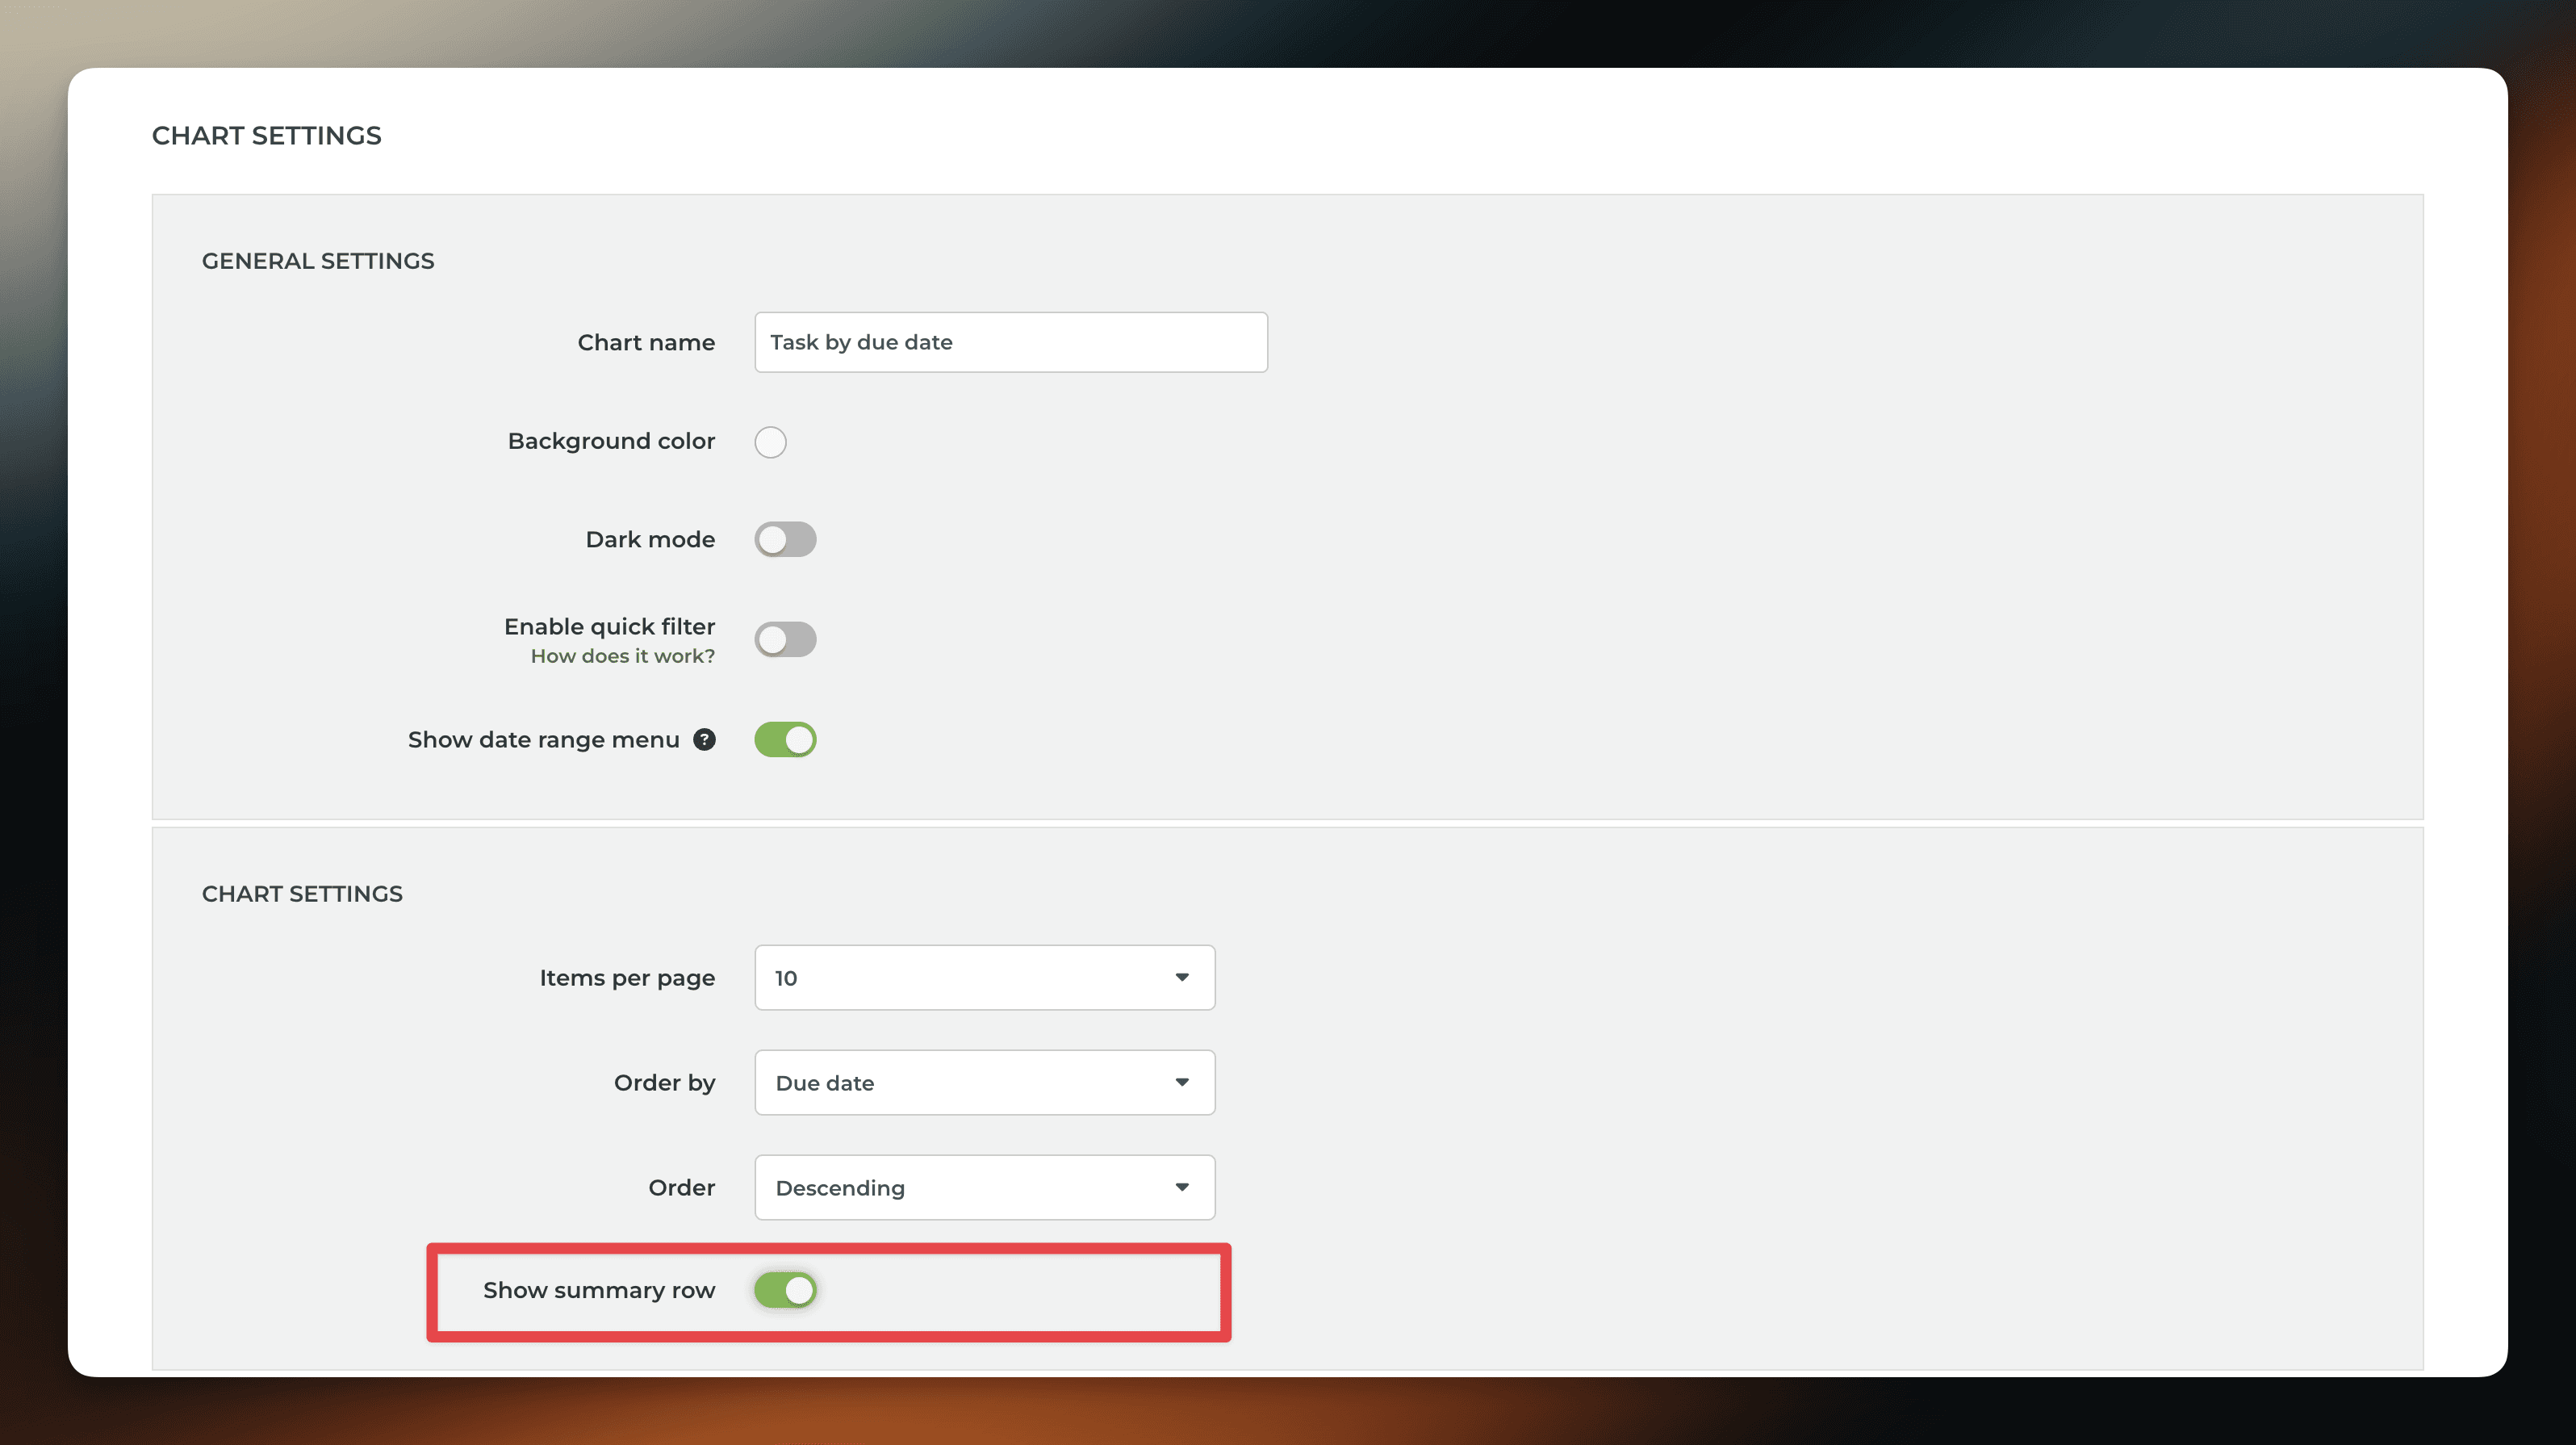
In the Chart settings, you can also configure the type of summary for each column to be either sum, average, or median. If you select None, no summary is displayed.
The summary menus are shown for each column that contains numerical or timing data. Once you have saved the settings, the chart starts displaying a summary row at the bottom.
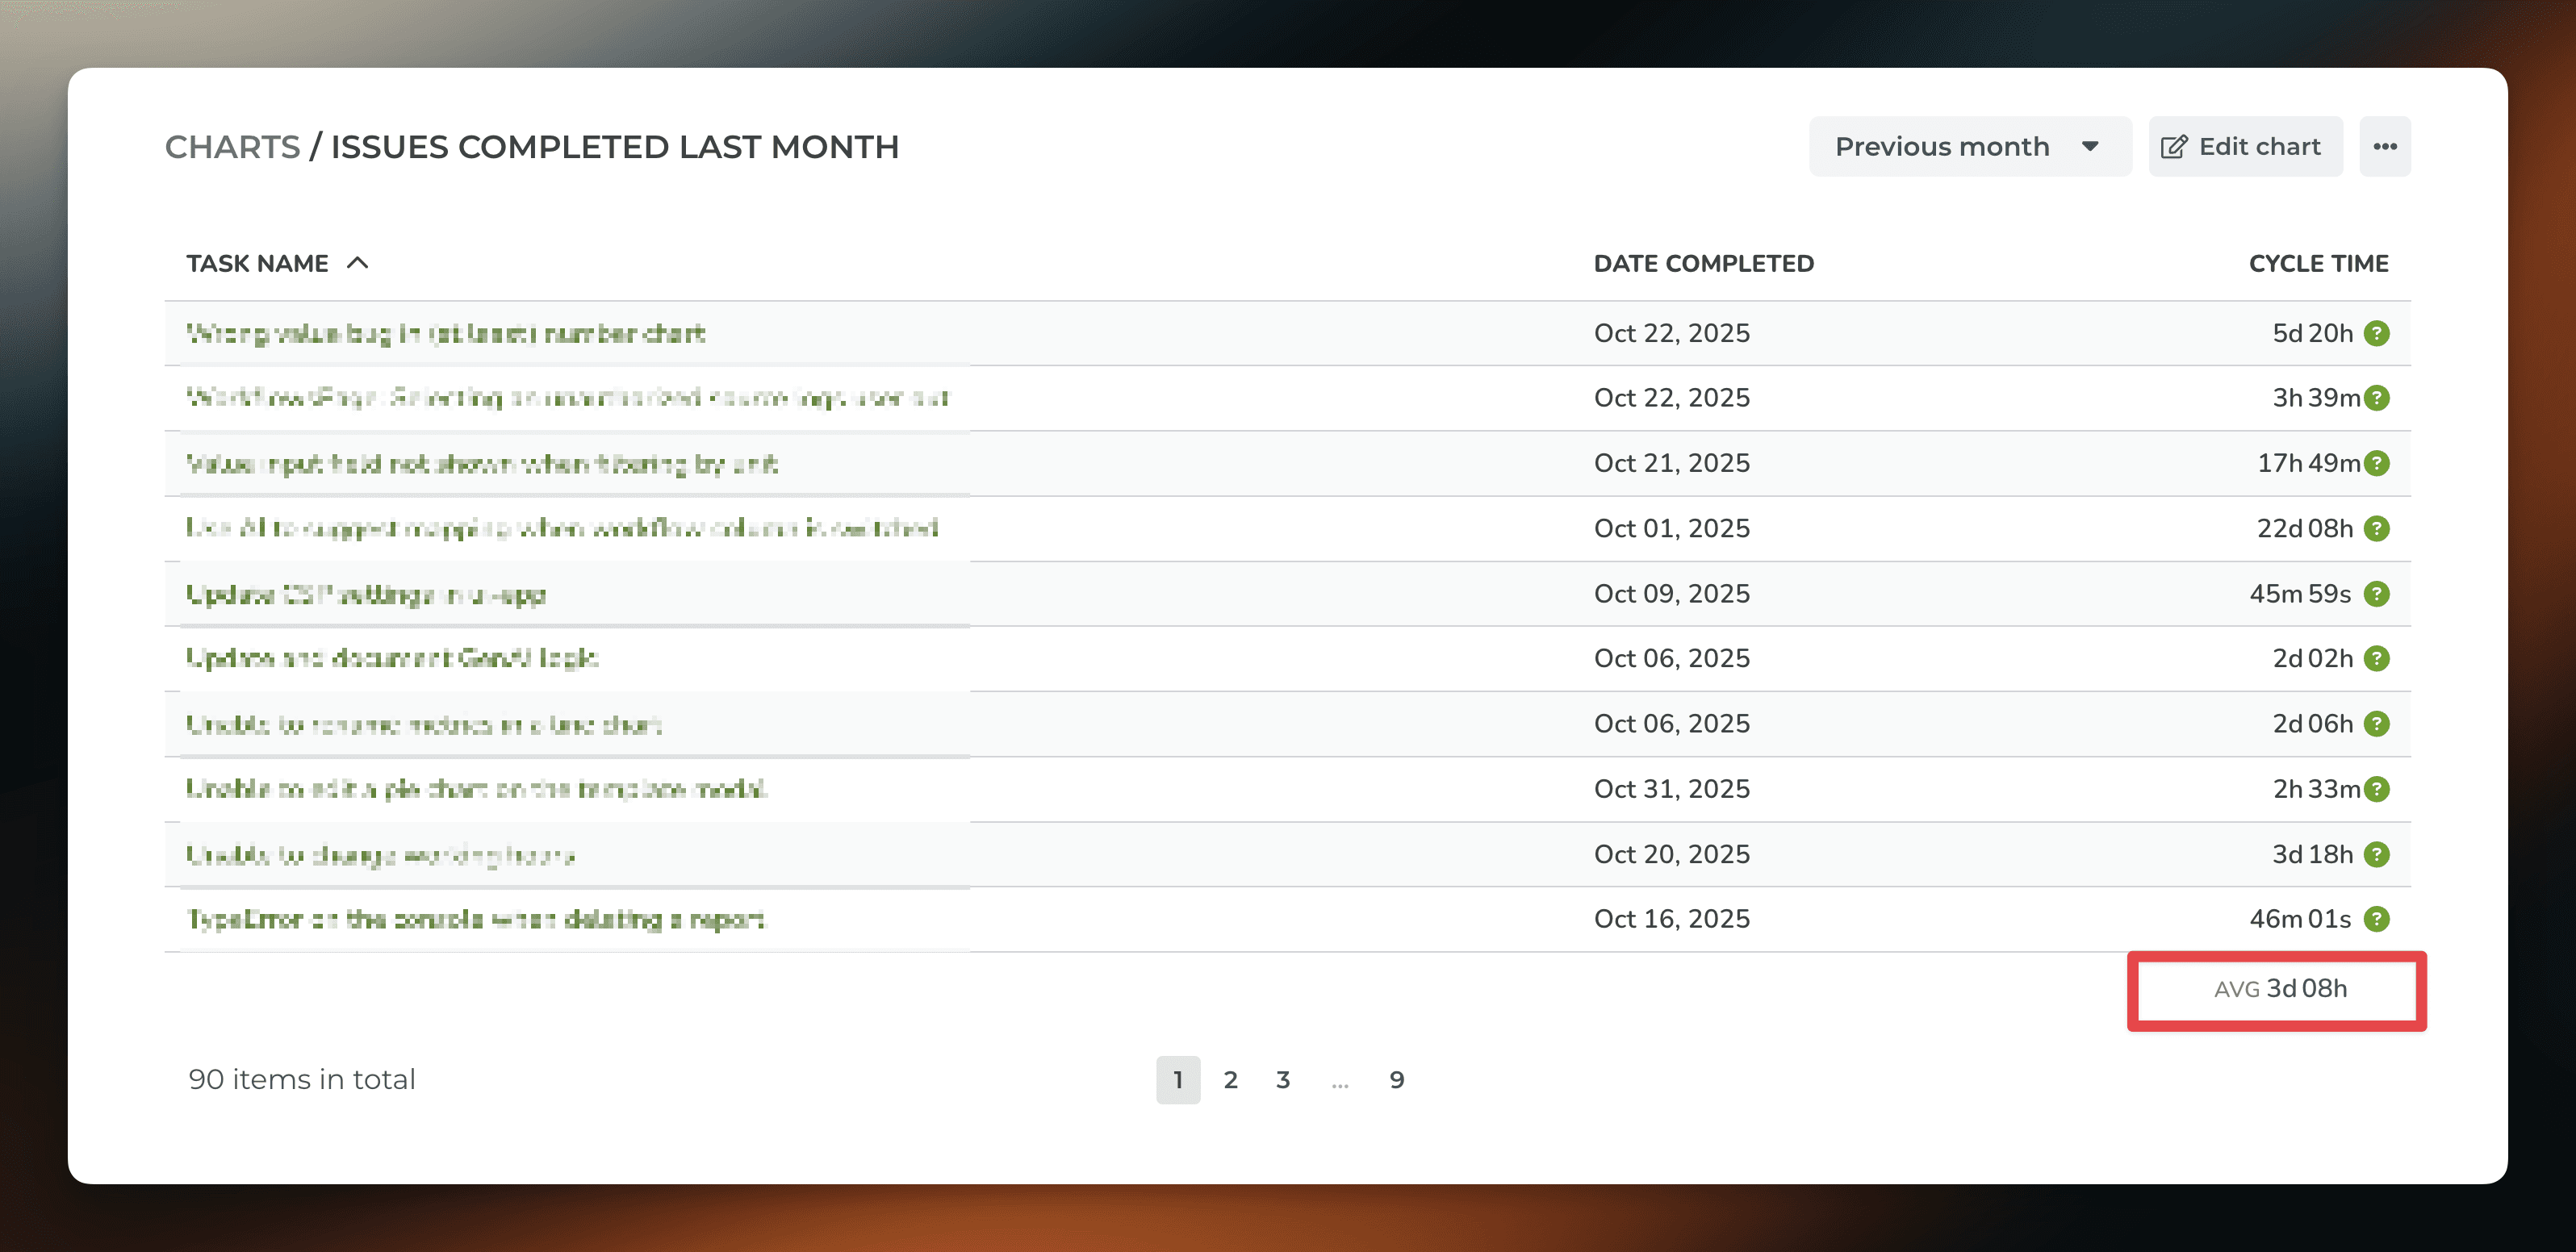
If you have added numerical columns to your reports such as estimates or story points, or financial data like budgets and costs, you can use the summary row to display the totals for the selected columns. That makes your reports much more powerful!
Learn more
Need help with setting up Screenful?
Book a call with our expert. Click here to schedule the onboarding call.
Screenful MCP server is coming soon
Use your Screenful project data inside your favorite AI tools. Join the waitlist.