Chart Templates
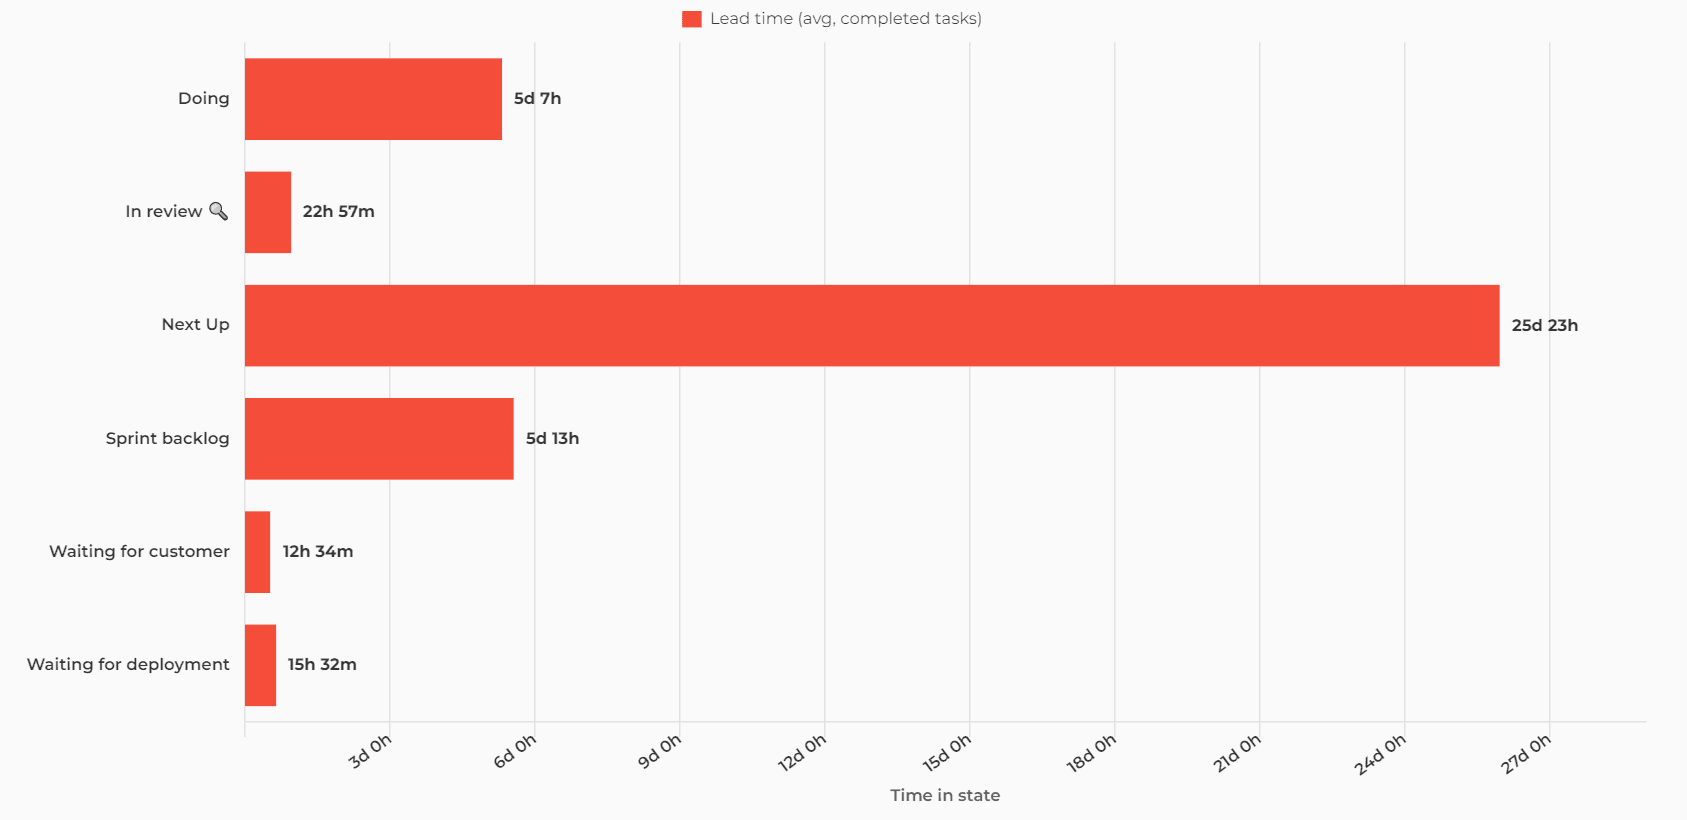
Average time spent by workflow state
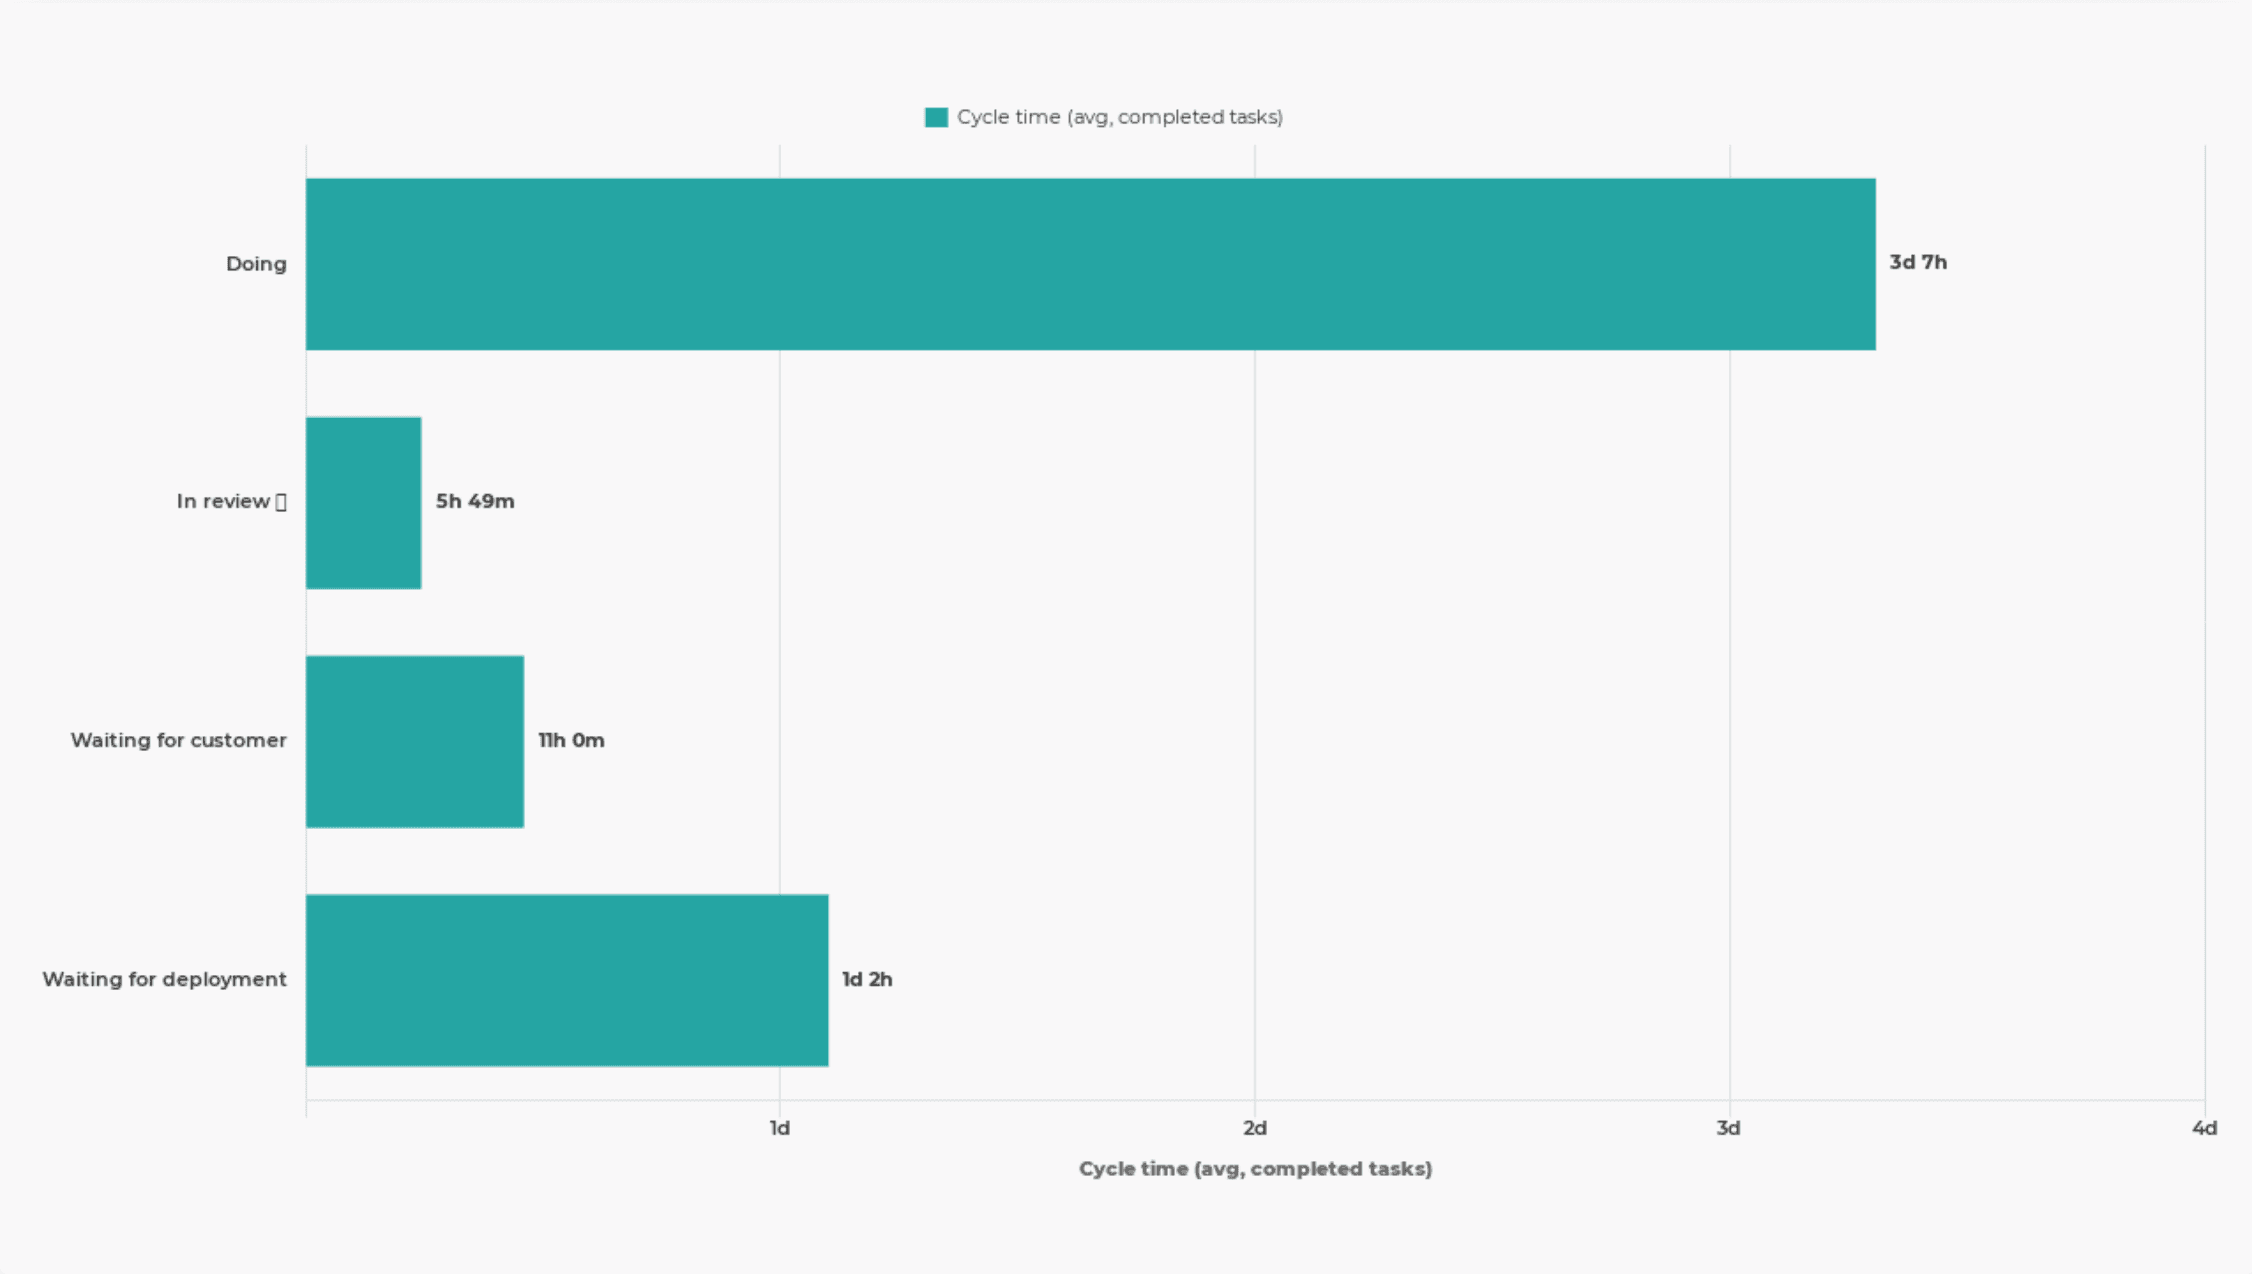
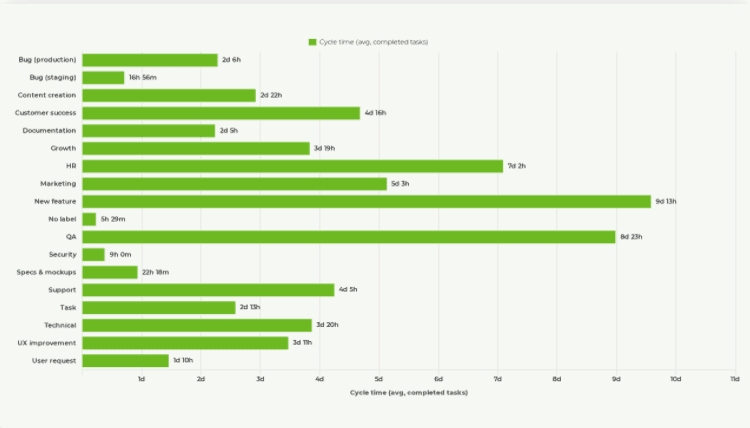
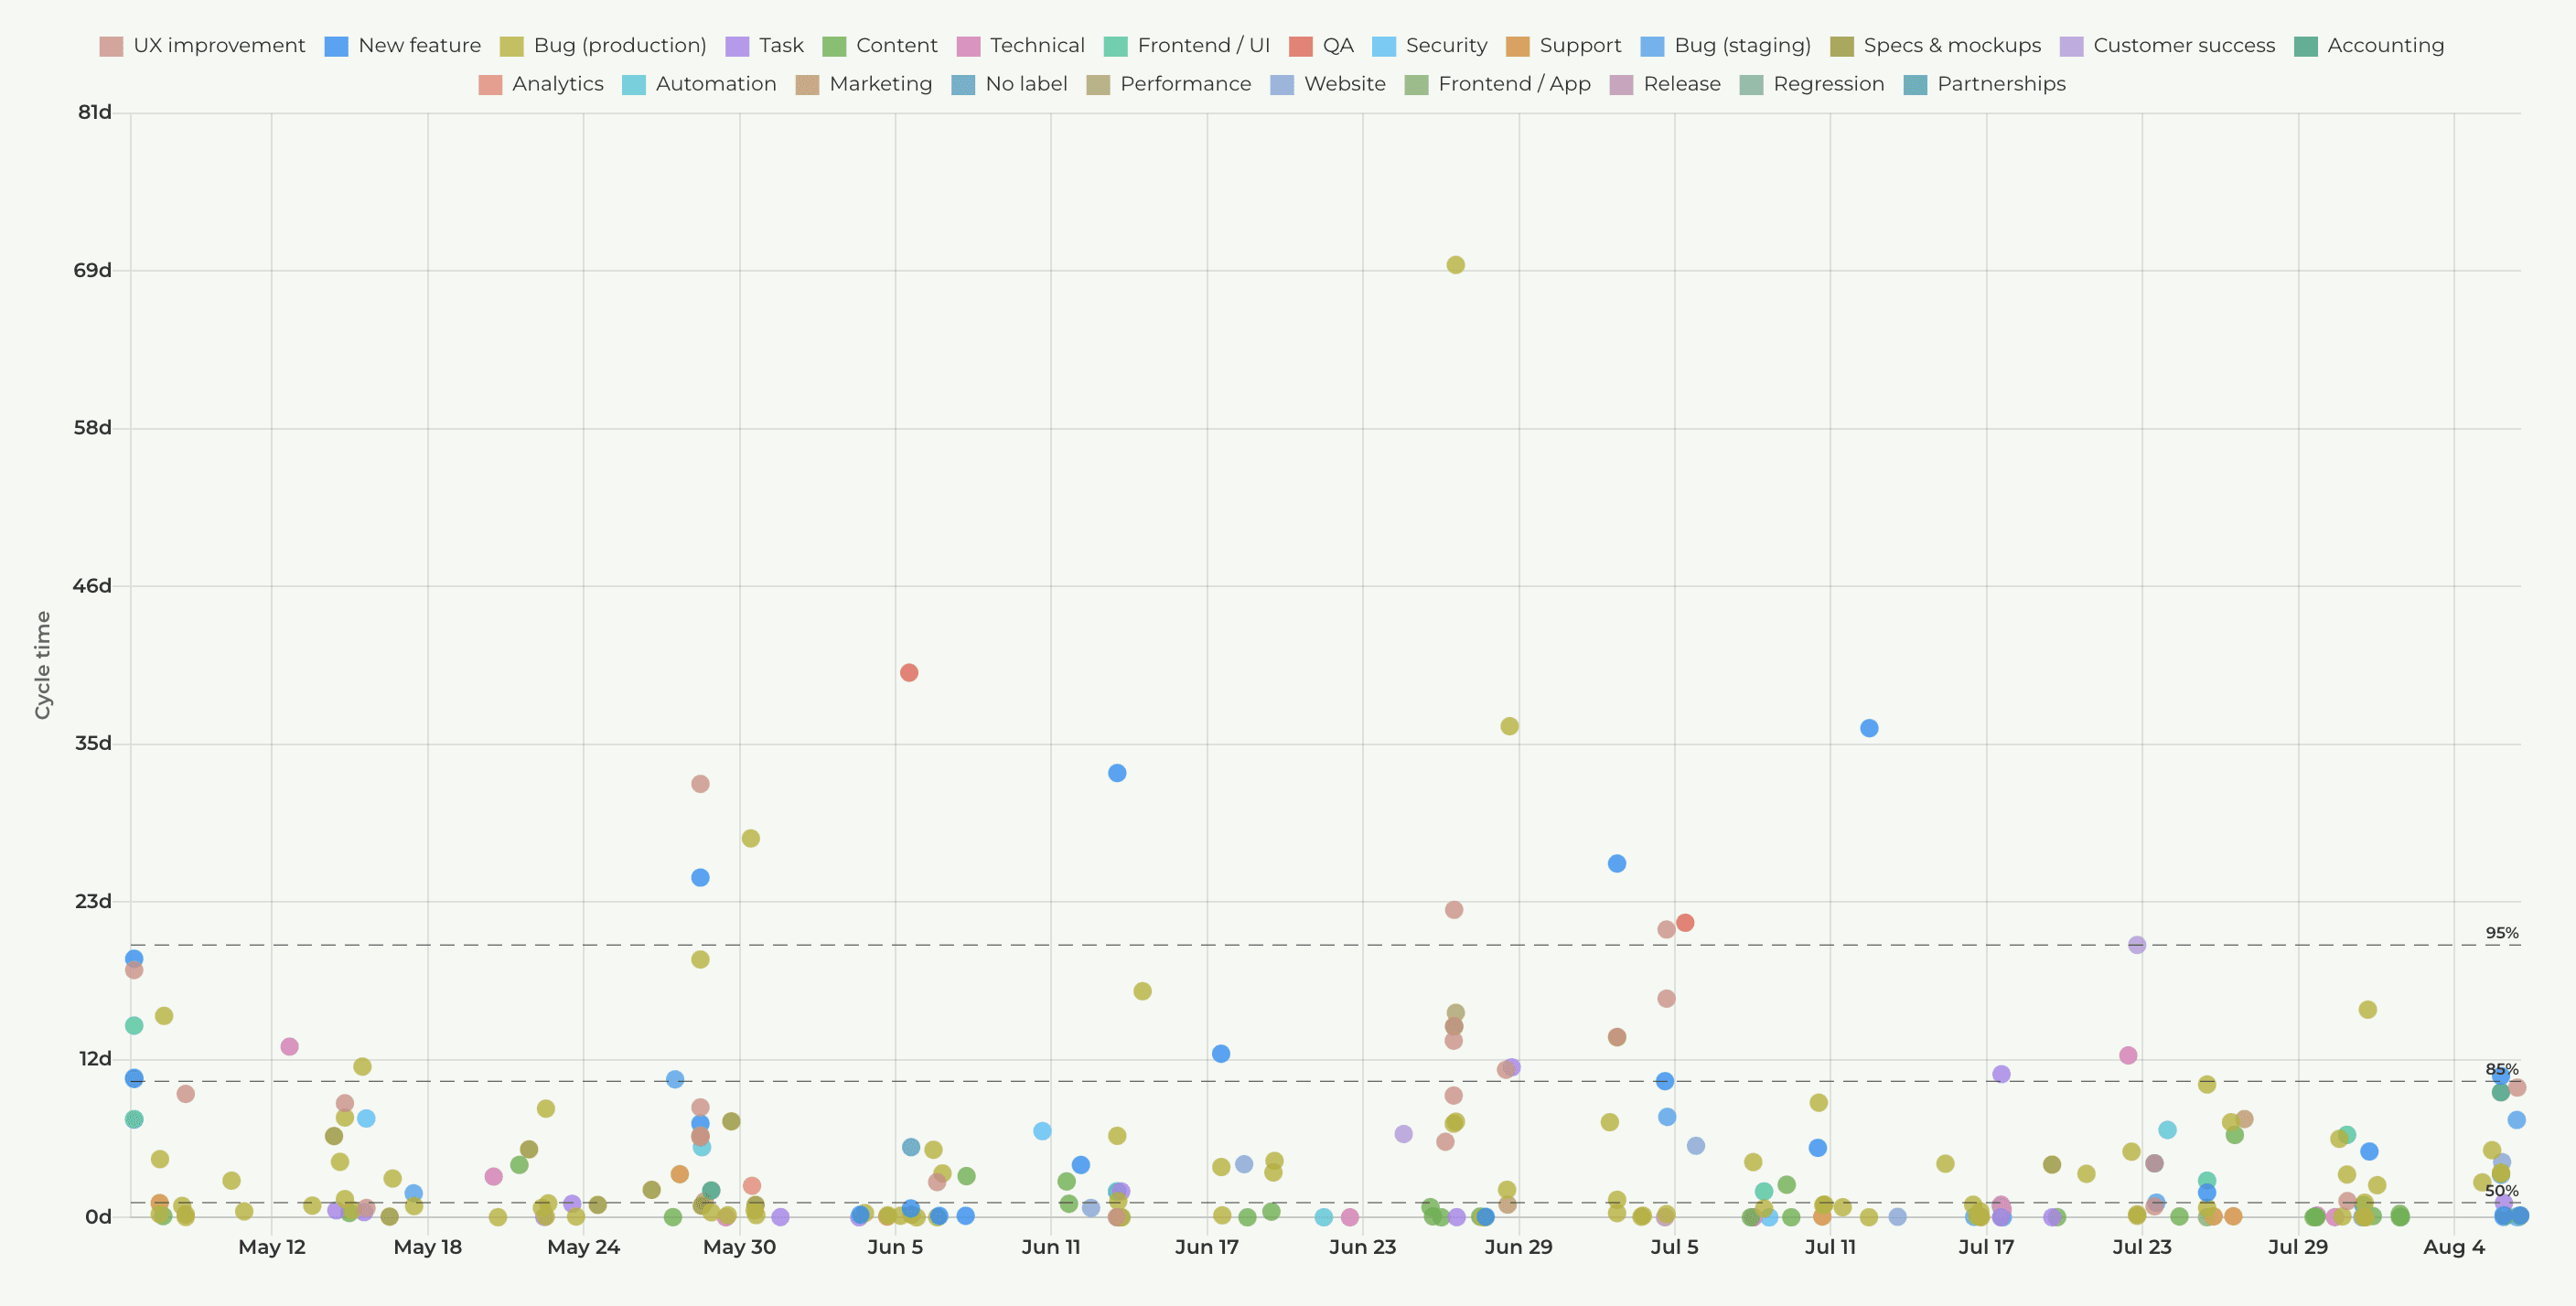
Cycle time per workflow state
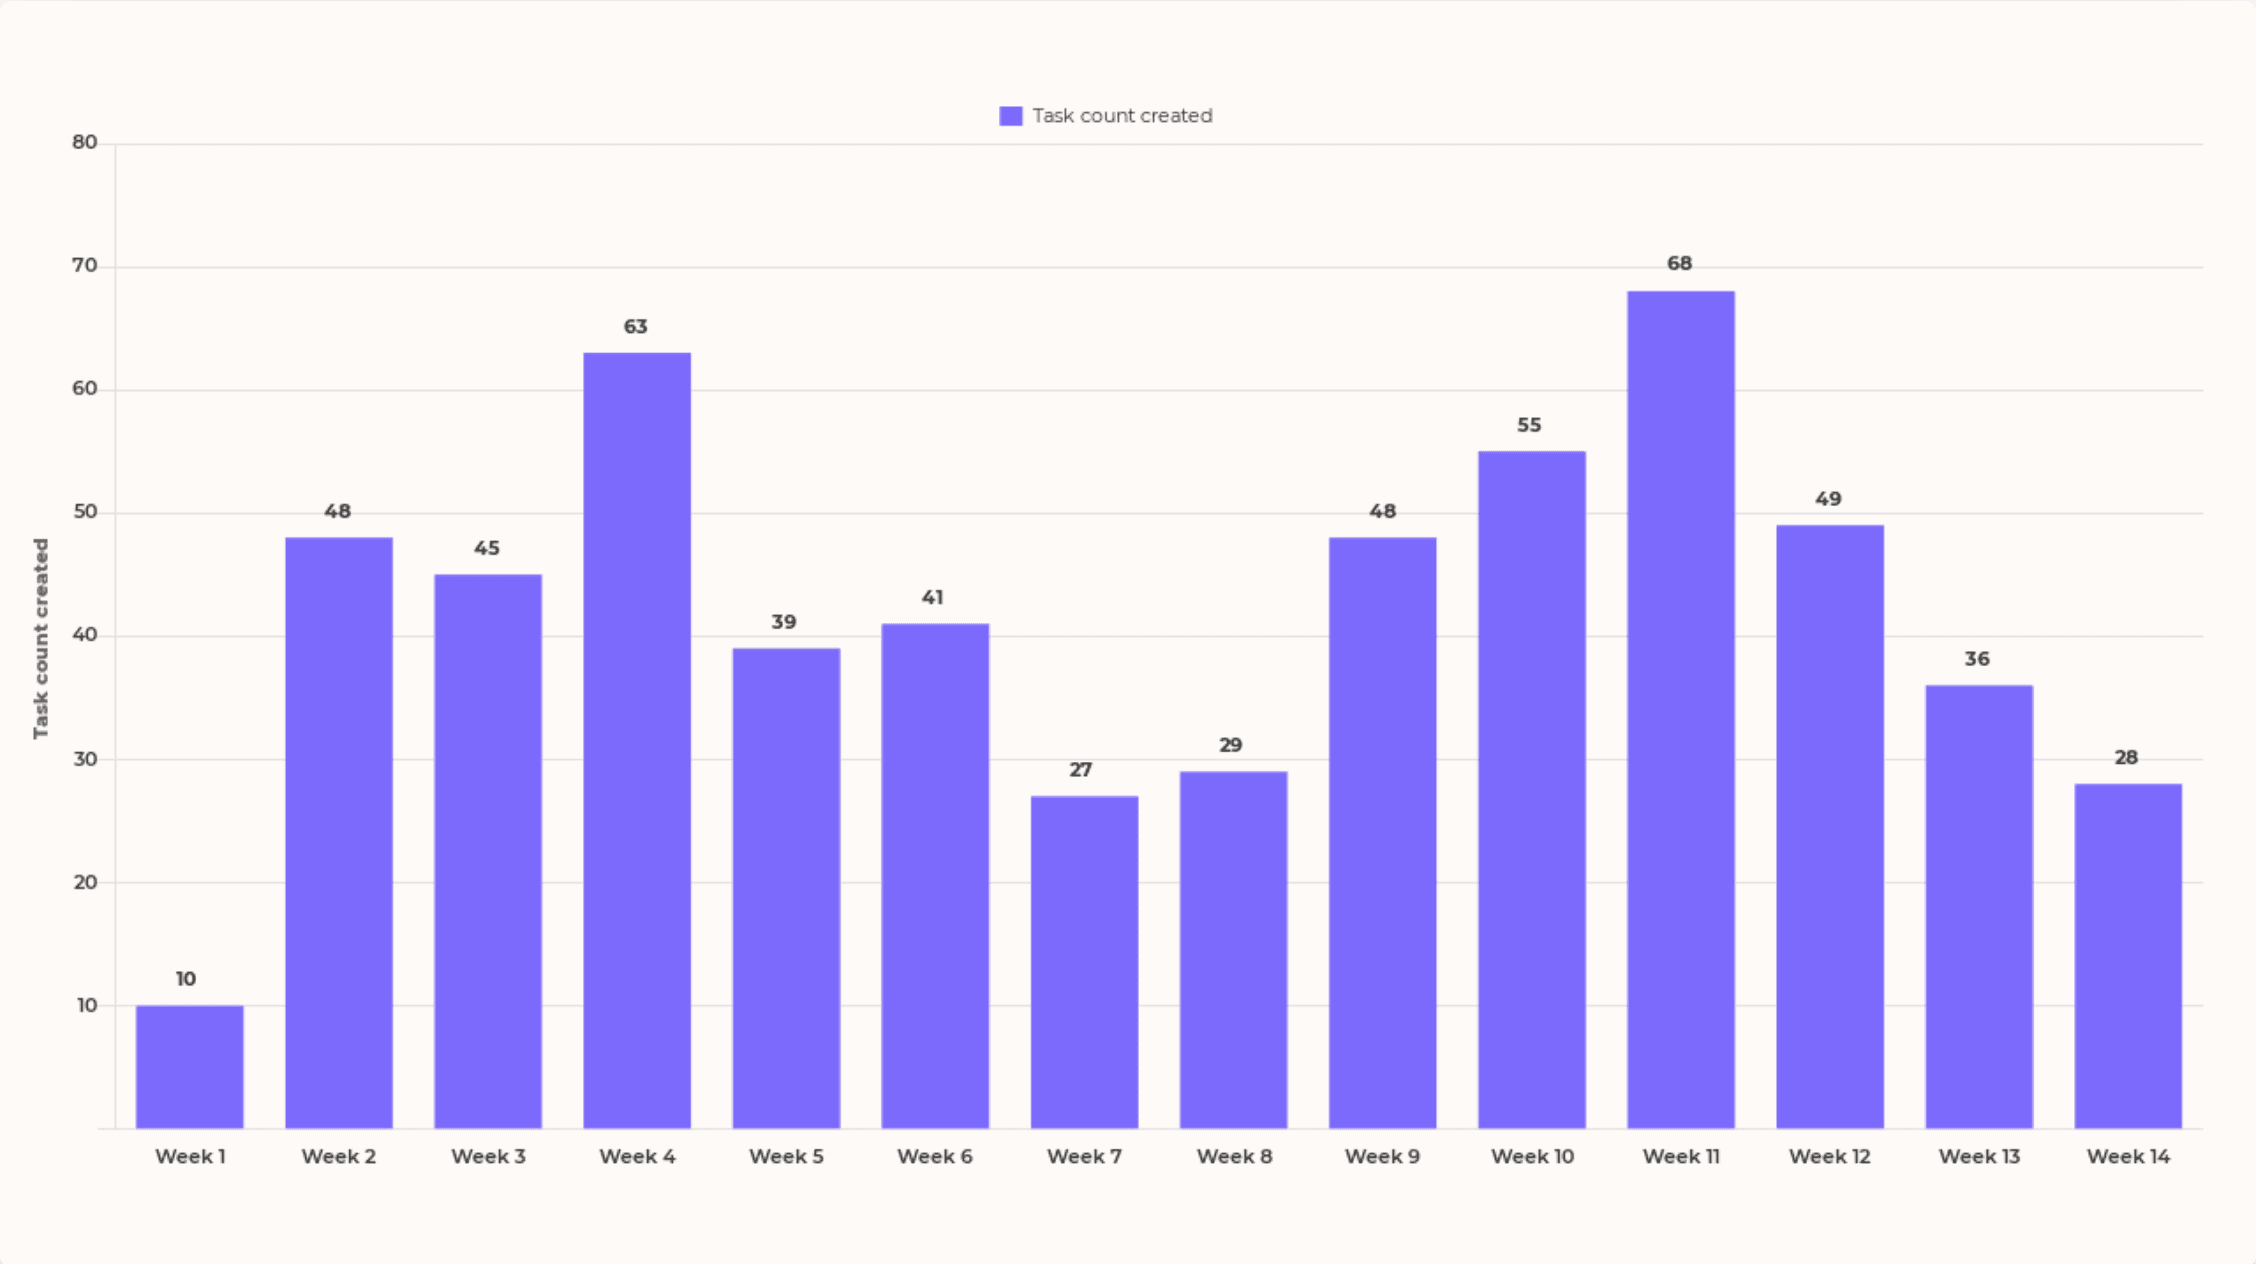
New tasks created per week
Quarterly breakdown

Monthly breakdown
Weekly breakdown
Open tasks per assignee
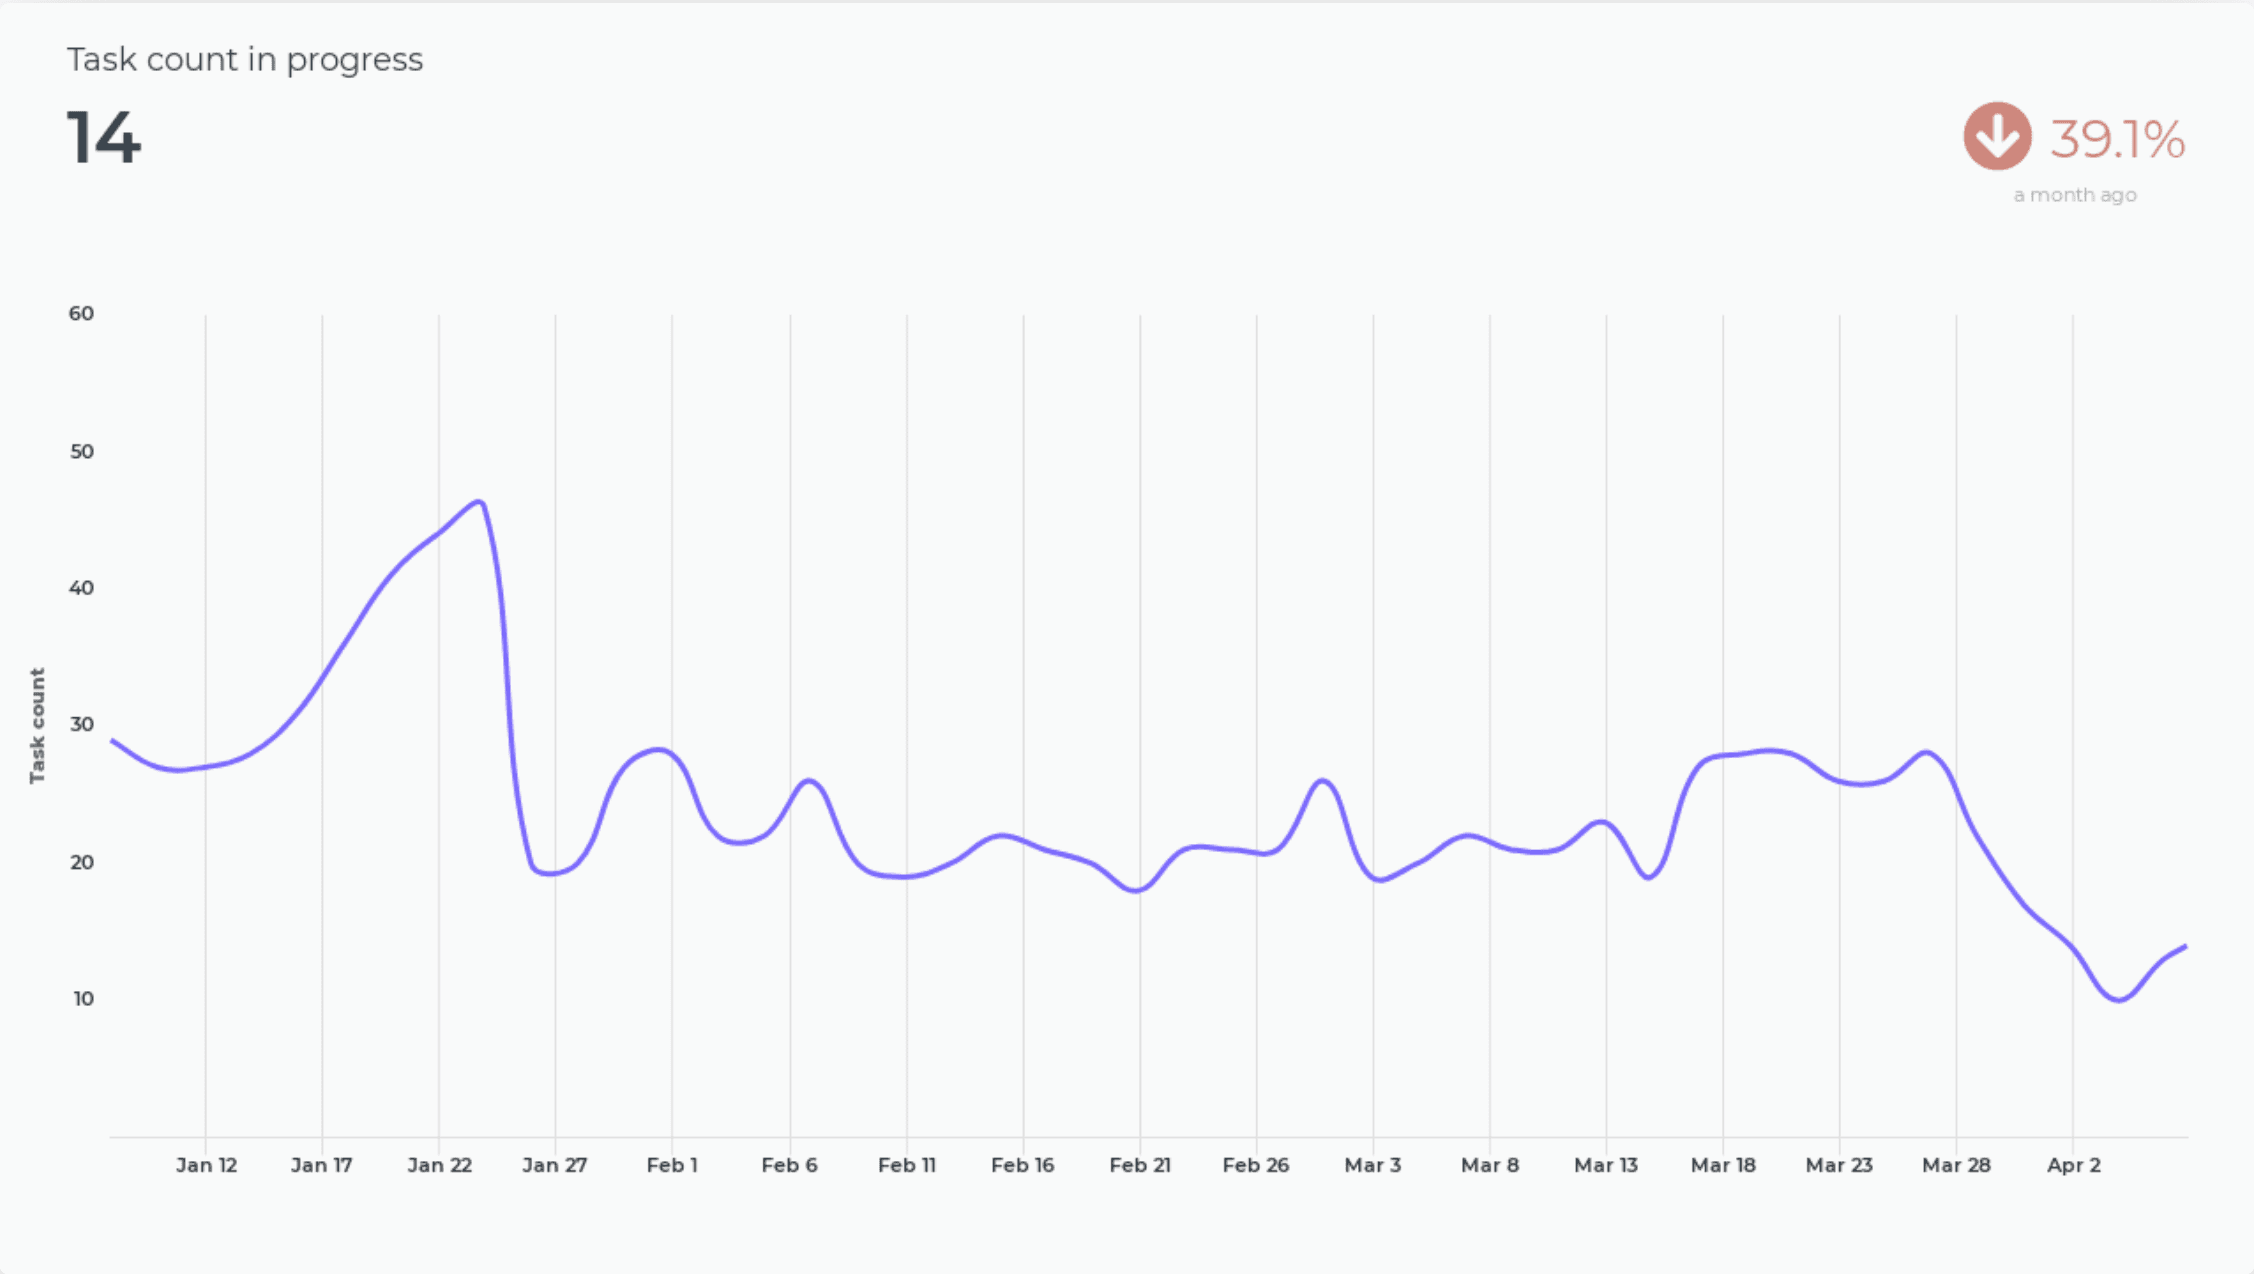
Tasks count in progress
Open tasks by workflow state
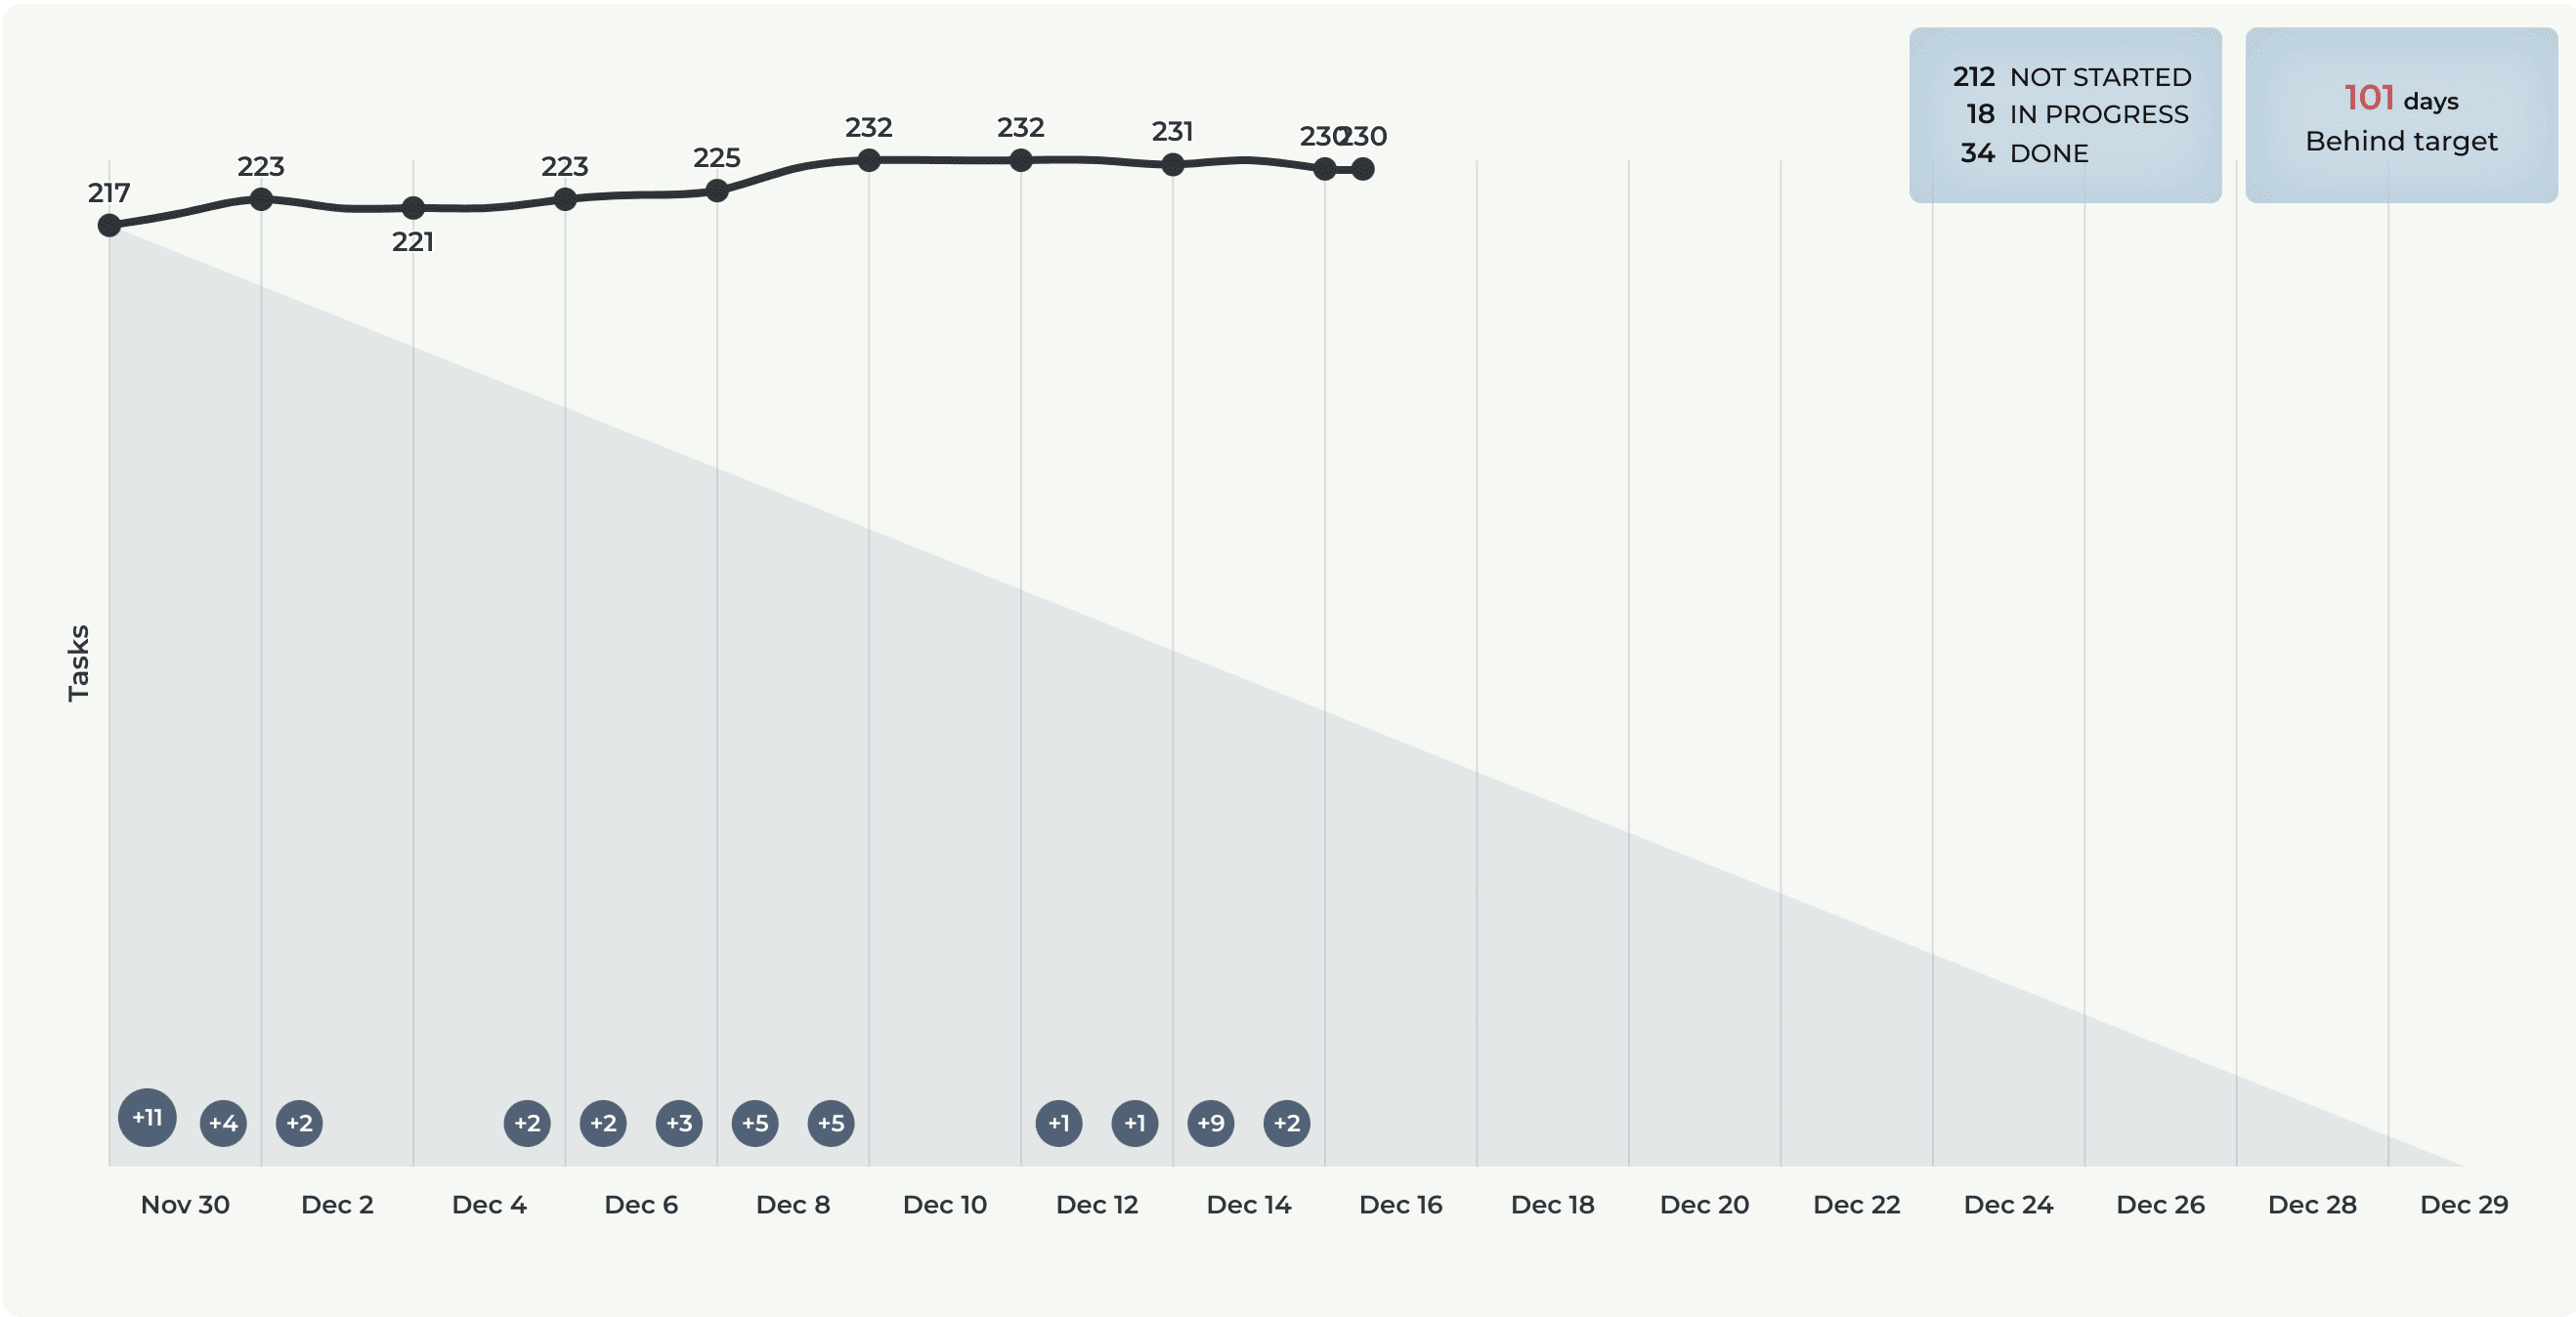
Burndown chart
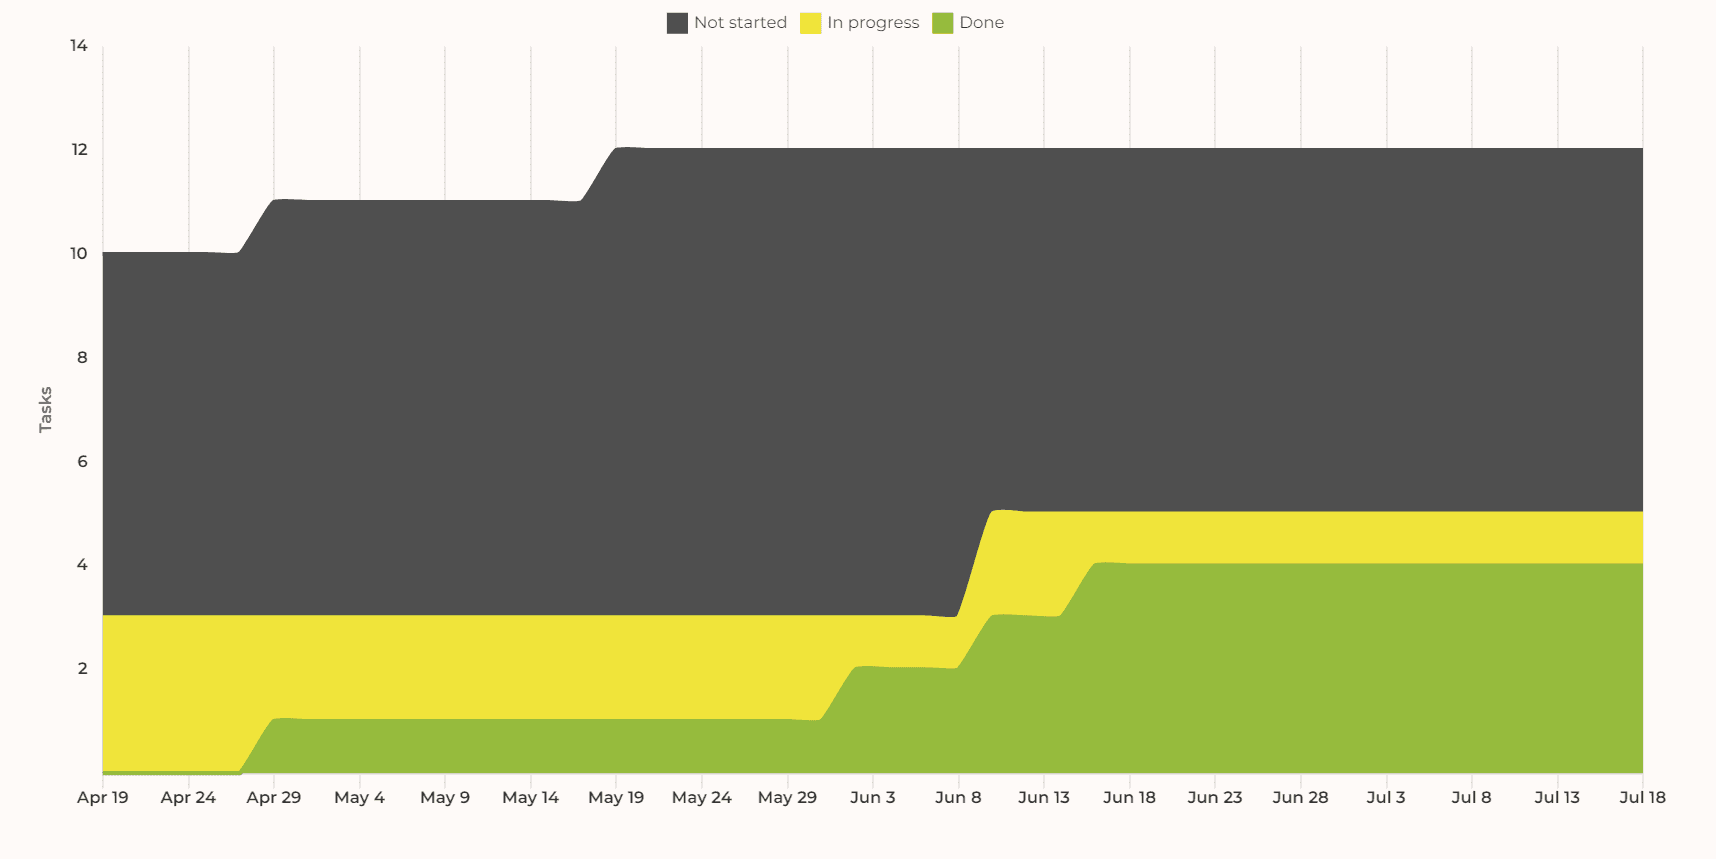
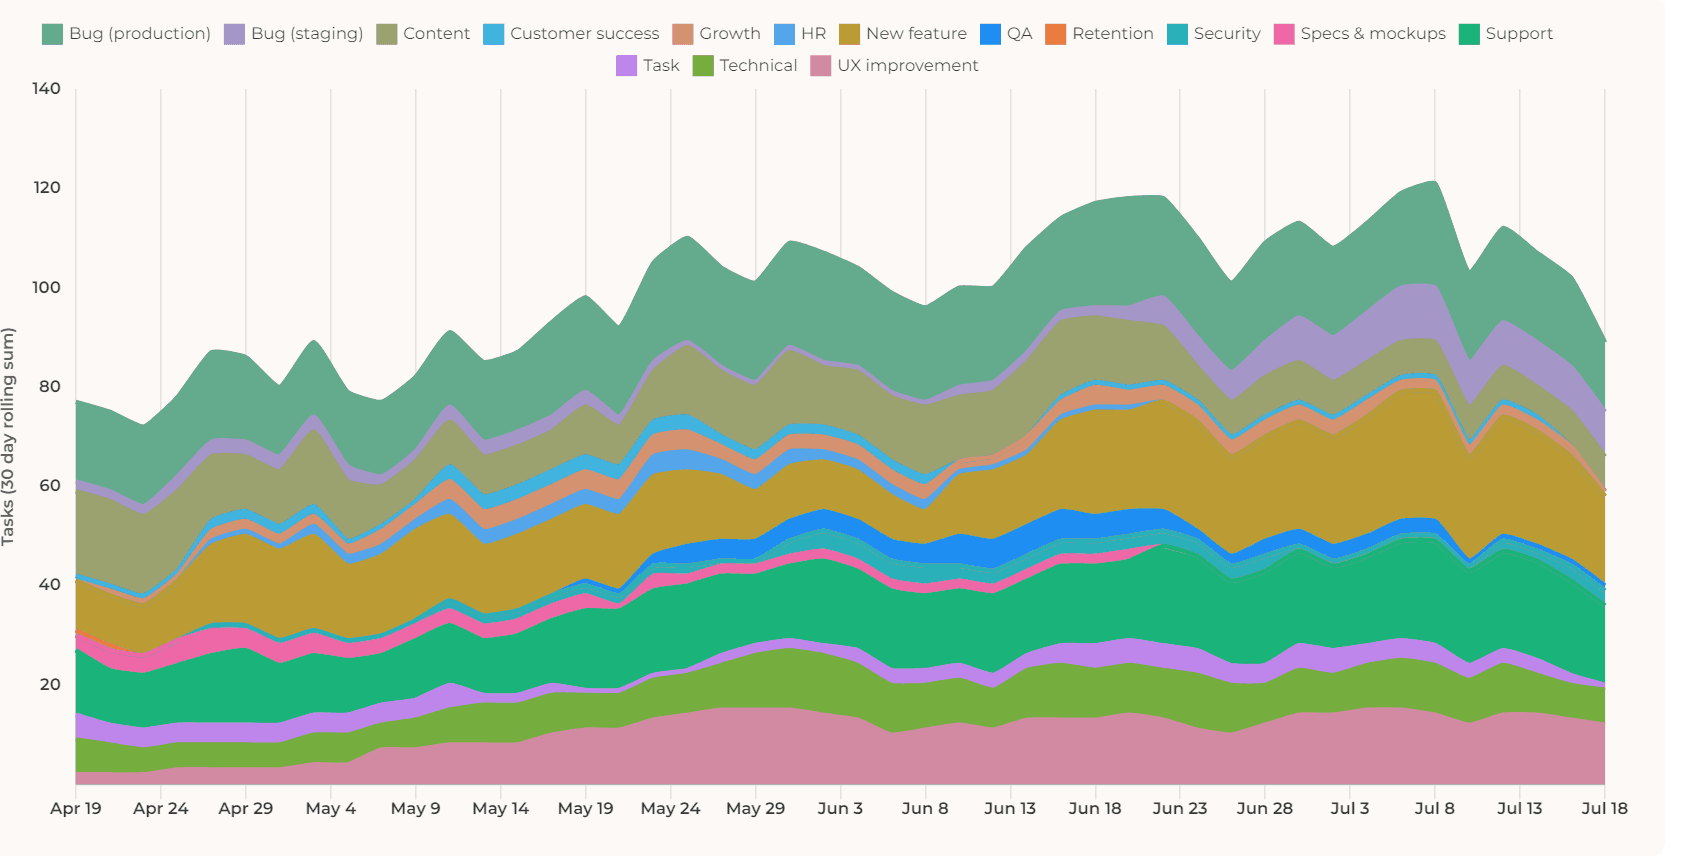
Cumulative flow diagram
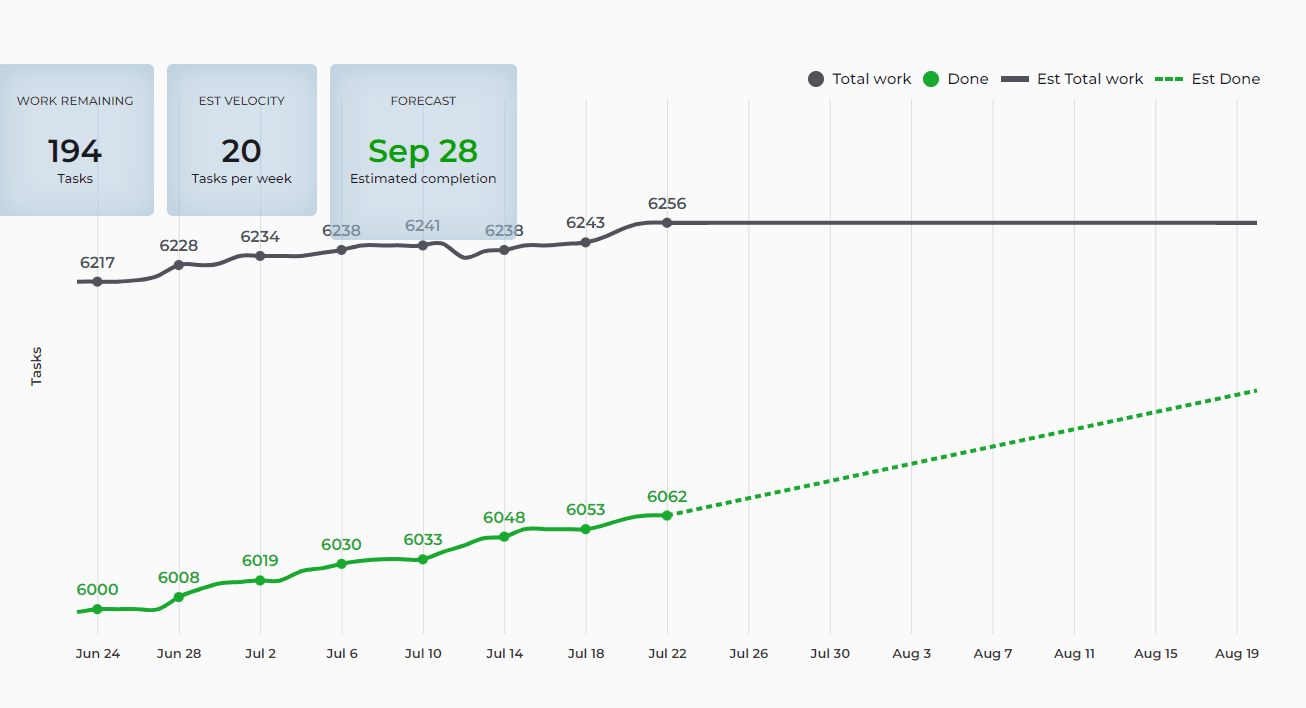
Forecasting
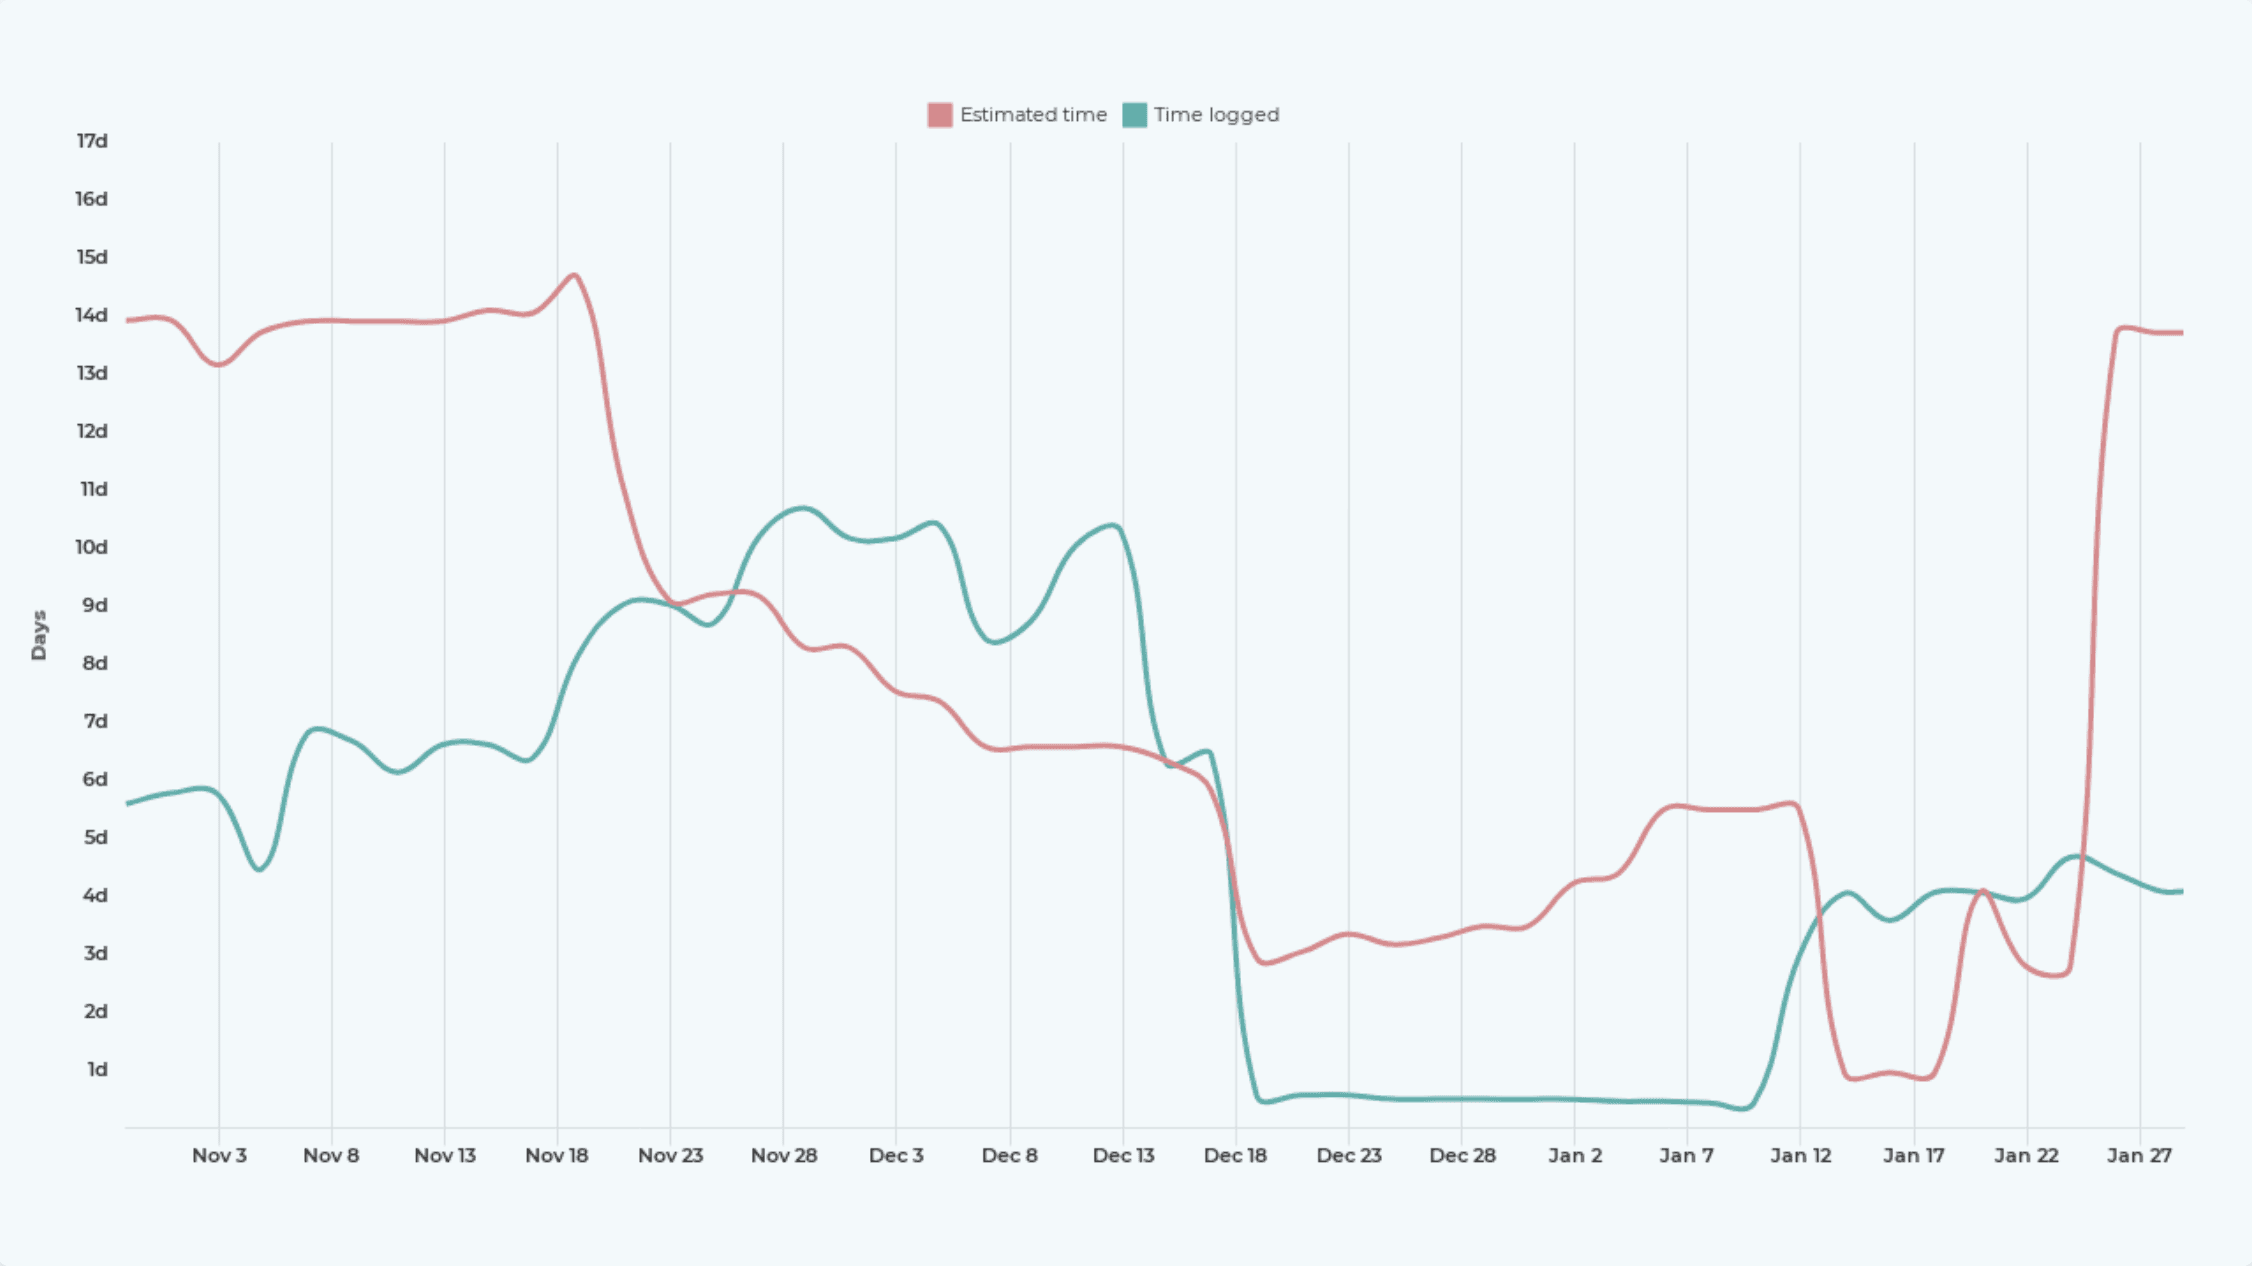
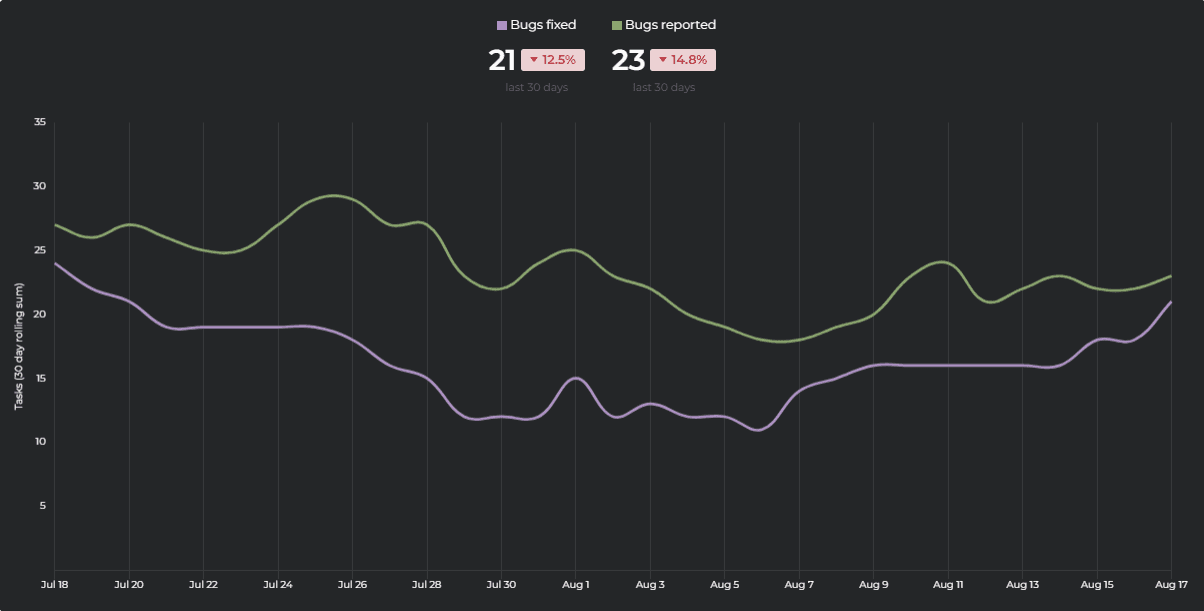
Lead time and cycle time trends
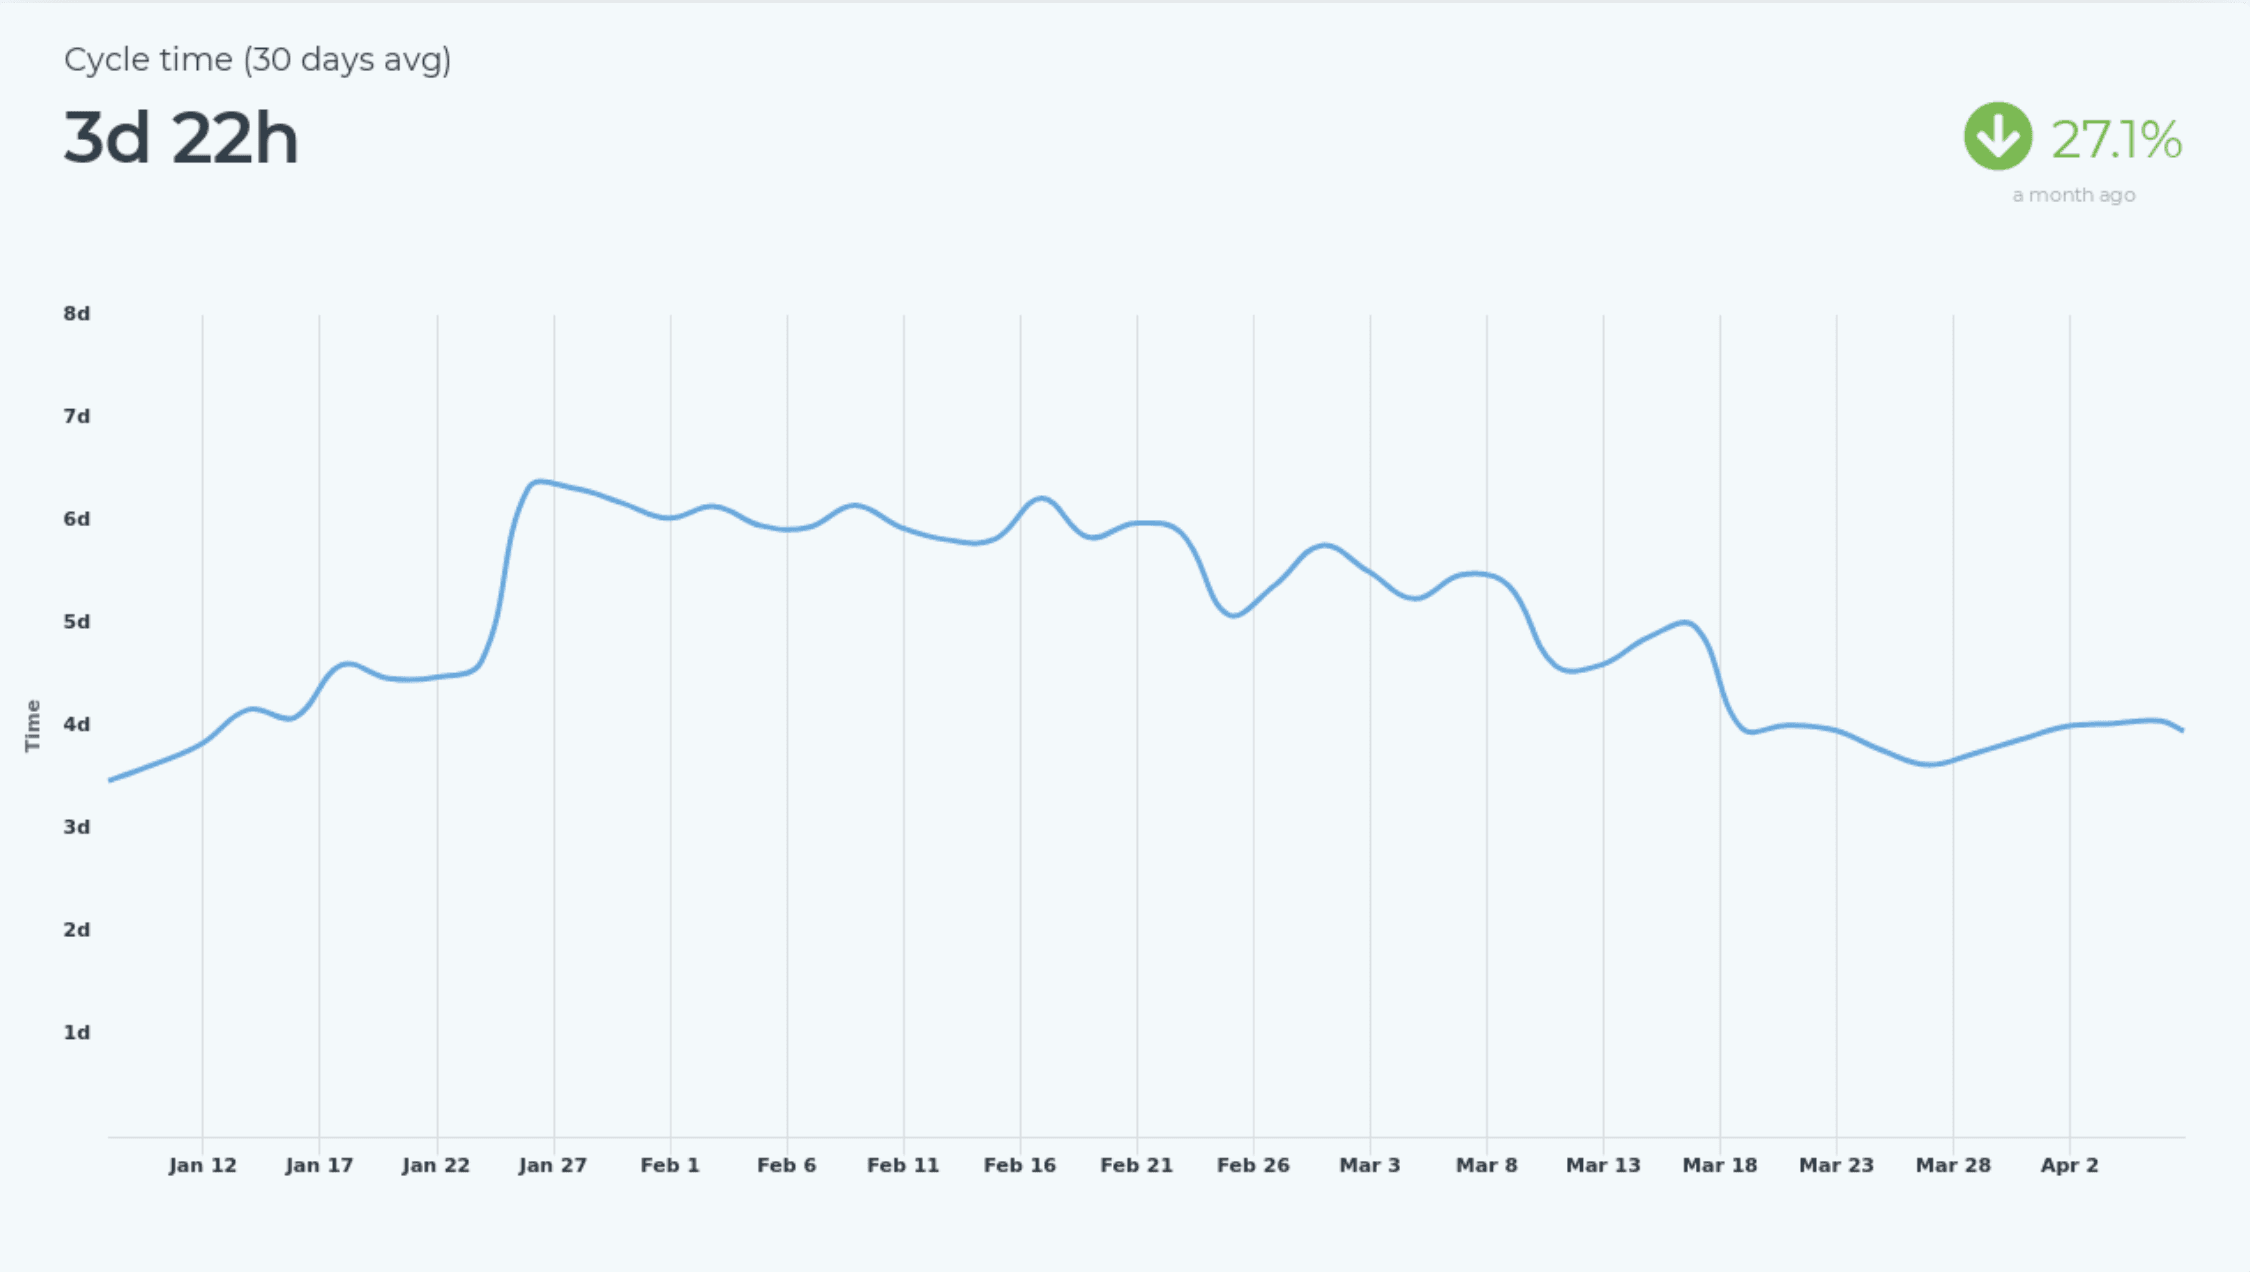
Cycle time trend
Work in progress (WIP)
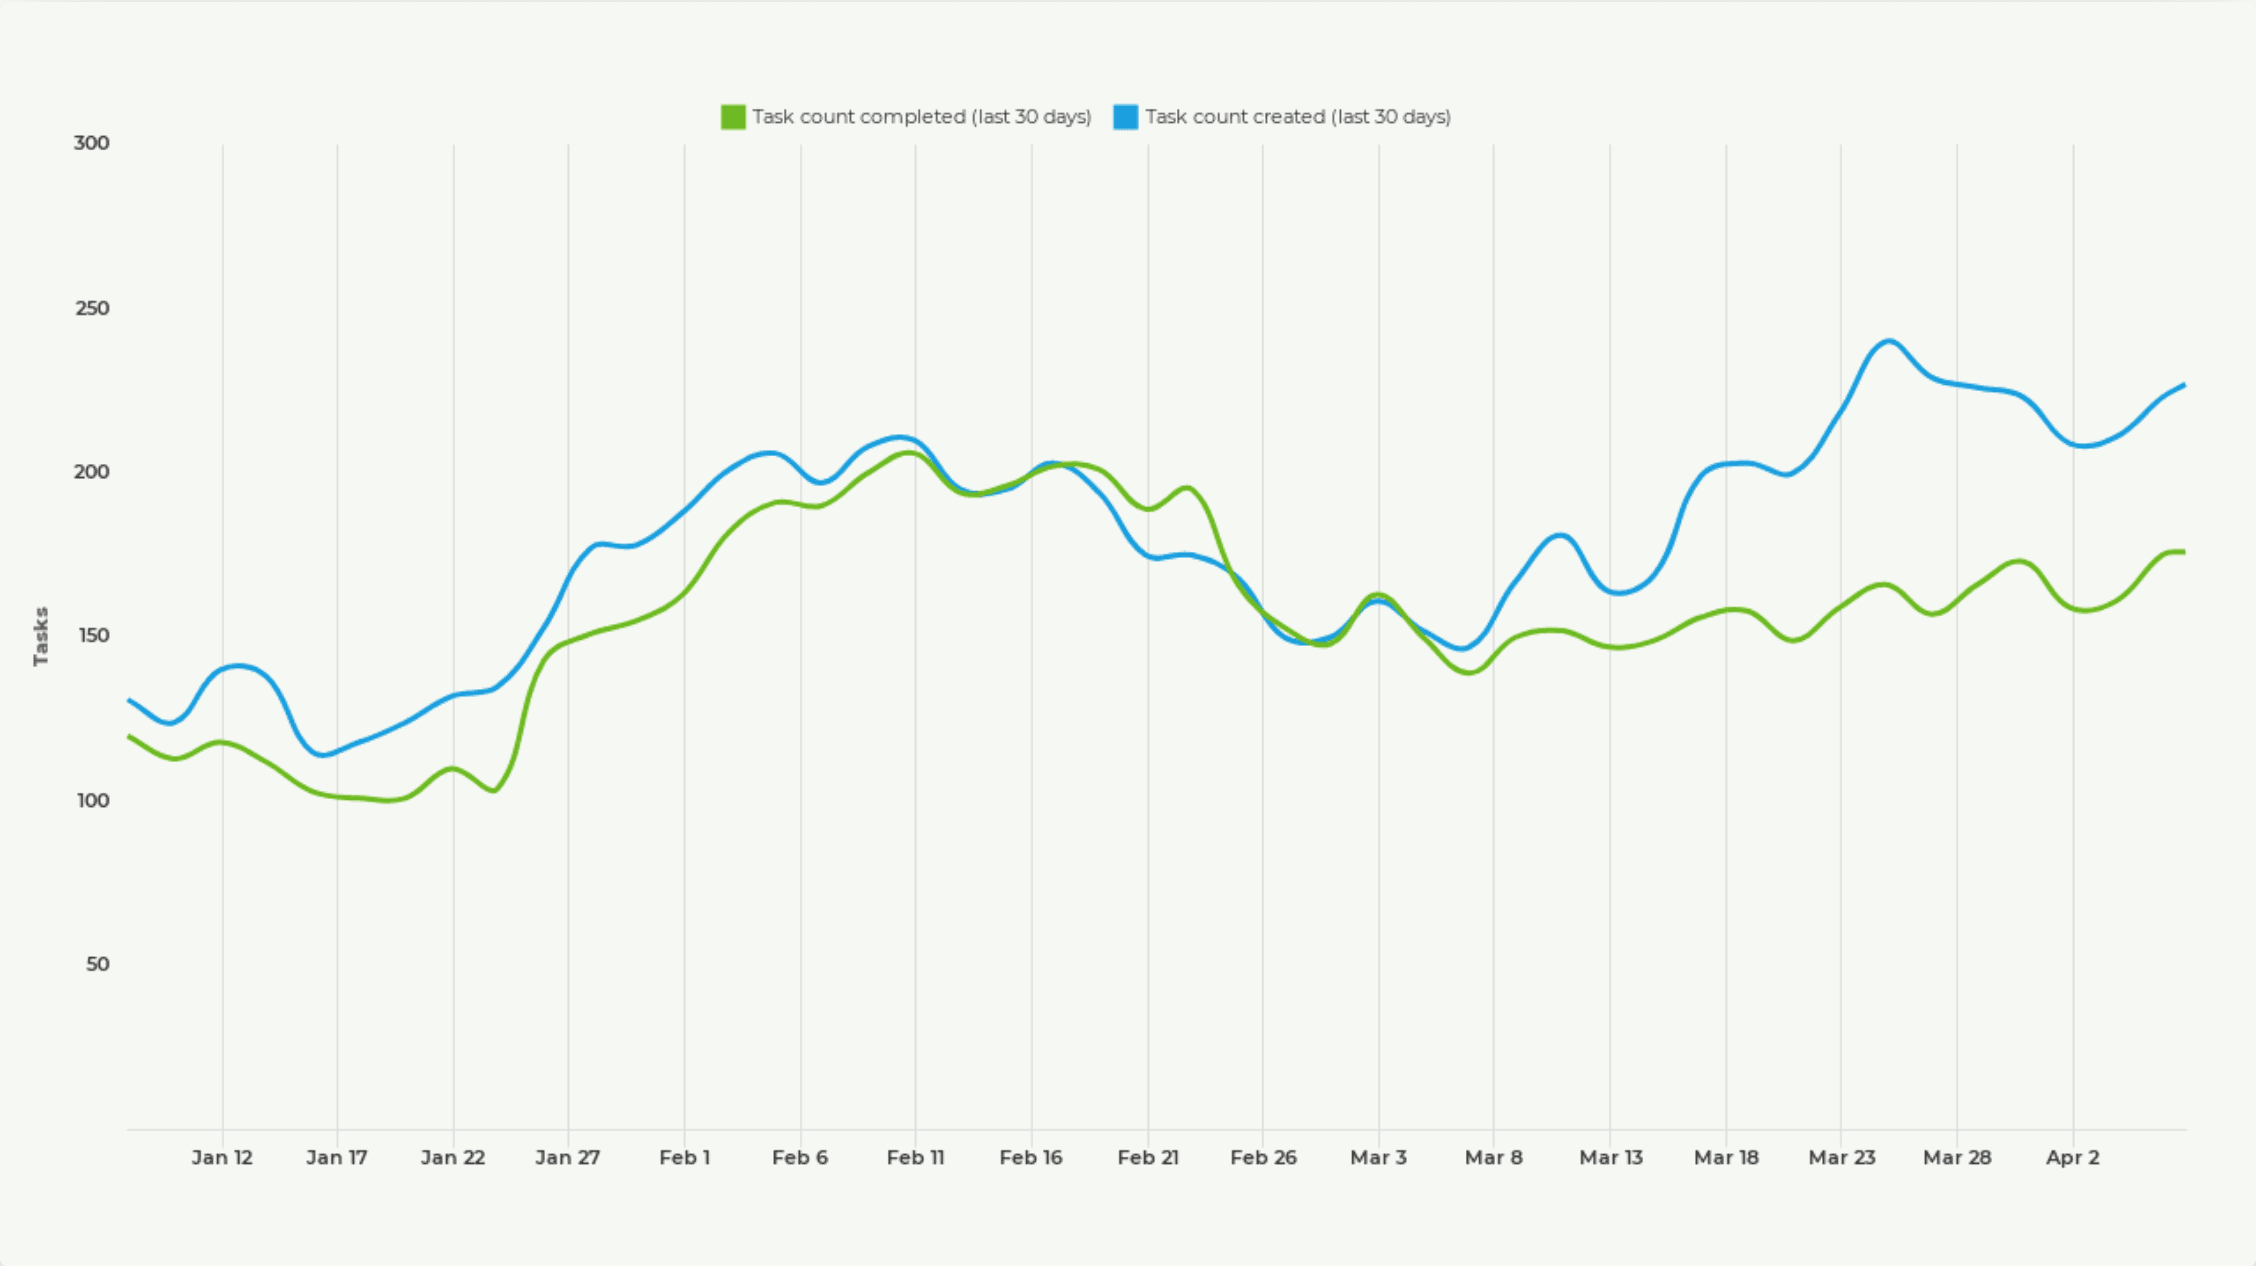
Created vs completed
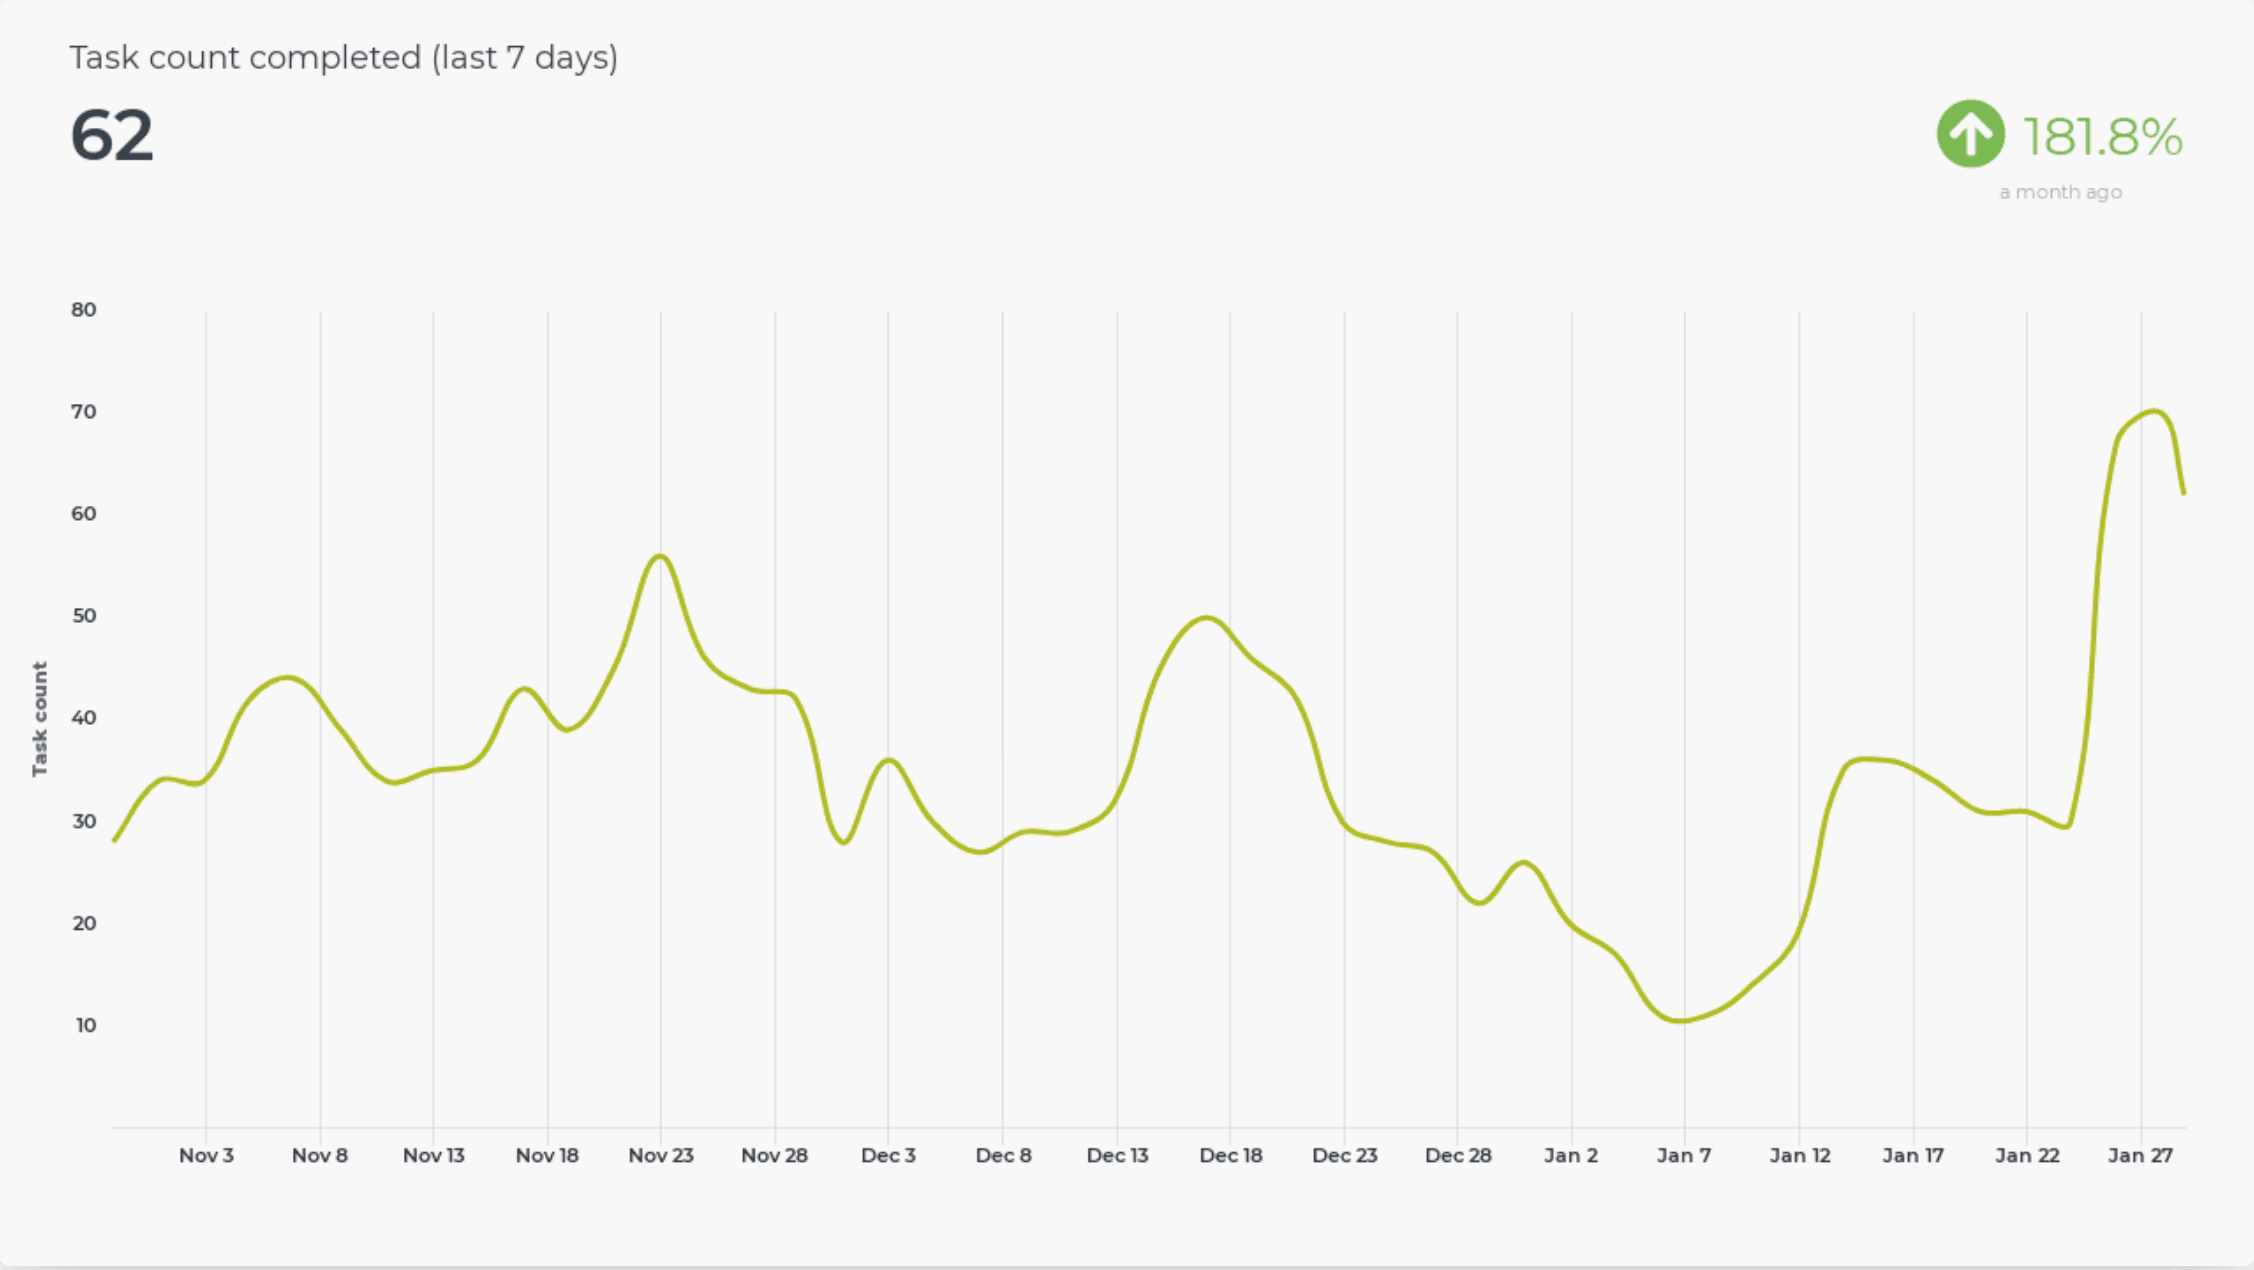
Completed tasks trend
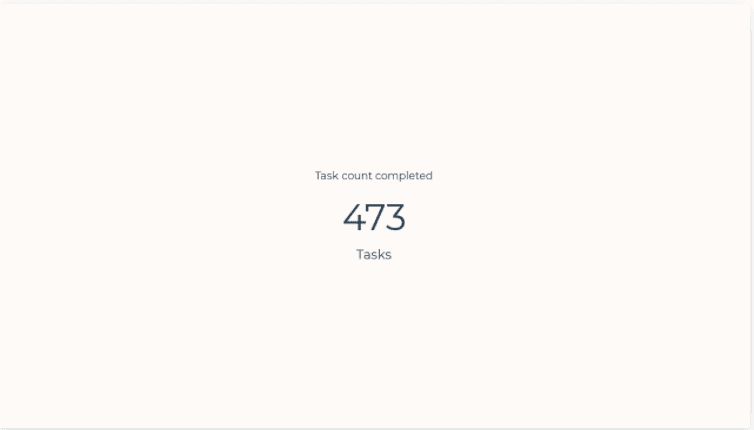
Work done
Time to complete a task
Completed work trend
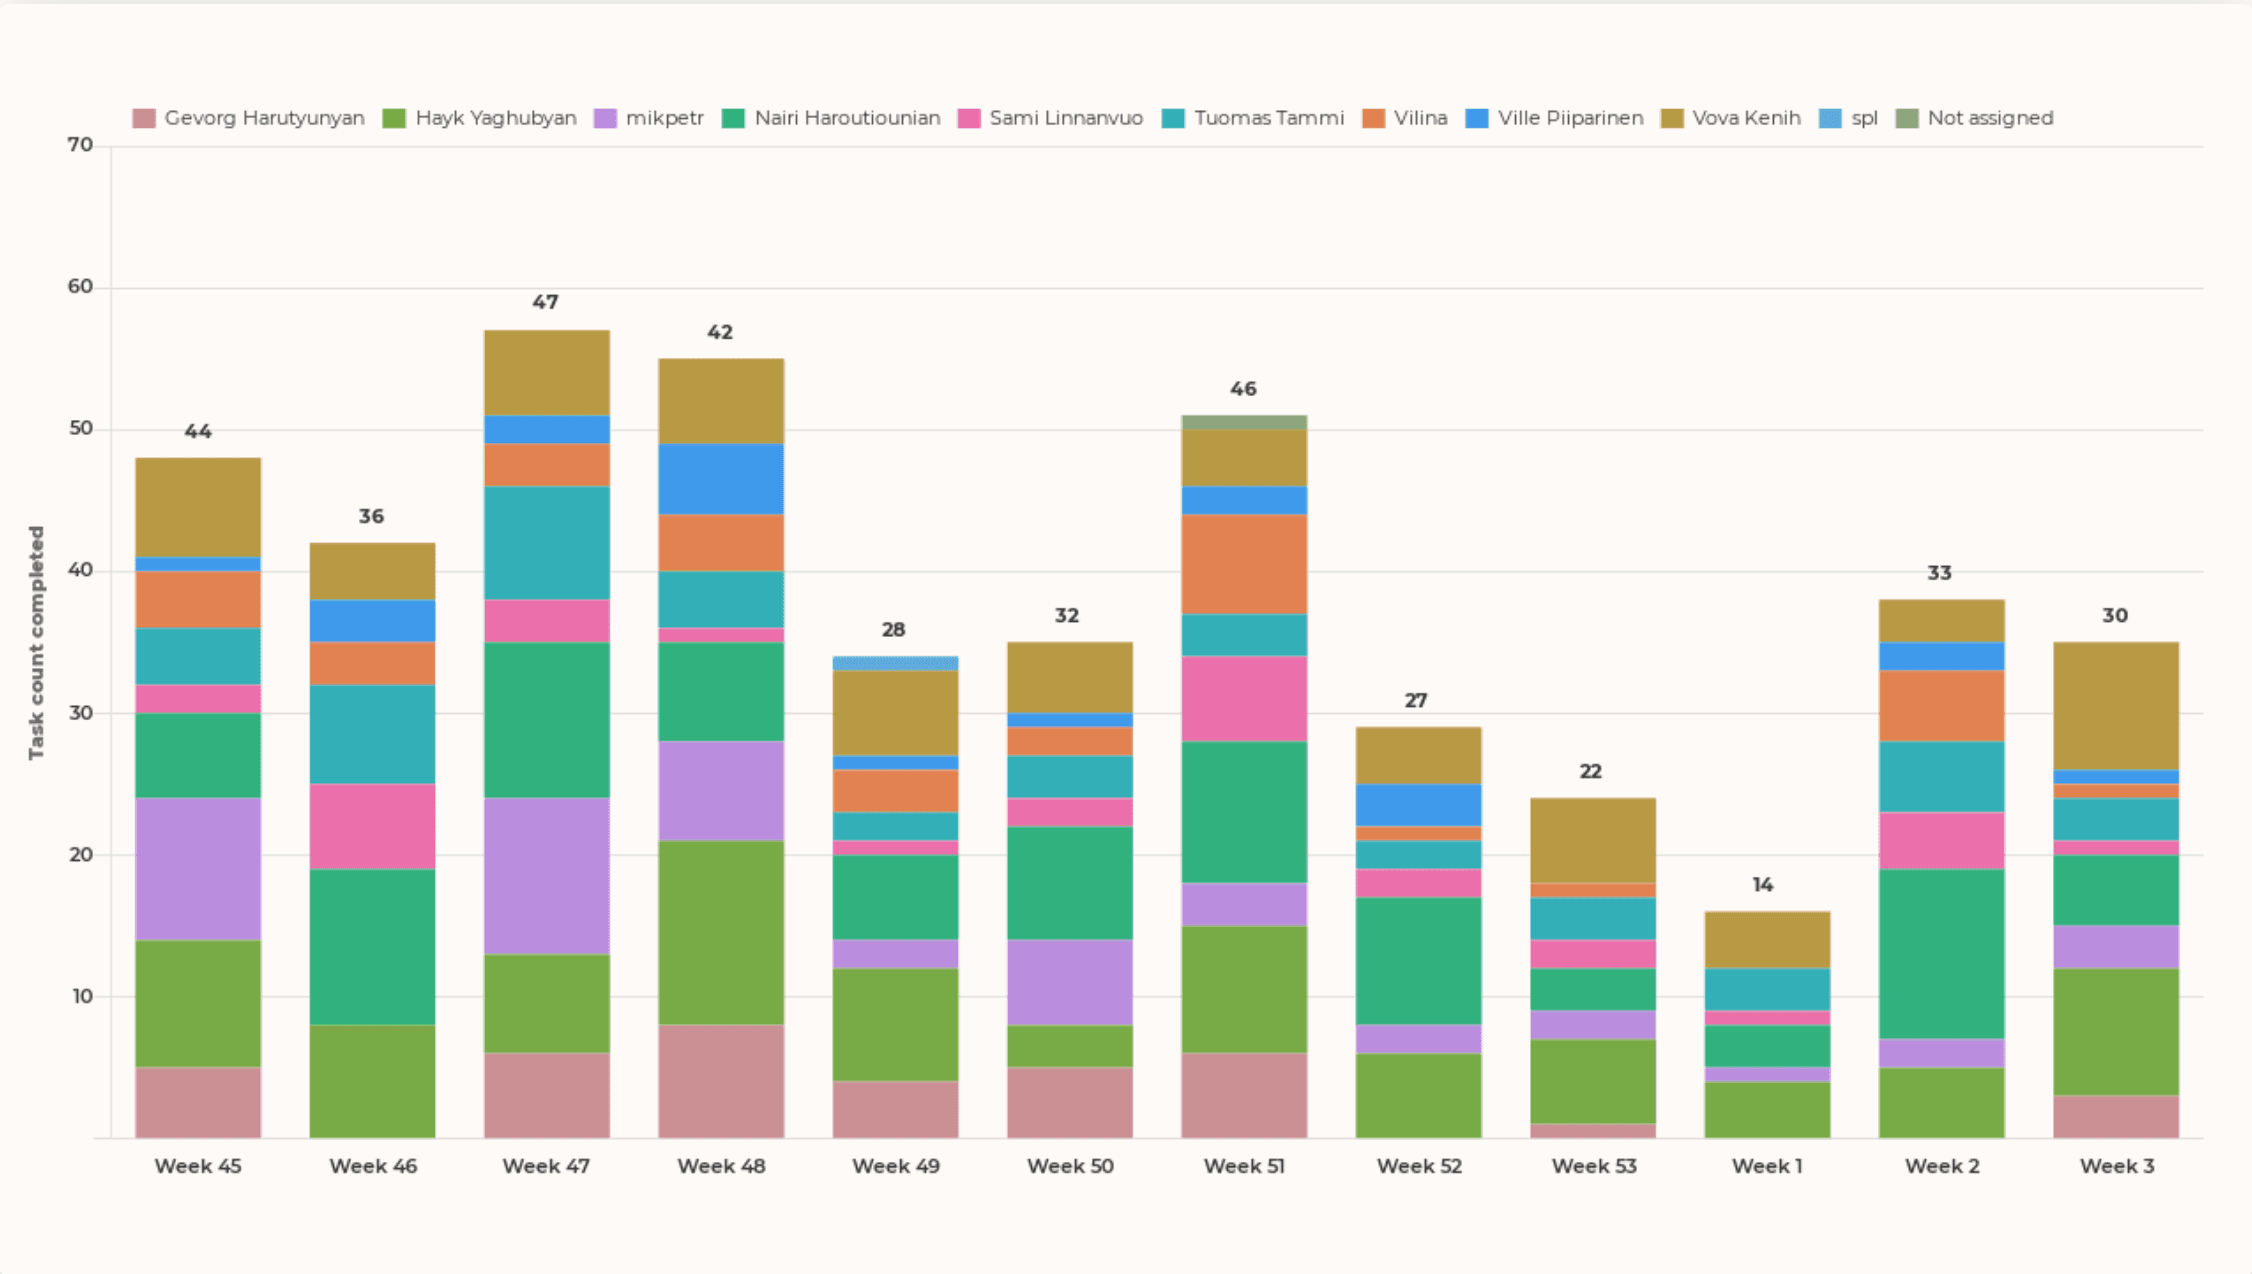
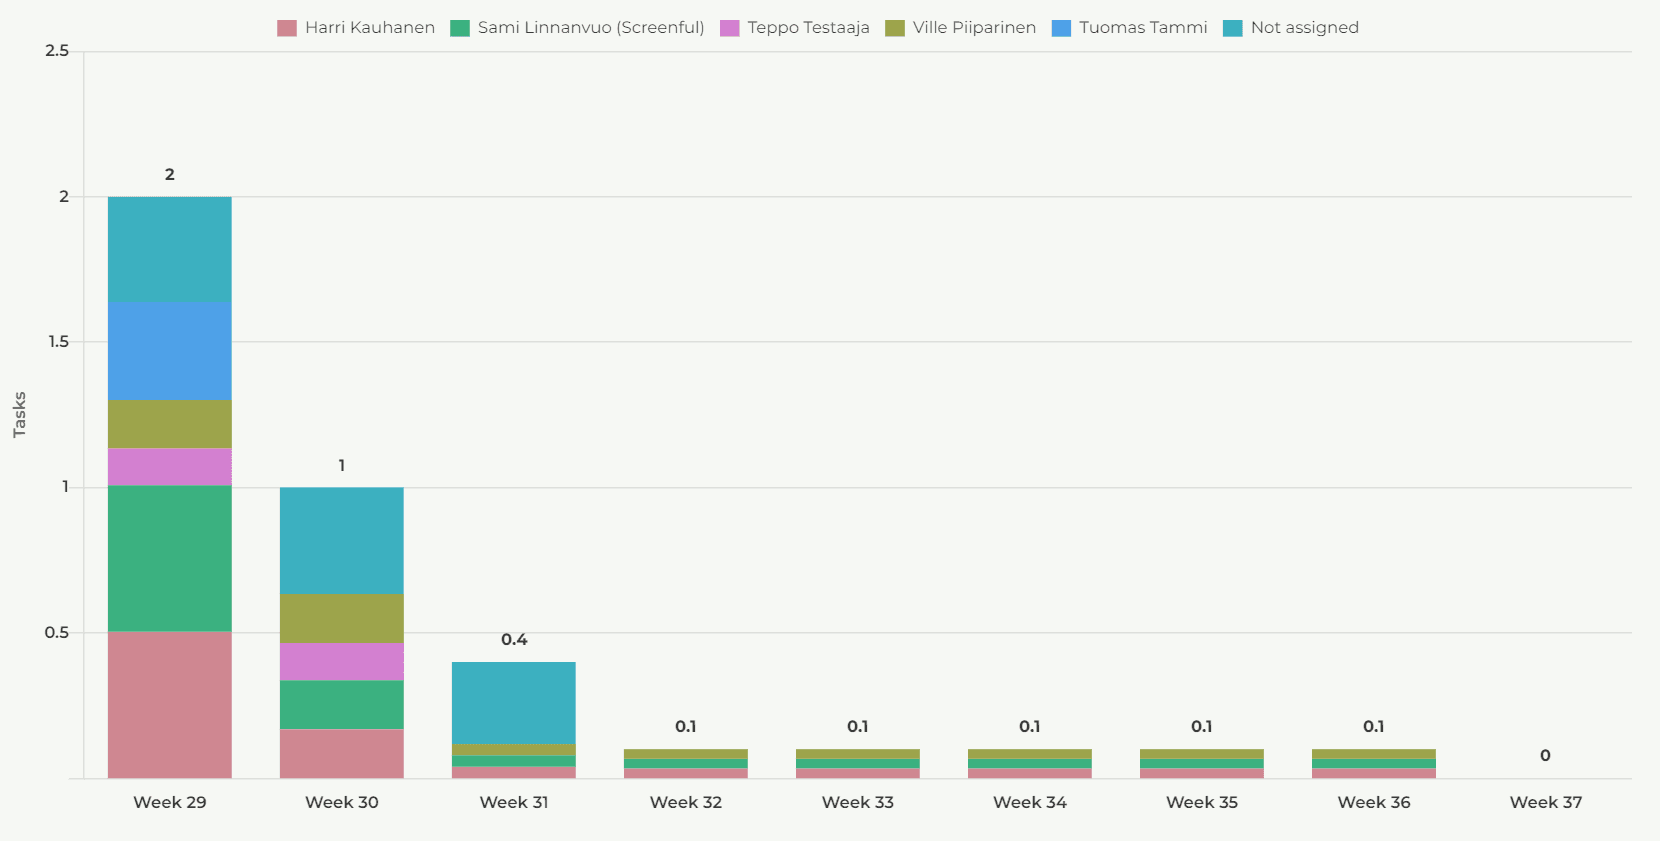
Completed tasks per assignee
Completed tasks per assignee
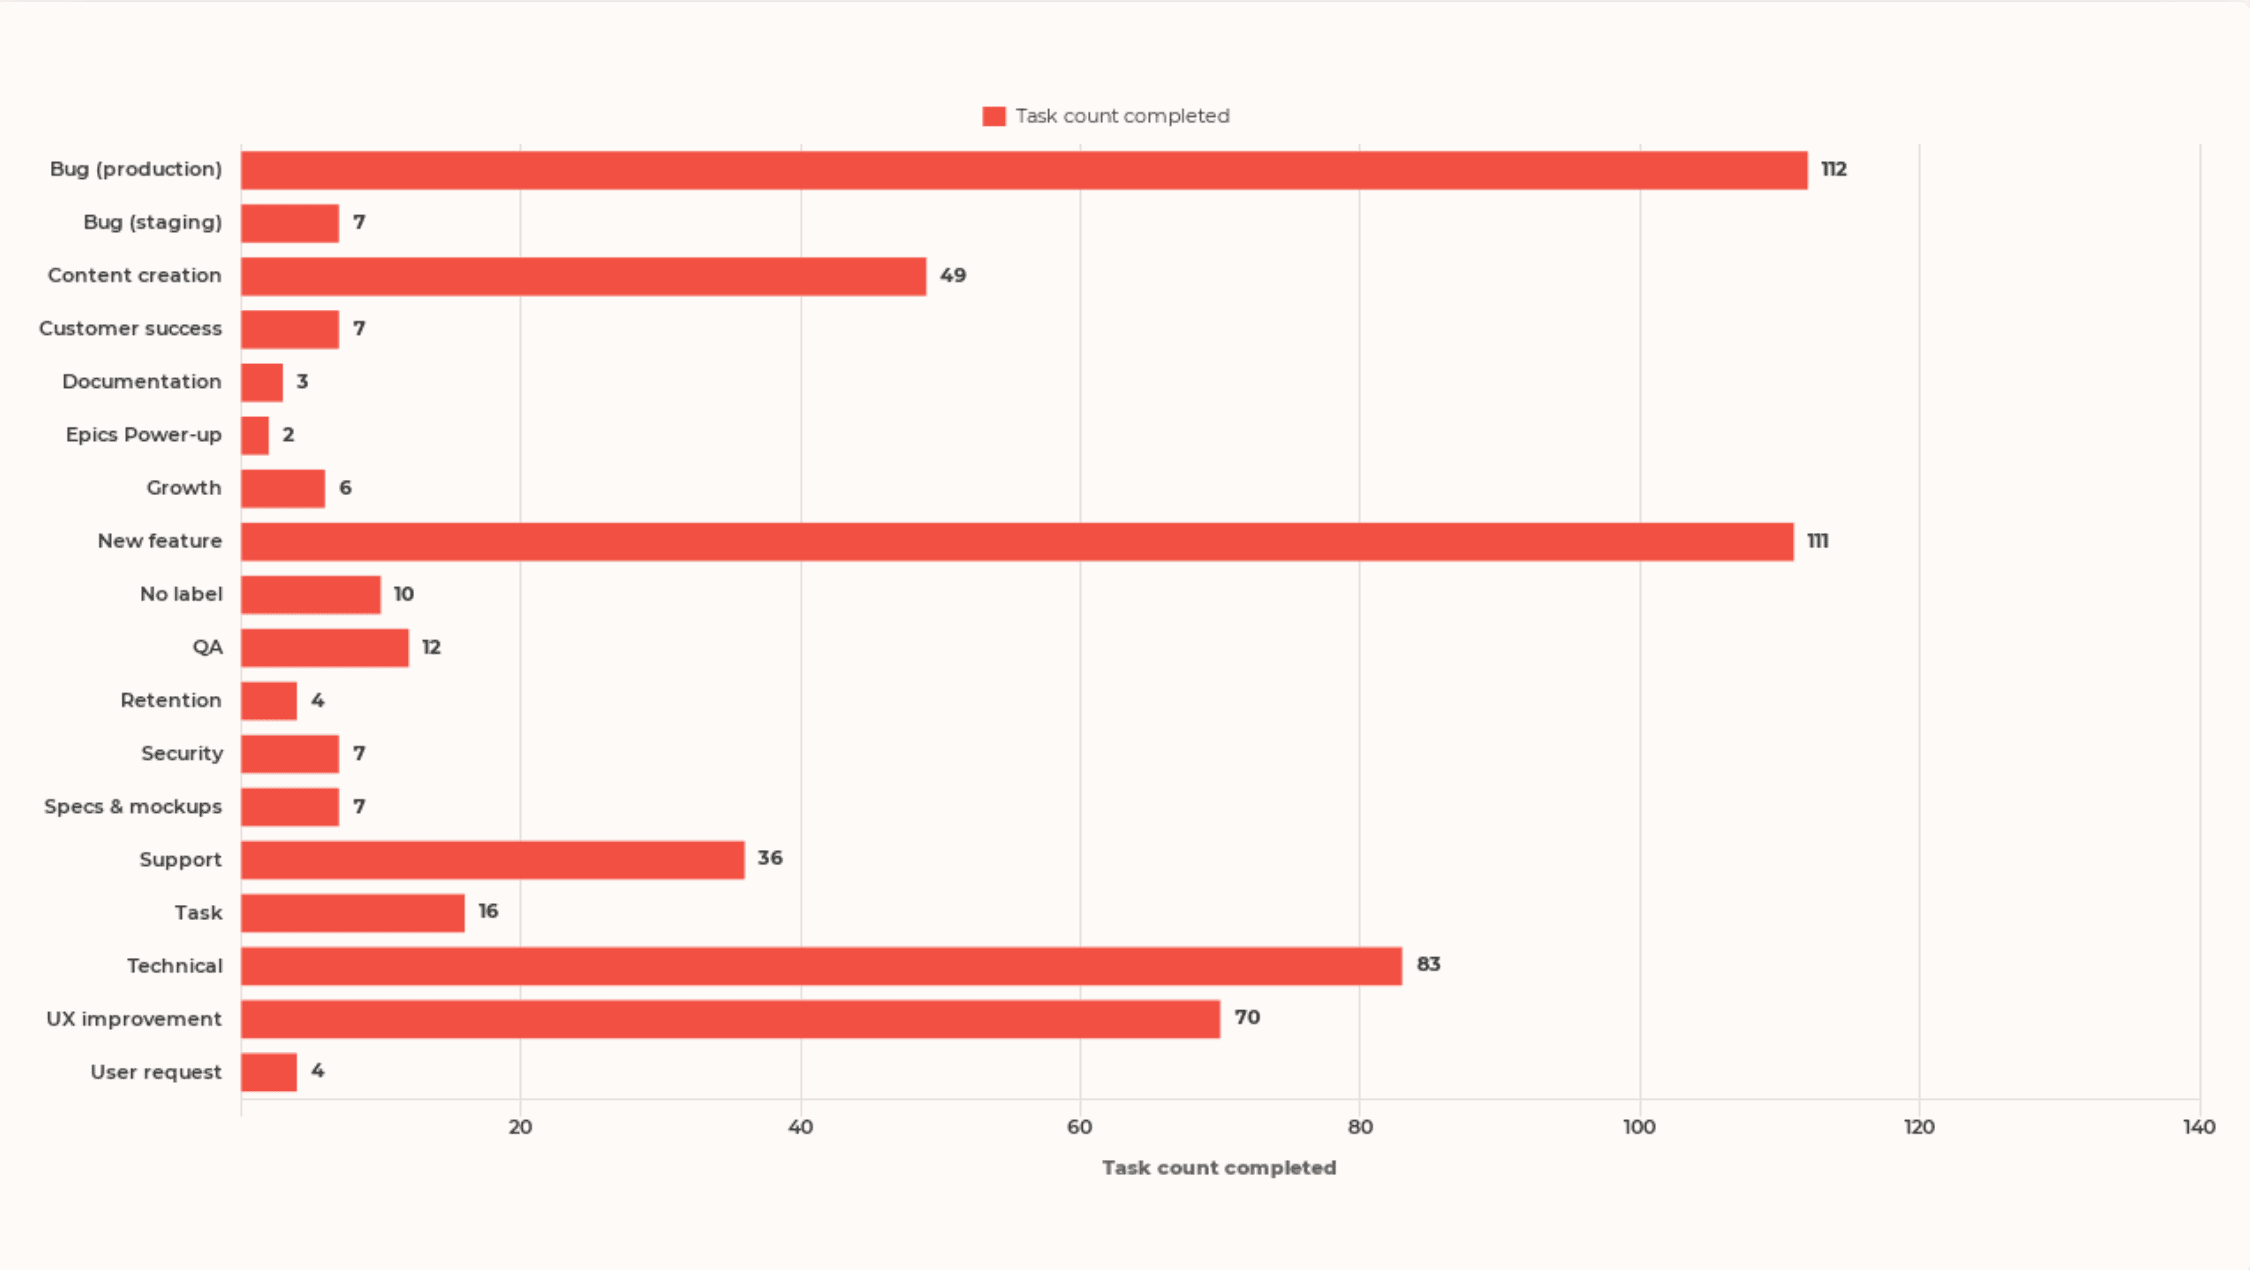
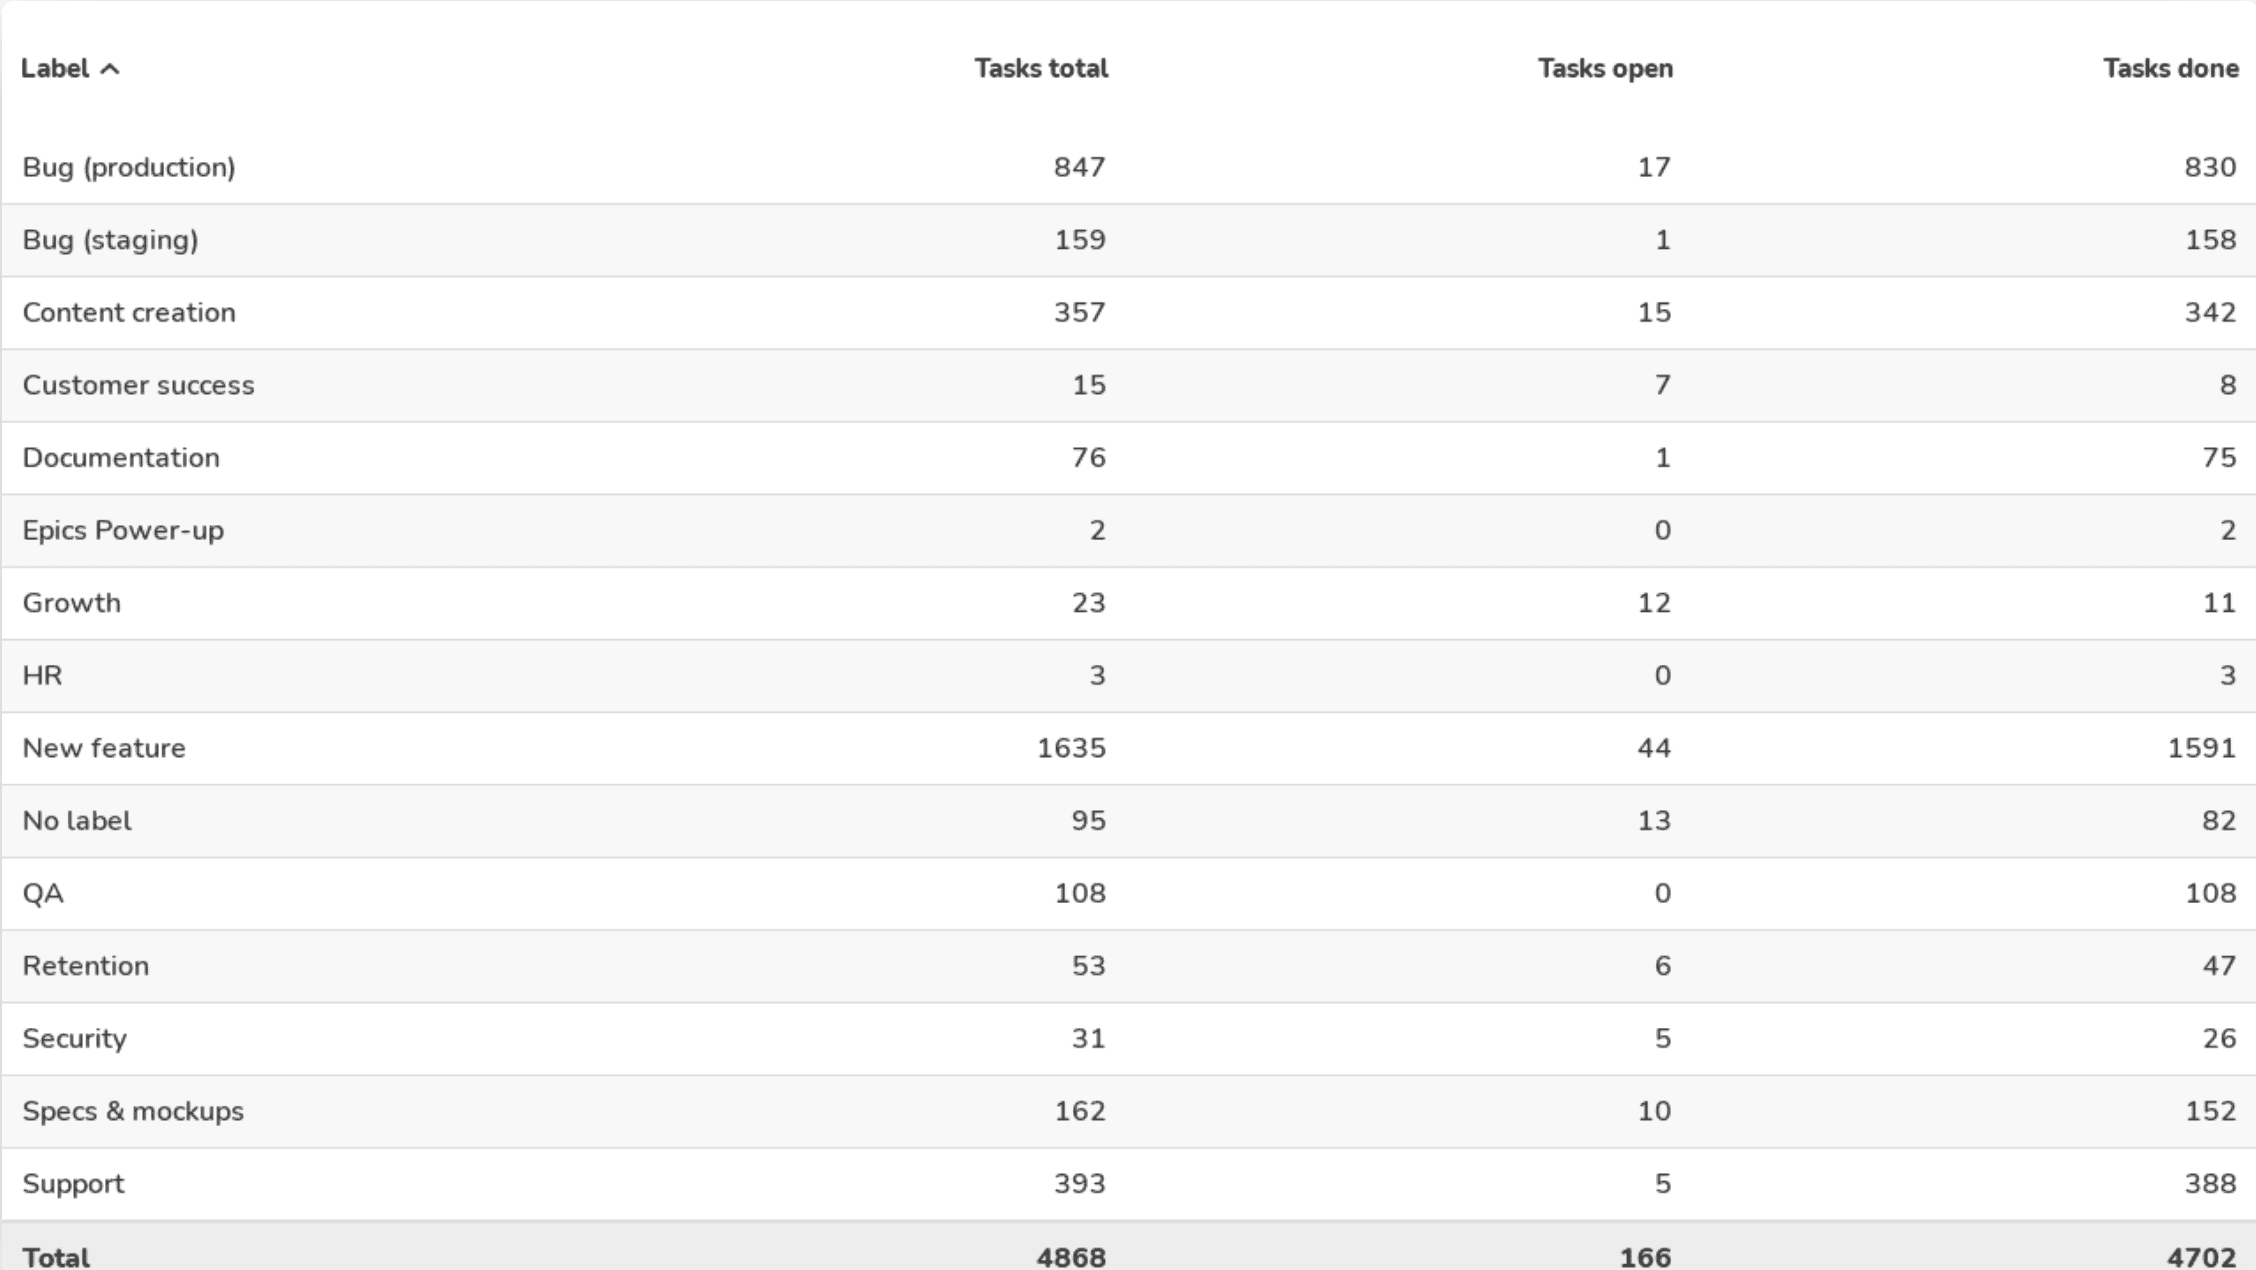
Tasks breakdown
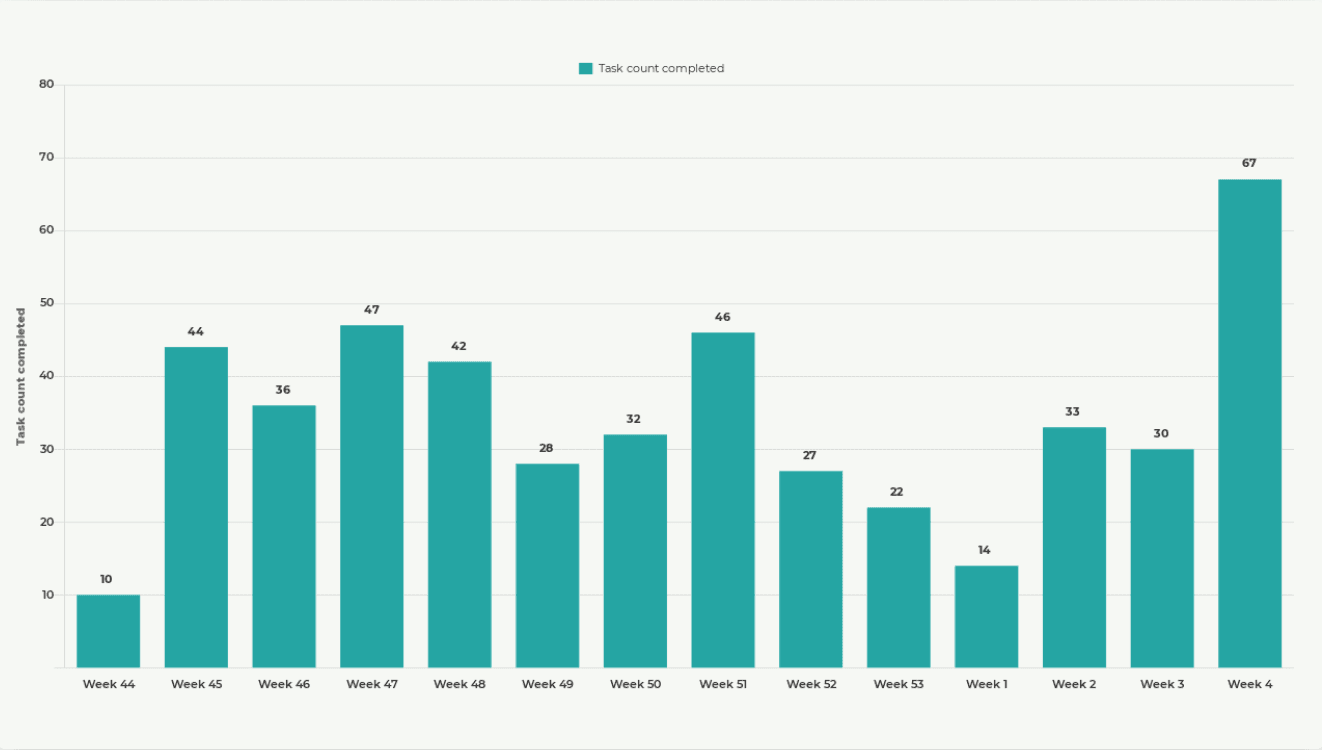
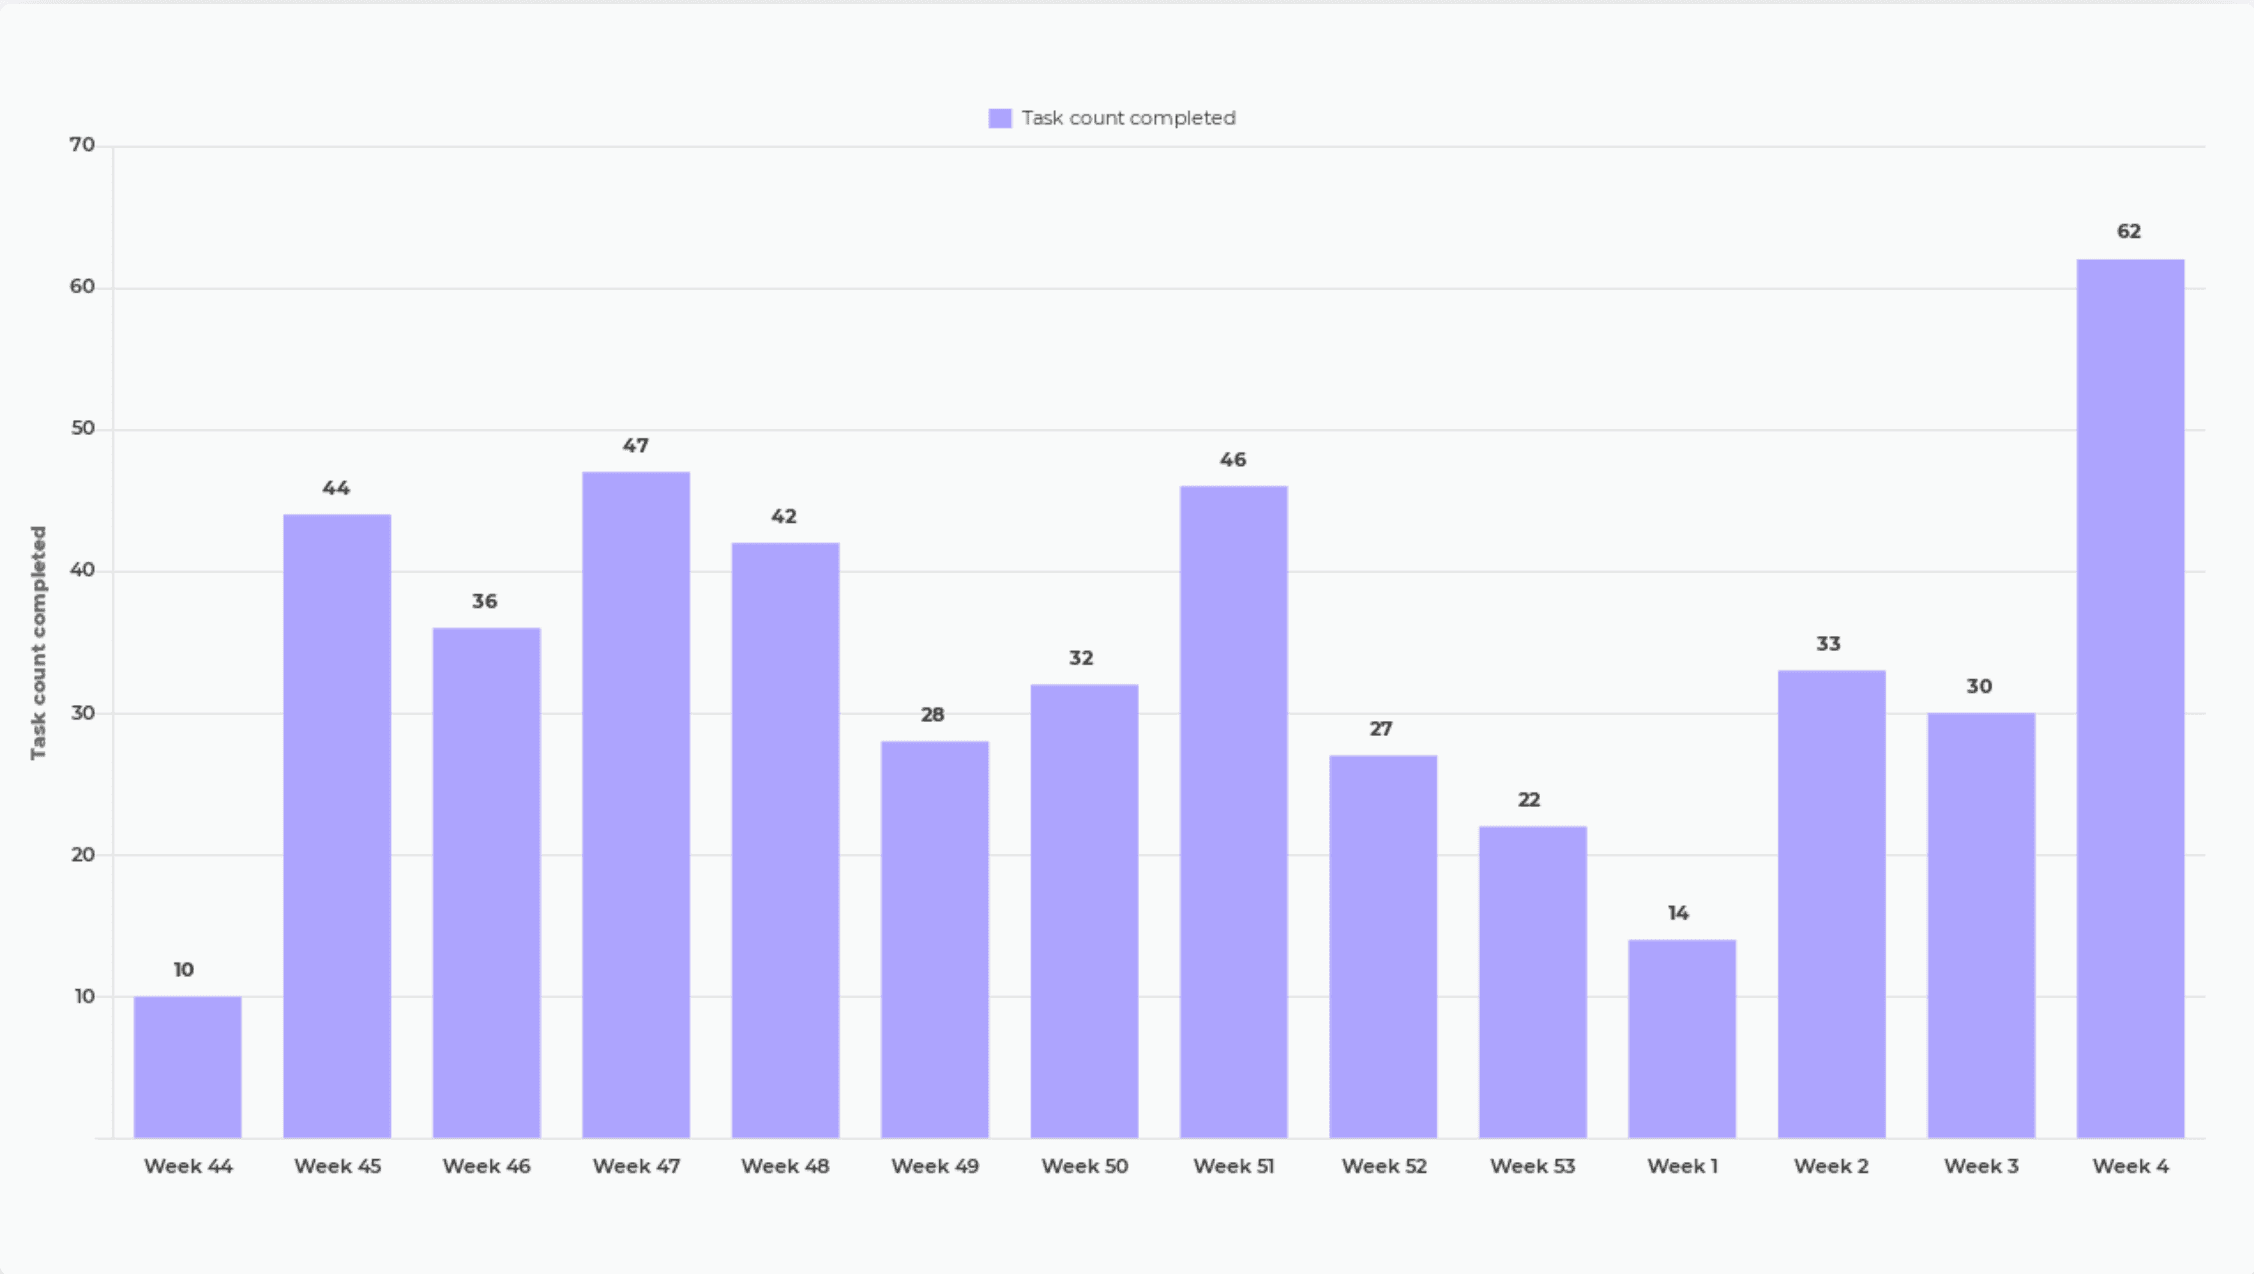
Completed tasks per week
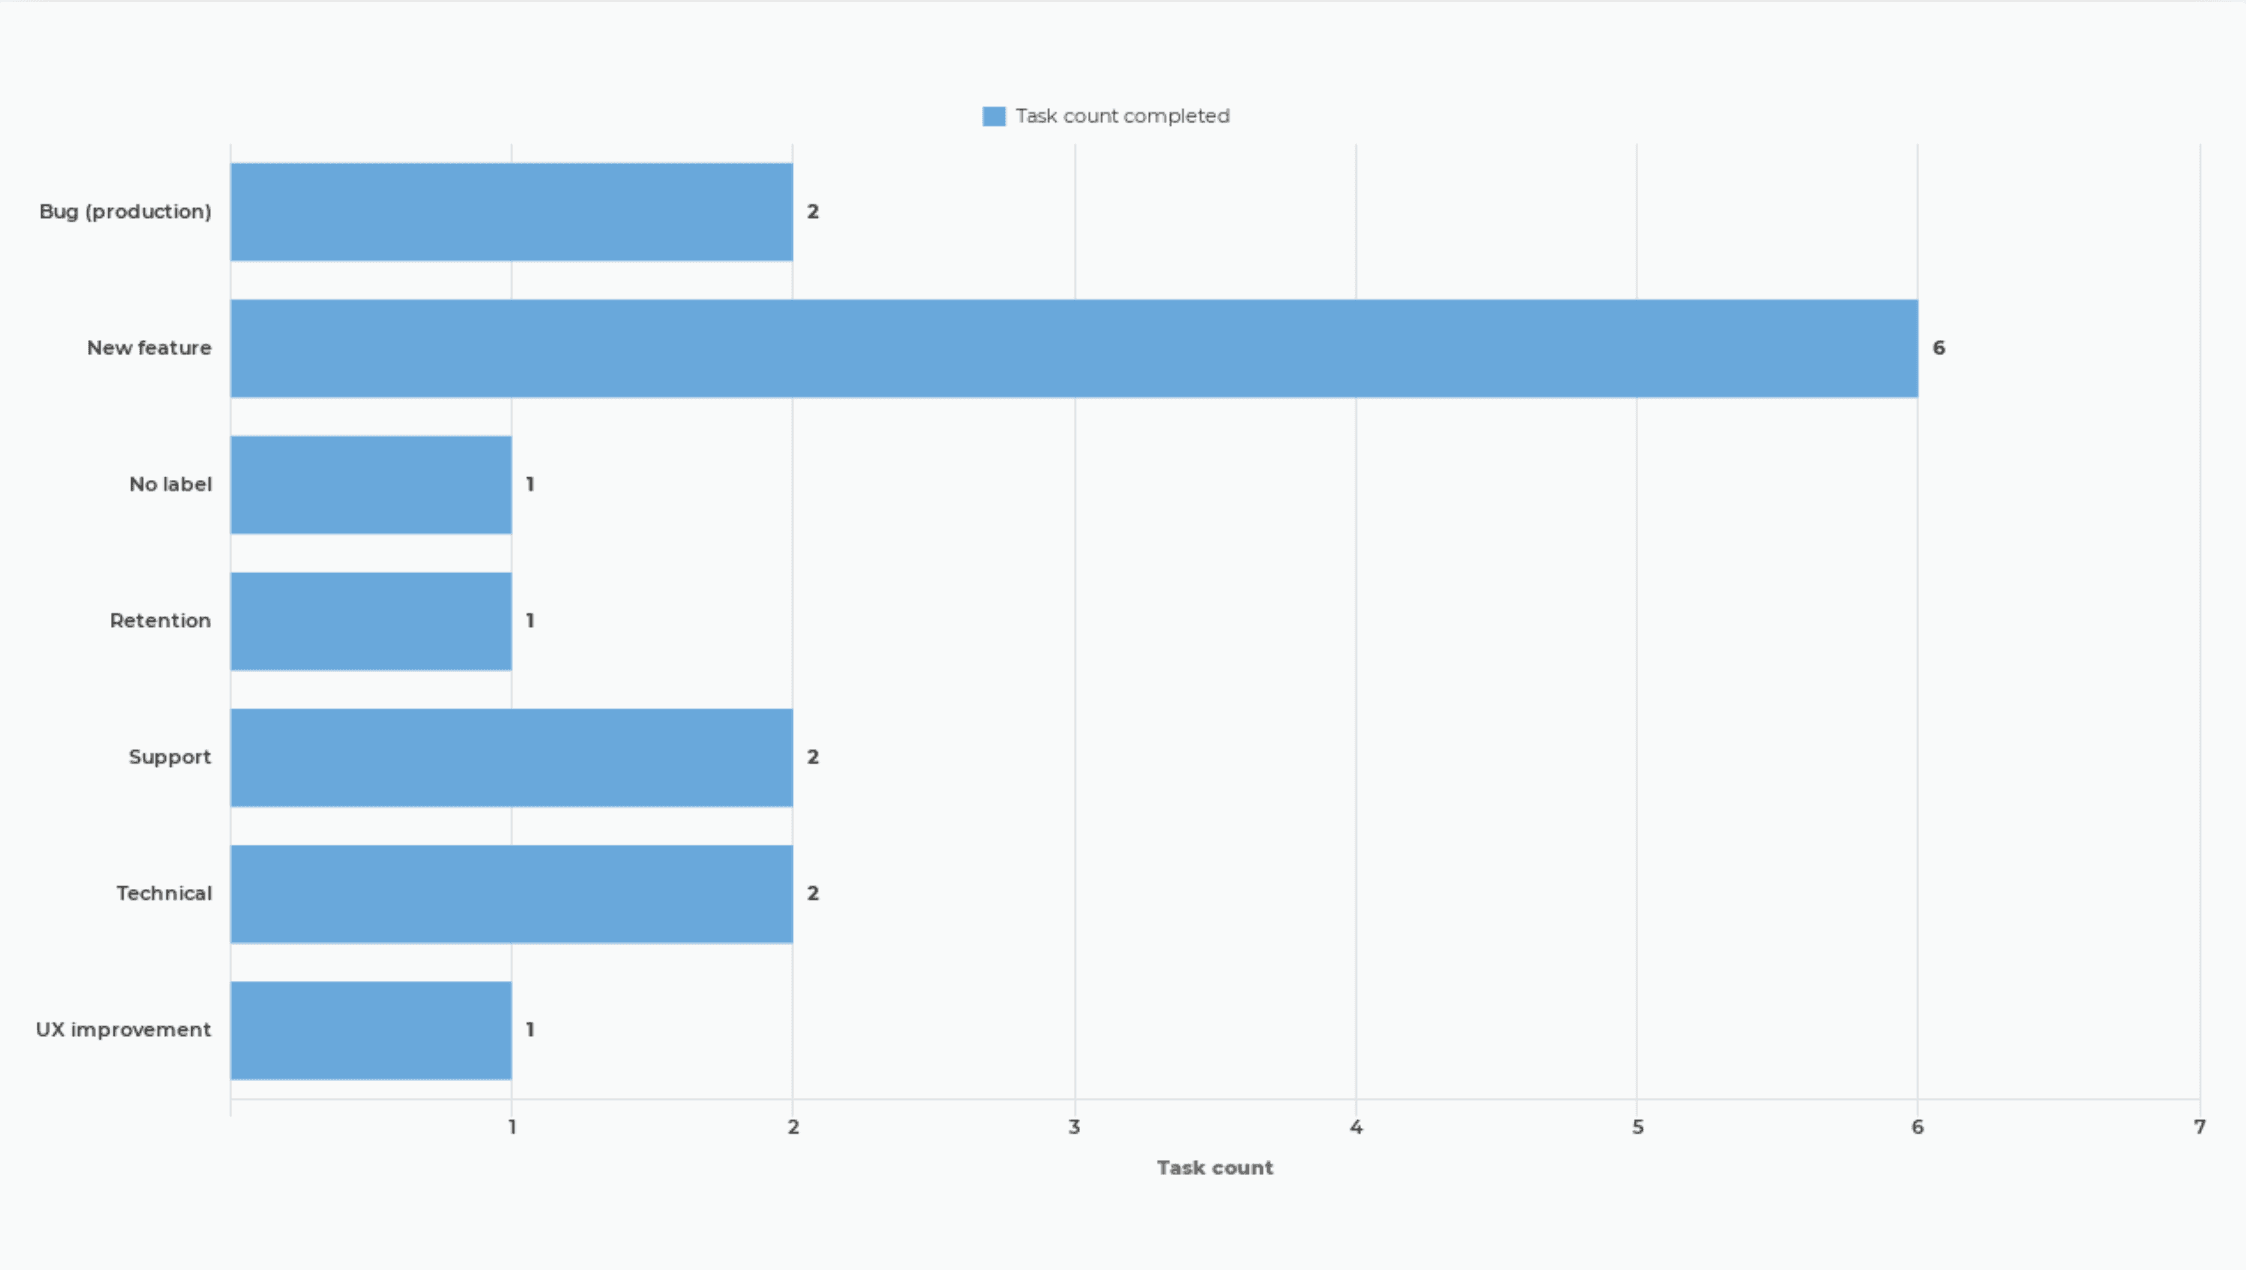
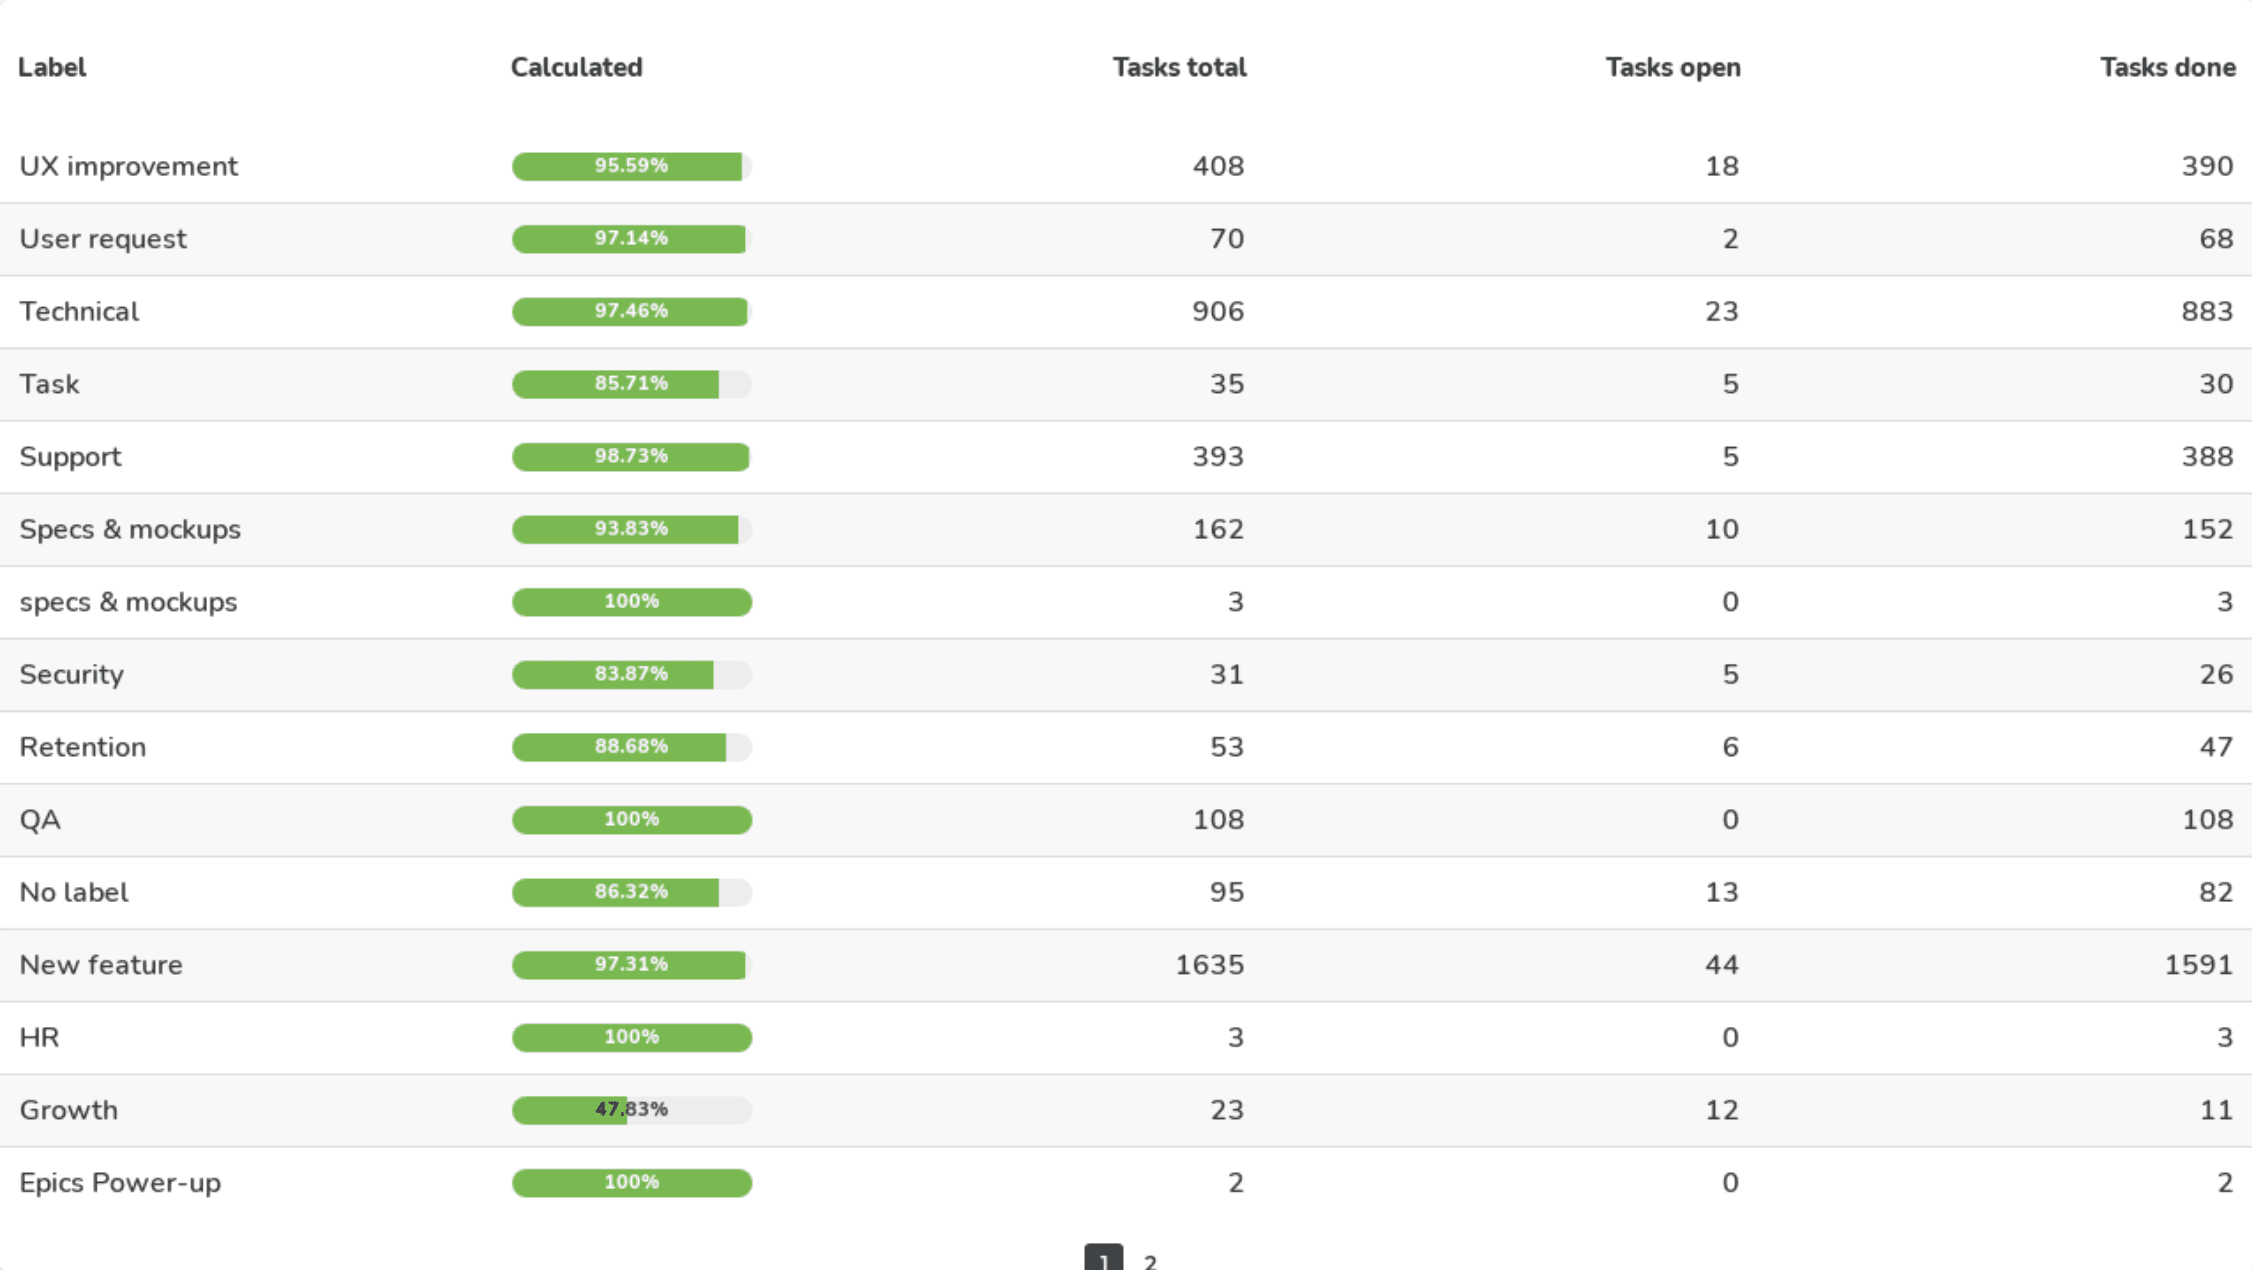
Tasks progress breakdown
Calculated remaining tasks per assignee
Completed on time tasks
Completed overdue tasks
Overdue tasks
Not yet completed tasks
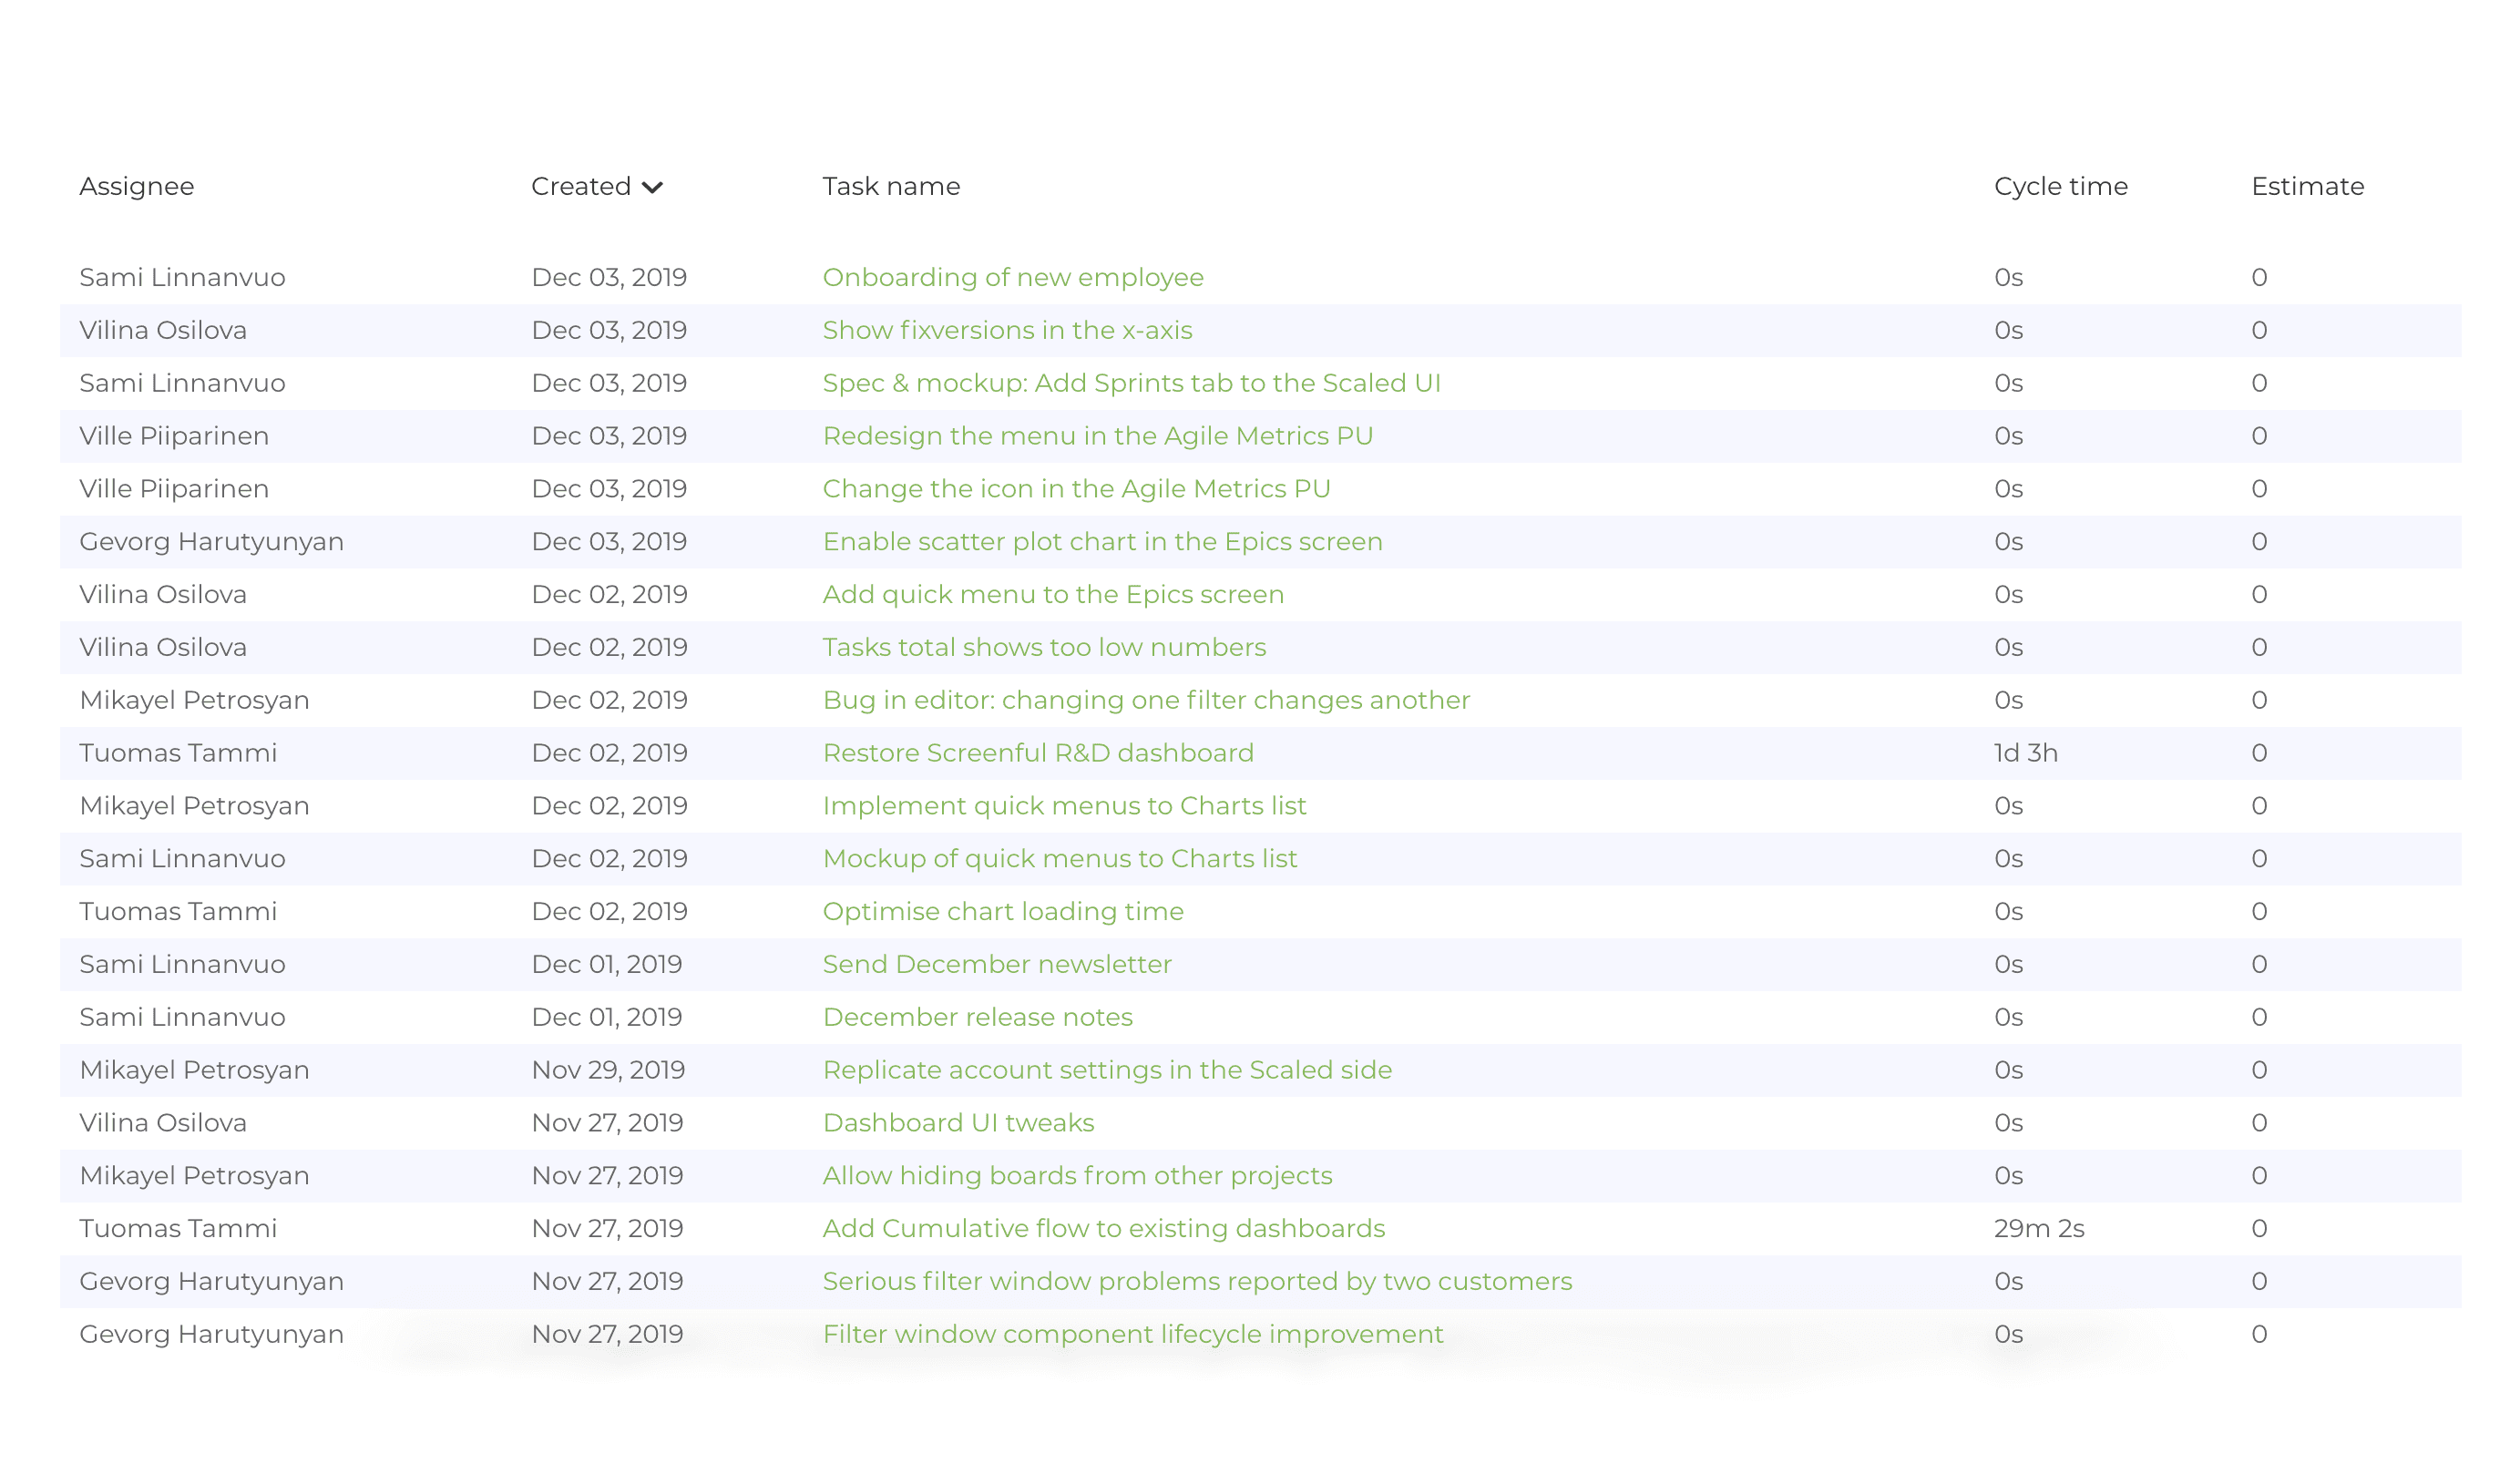
List of tasks created
List of tasks in progress
List of tasks completed
Workload