
Creating charts using monday.com formula column
Feb 19, 2025
You can now create Screenful charts and reports using Monday's Formula column. If you have added one or more formula columns to your board, they will be automatically imported and made available for Screenful charts.
Contents:
Integrating Screenful with monday.com
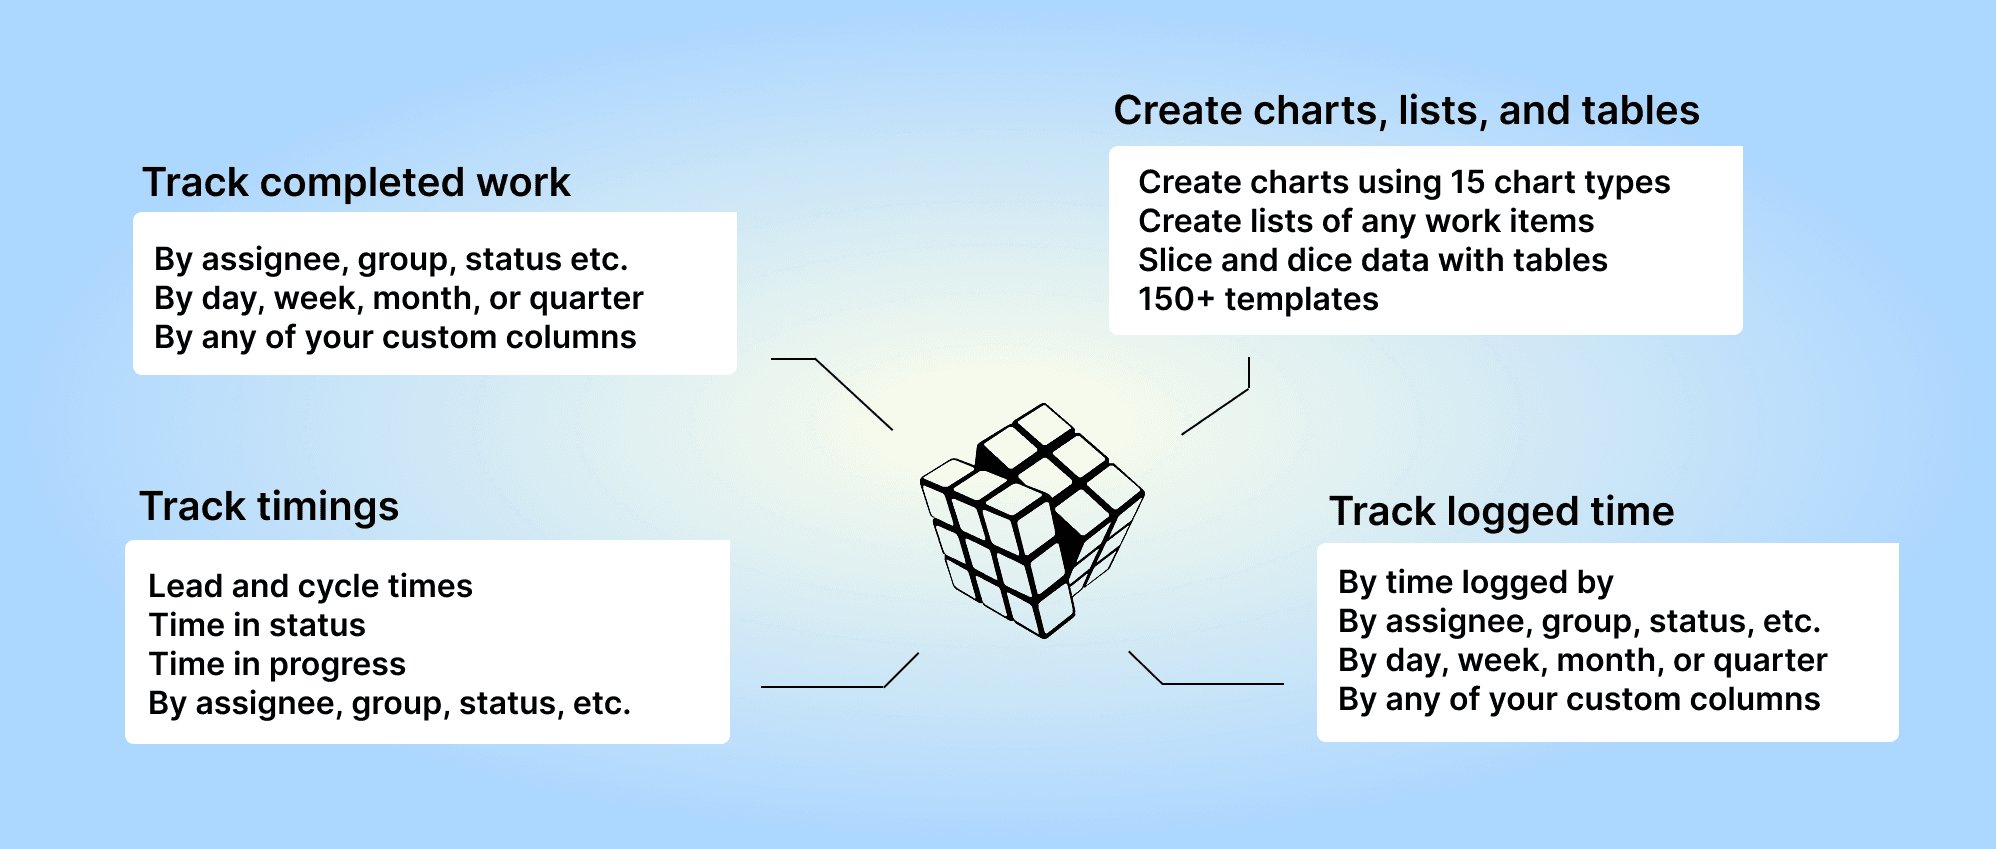
Screenful provides multidimensional analytics of the data in monday.com. You can slice & dice your data with 15 different chart types, and click through to drill into details.
Analytics & Reports by Screenful can be installed via the monday.com Apps Marketplace. Once installed, it adds an entry to the left menu that allows you to access your charts and reports within the Monday UI.
For more information, see the guide for setting up Screenful with monday.com.
Adding a formula column to a monday.com board
Add a formula column to your board by clicking Add column (the plus icon after the rightmost column). A modal is opened, showing the most common column types. Click Formula to add a formula column:

We've added two number columns Budget and Spent to show the total budget and how much of that budget has been spent so far:

We've also added a formula column Remaining, that shows the difference between the two:

You can add any number of formula columns to a board, and they can have references to other formula columns.
Creating a chart using monday.com formula column
Monday's Formula columns can be used as units in the charts. When creating a chart, formula columns are selectable in the unit menu:

In this example, the unit menu contains two Number columns: Budget and Spent. There is also a formula column Remaining, that shows the difference between the budget and spent. When you select Remaining as the unit for the chart, you'll see the sum of Remaining:

When you click through the number, you'll see the individual items and how much is Remaining per each item:

Limitations when using formula columns
There are certain limitations when using formula columns in charts:
If a formula column references a mirror column, it won't be supported by the Monday API; therefore, values are unavailable for Screenful. You will see a warning on the custom field mapping page.
All formula columns may not be automatically available in the unit menu. In that case, you need to map the column to a unit.
If the value of the formula column is not a number, it cannot be used as the unit in the chart.
To get started, see the guide for setting up Screenful with monday.com.
Let us know if you have questions or feedback by contacting hello@screenful.com. To stay on the loop, read our blog, or follow us on LinkedIn.
