
Introducing Agent-Assisted Delivery report for linear
AI tools have transformed how software engineering teams write code and deliver new features. For engineering leaders, the interesting question is whether AI agents actually speed up delivery and improve cycle times. To answer that question with data, we built a new Agent-Assisted Delivery report.
Contents:
What the report measures?
Linear has introduced the Agent Delegate field on issues which allows teams to explicitly assign AI agents to participate in task completion. We read that property to visualize and compare team performance across two dimensions:
Human-Only vs. Agent-Assisted Workload Volume
How much of the work is driven by or shared with AI agents compared to purely human-driven tasks?Cycle Time Comparisons
Is there a difference in cycle times (time from start to completion) when an agent delegate is involved vs. when an issue is handled exclusively by human engineers?
Because this tracking relies on Linear’s agent delegate field, these numbers reflect structured, tracked delegation rather than unmeasured local developer AI tool usage.
How much work was delegated to agents vs human-driven?
The Human only vs agent-assisted work chart shows how much work was delegated to agents and how much was purely human driven in each month:
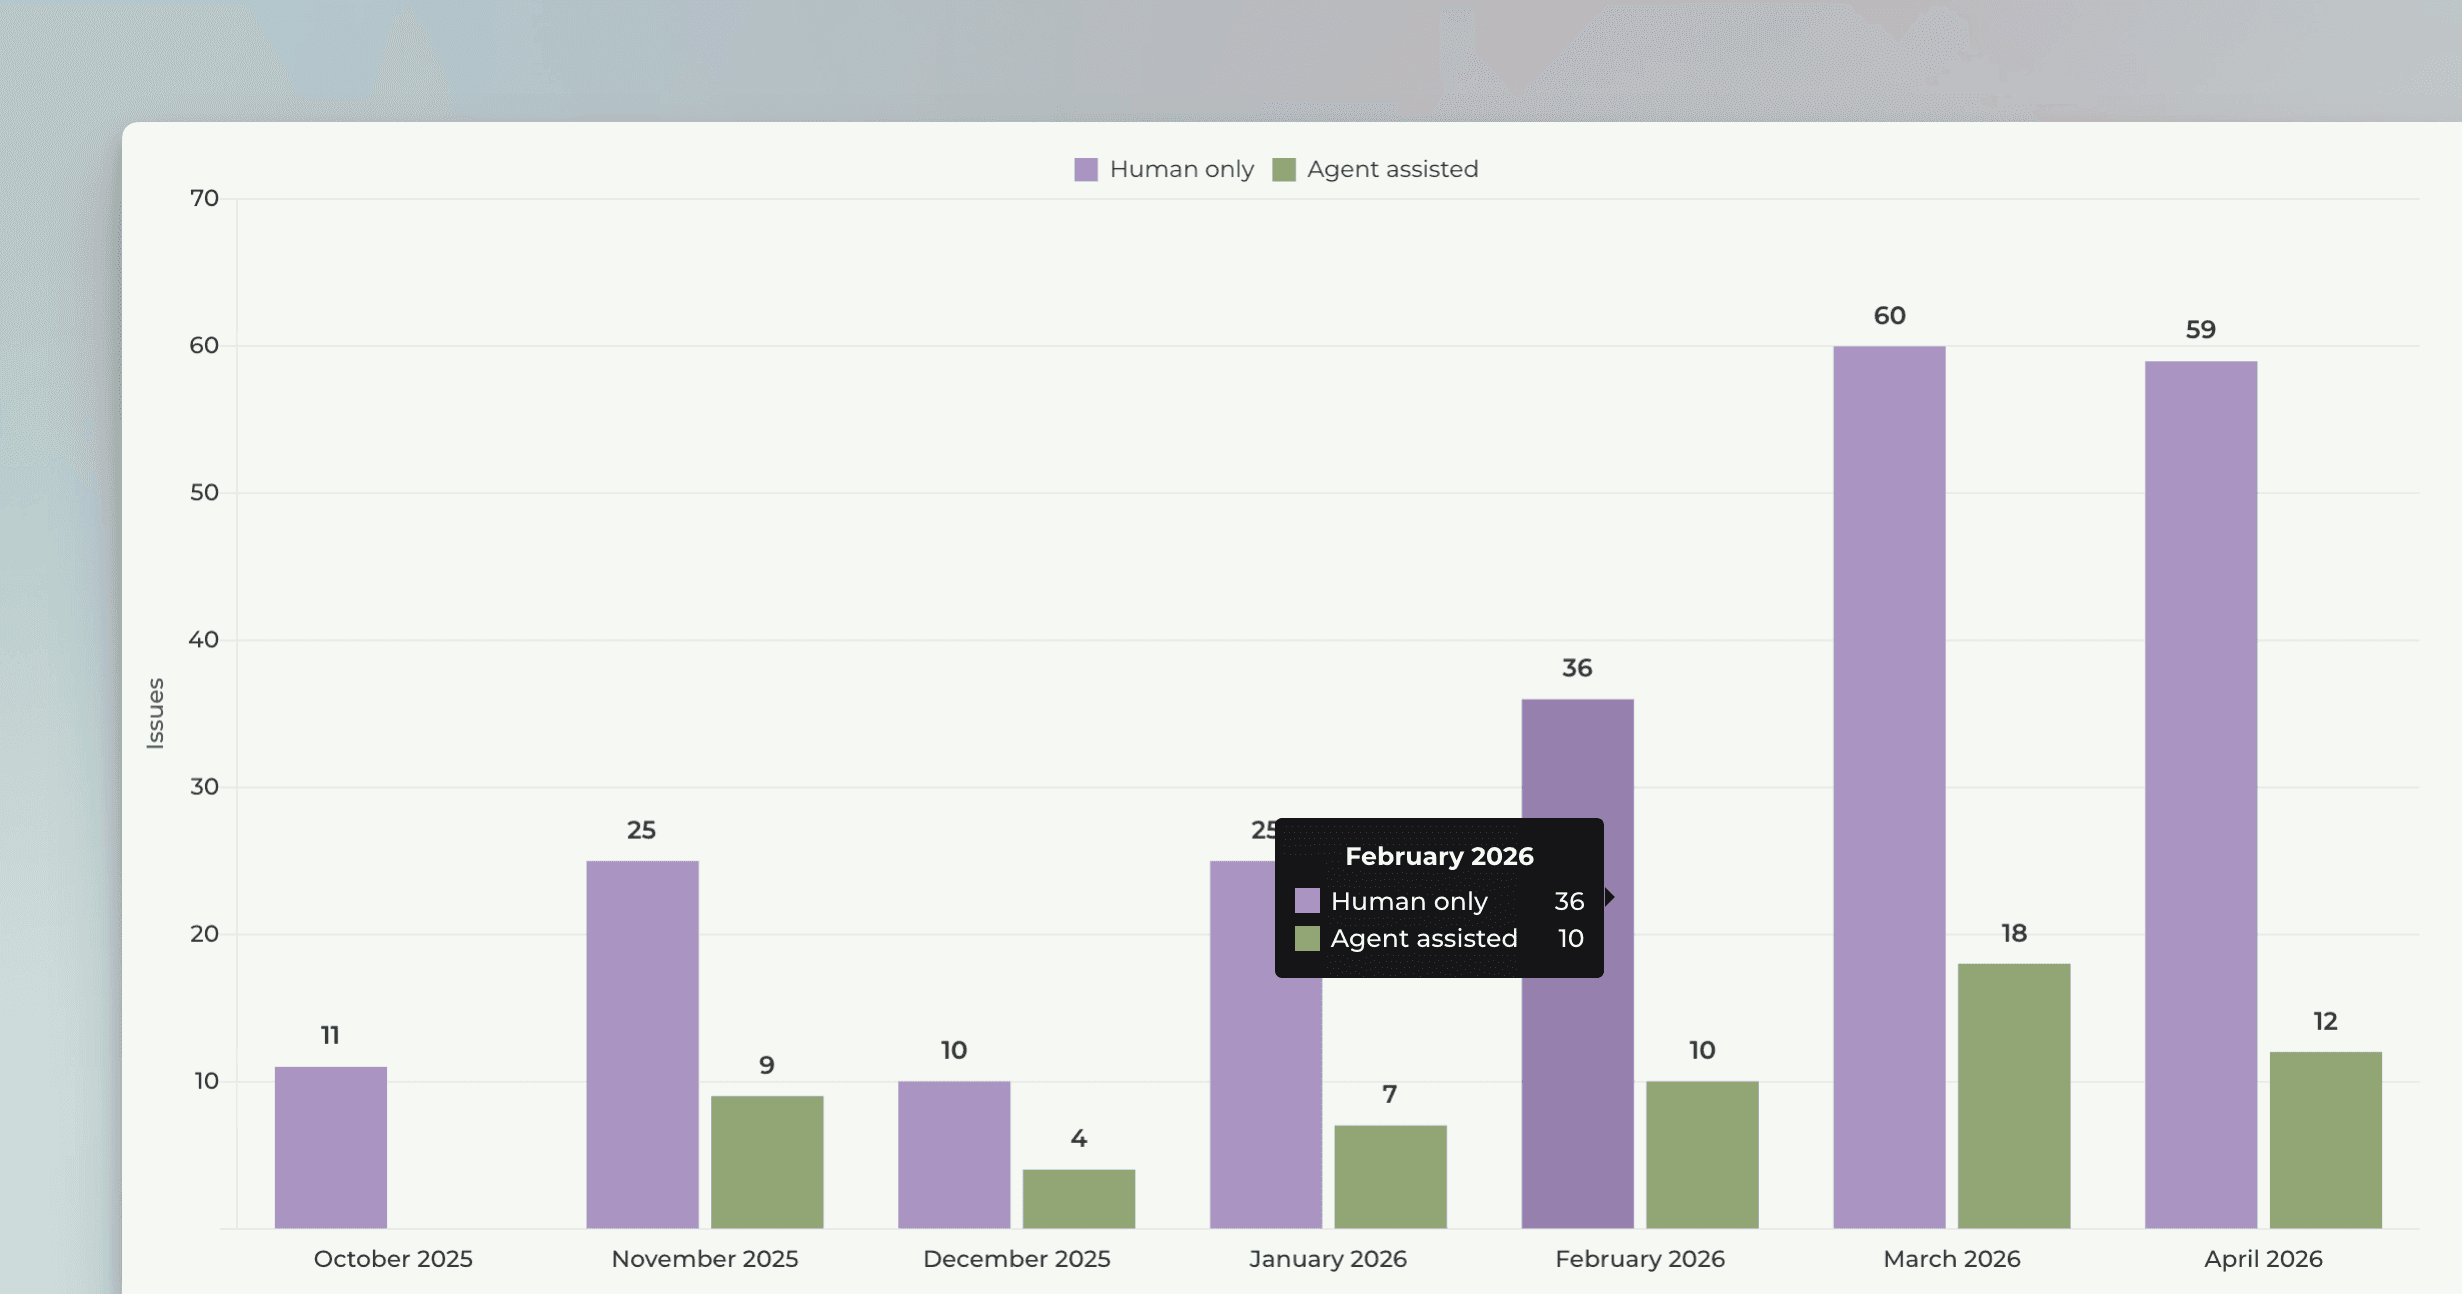
You can click through the bars to see the Linear issues behind the numbers.
Compare the cycle times of all work vs agent-assisted work
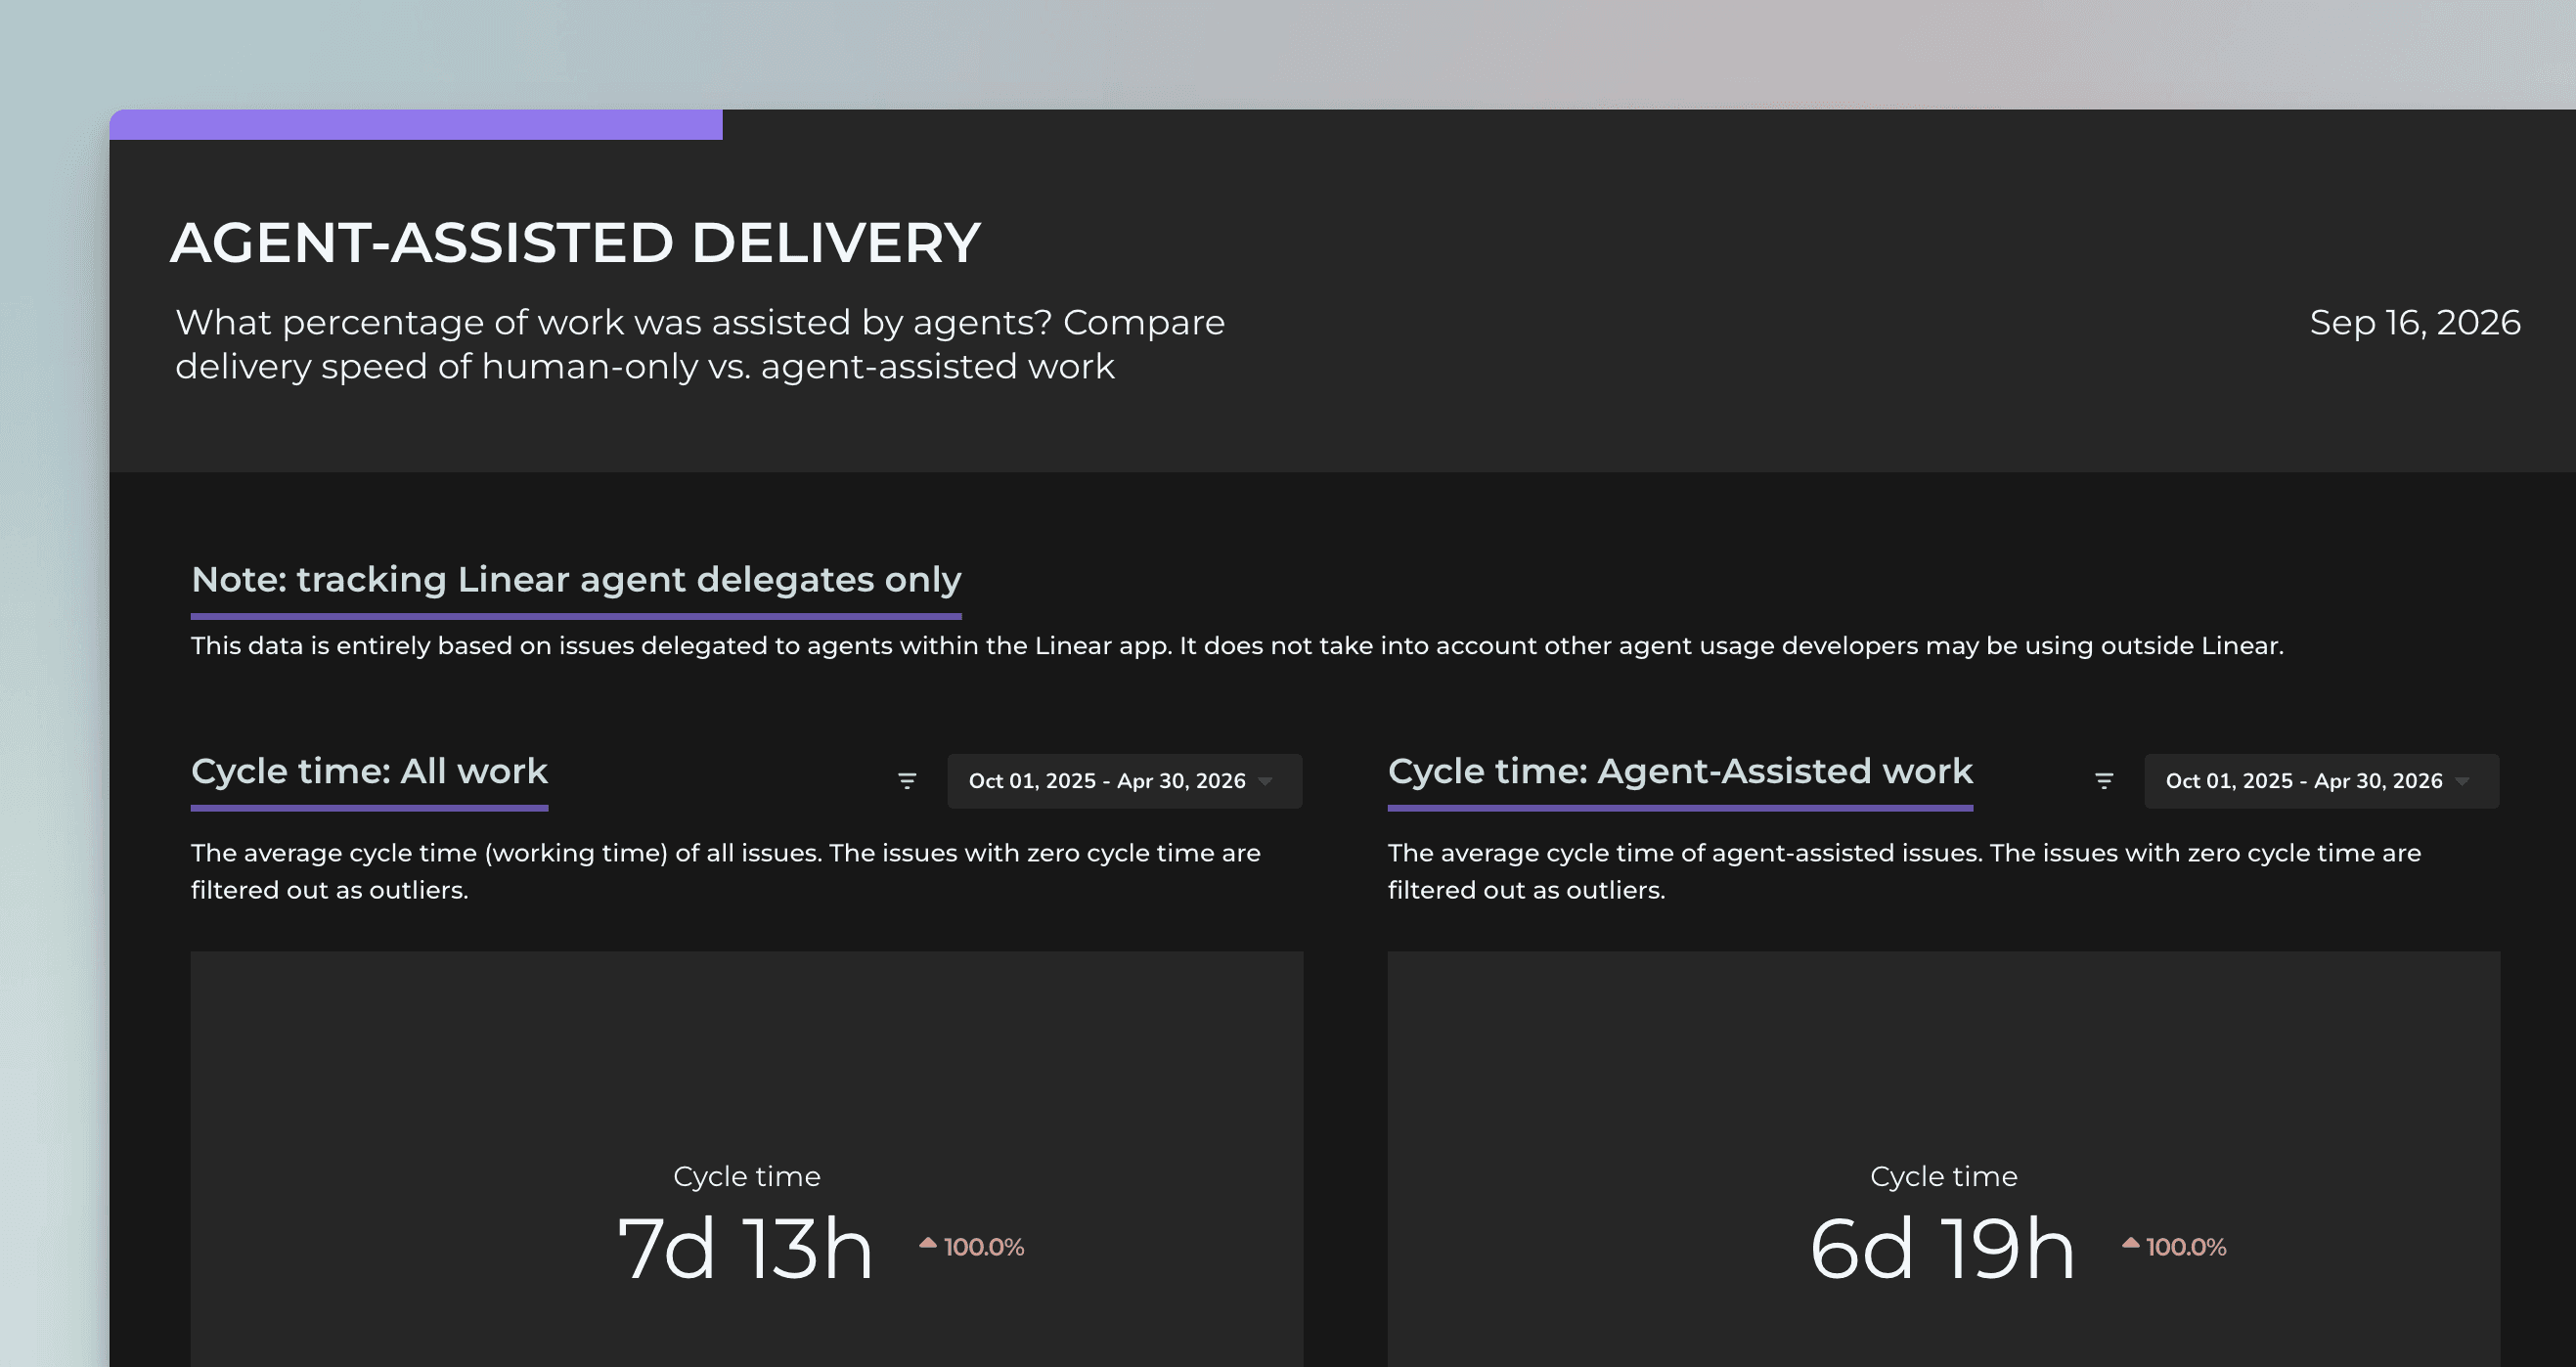
To evaluate the impact of AI delegation on delivery speed, we compare the cycle times (the working time required to take an issue from start to completion). The metrics below compare baseline performance across all work against issues assigned to agents. Zero cycle time issues are excluded as outliers.
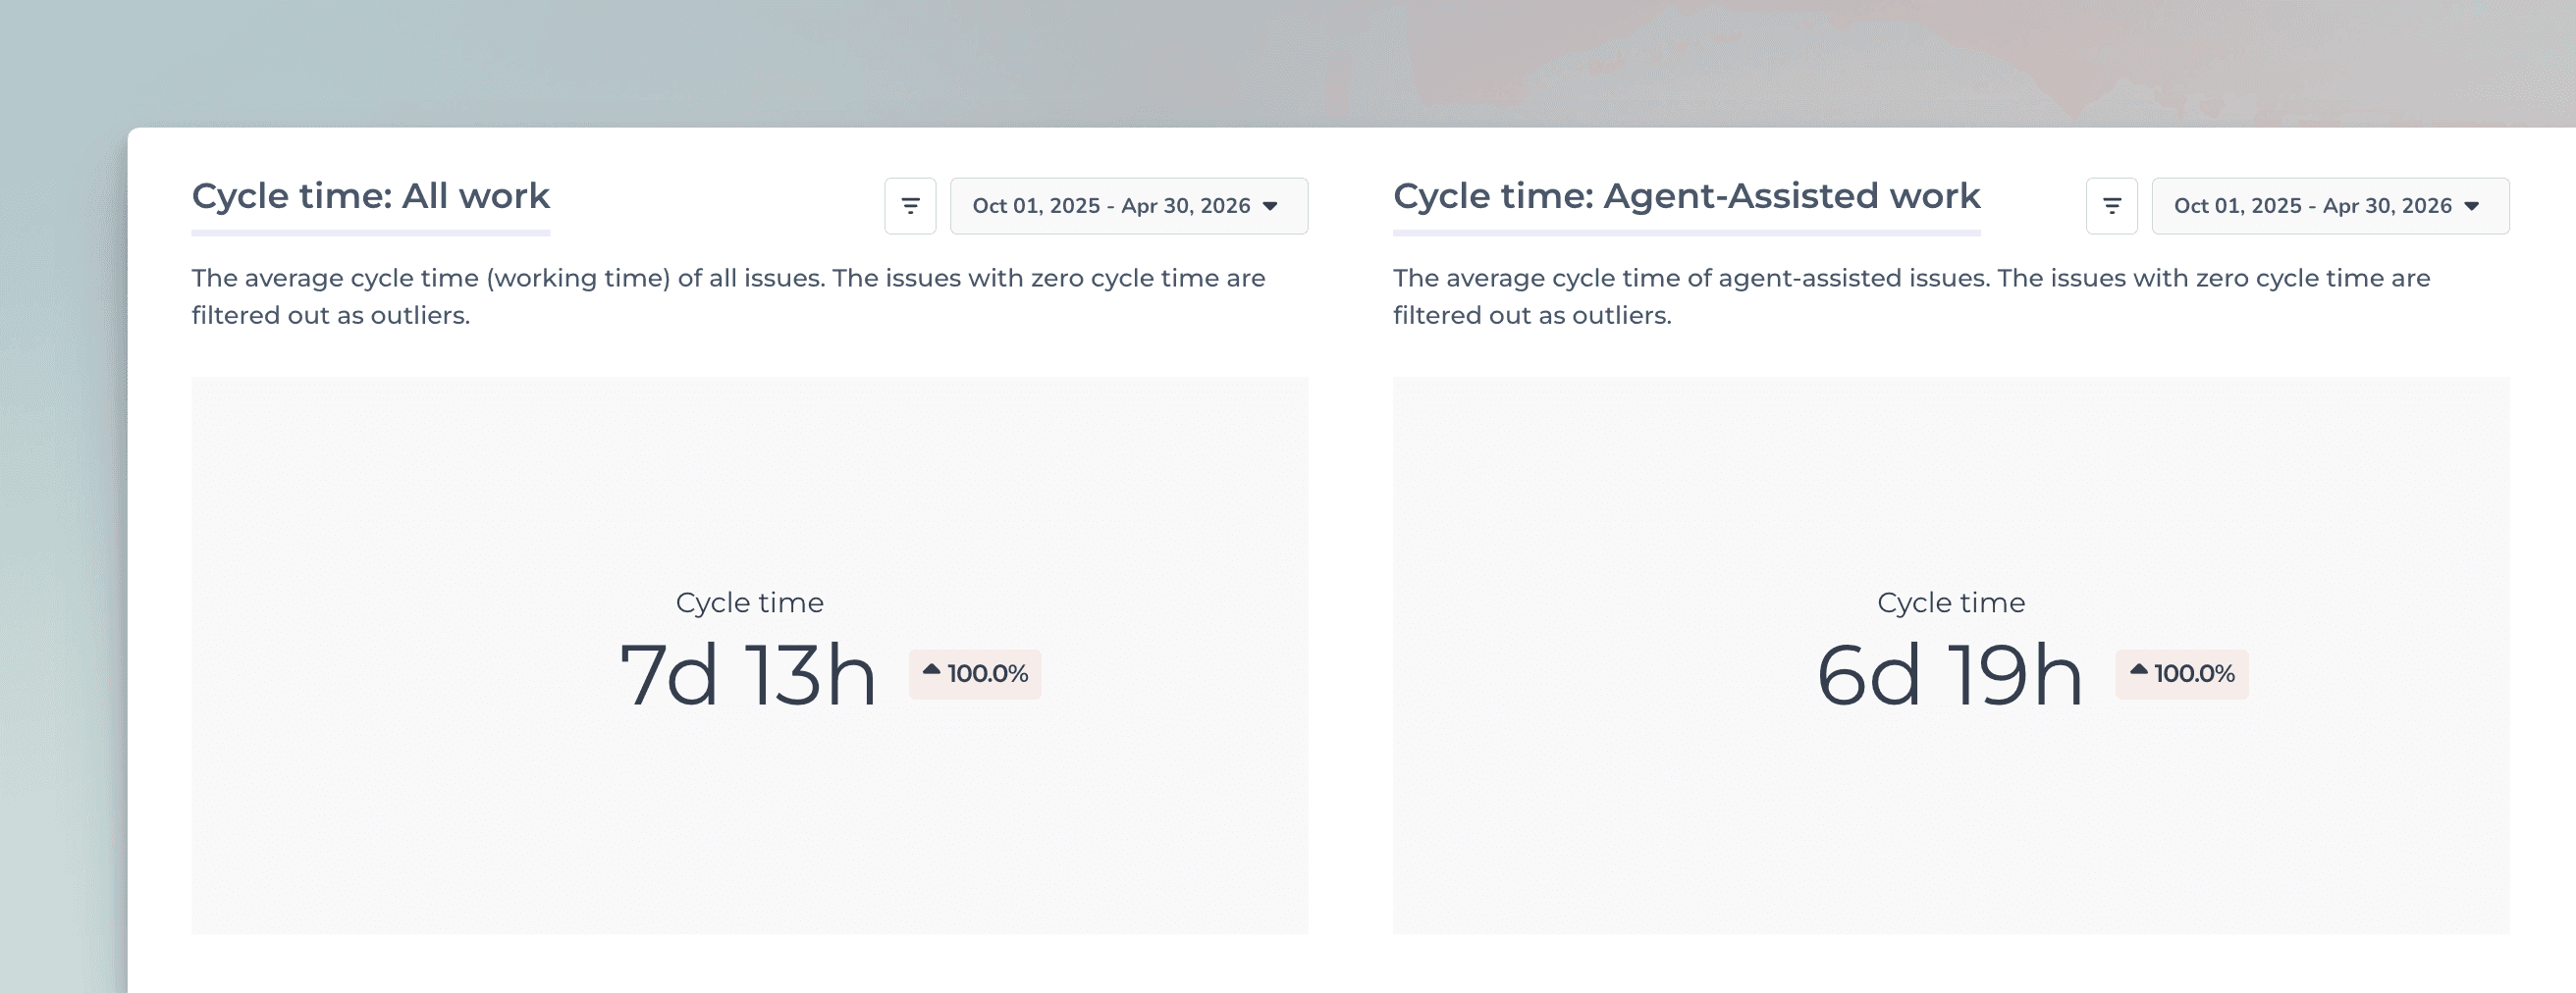
In this example, agent-assisted issues complete in 6 days and 19 hours, compared to 7 days and 13 hours across all work. That's a reduction of 18 hours in average cycle time (about 10% speedup in total elapsed working time).
See the breakdown by agent
The stacked bar chart below shows the agent types delegated to the issues during the 7 months period. In this example the agent types were Codex, GitHub Copilot, and Sentry:
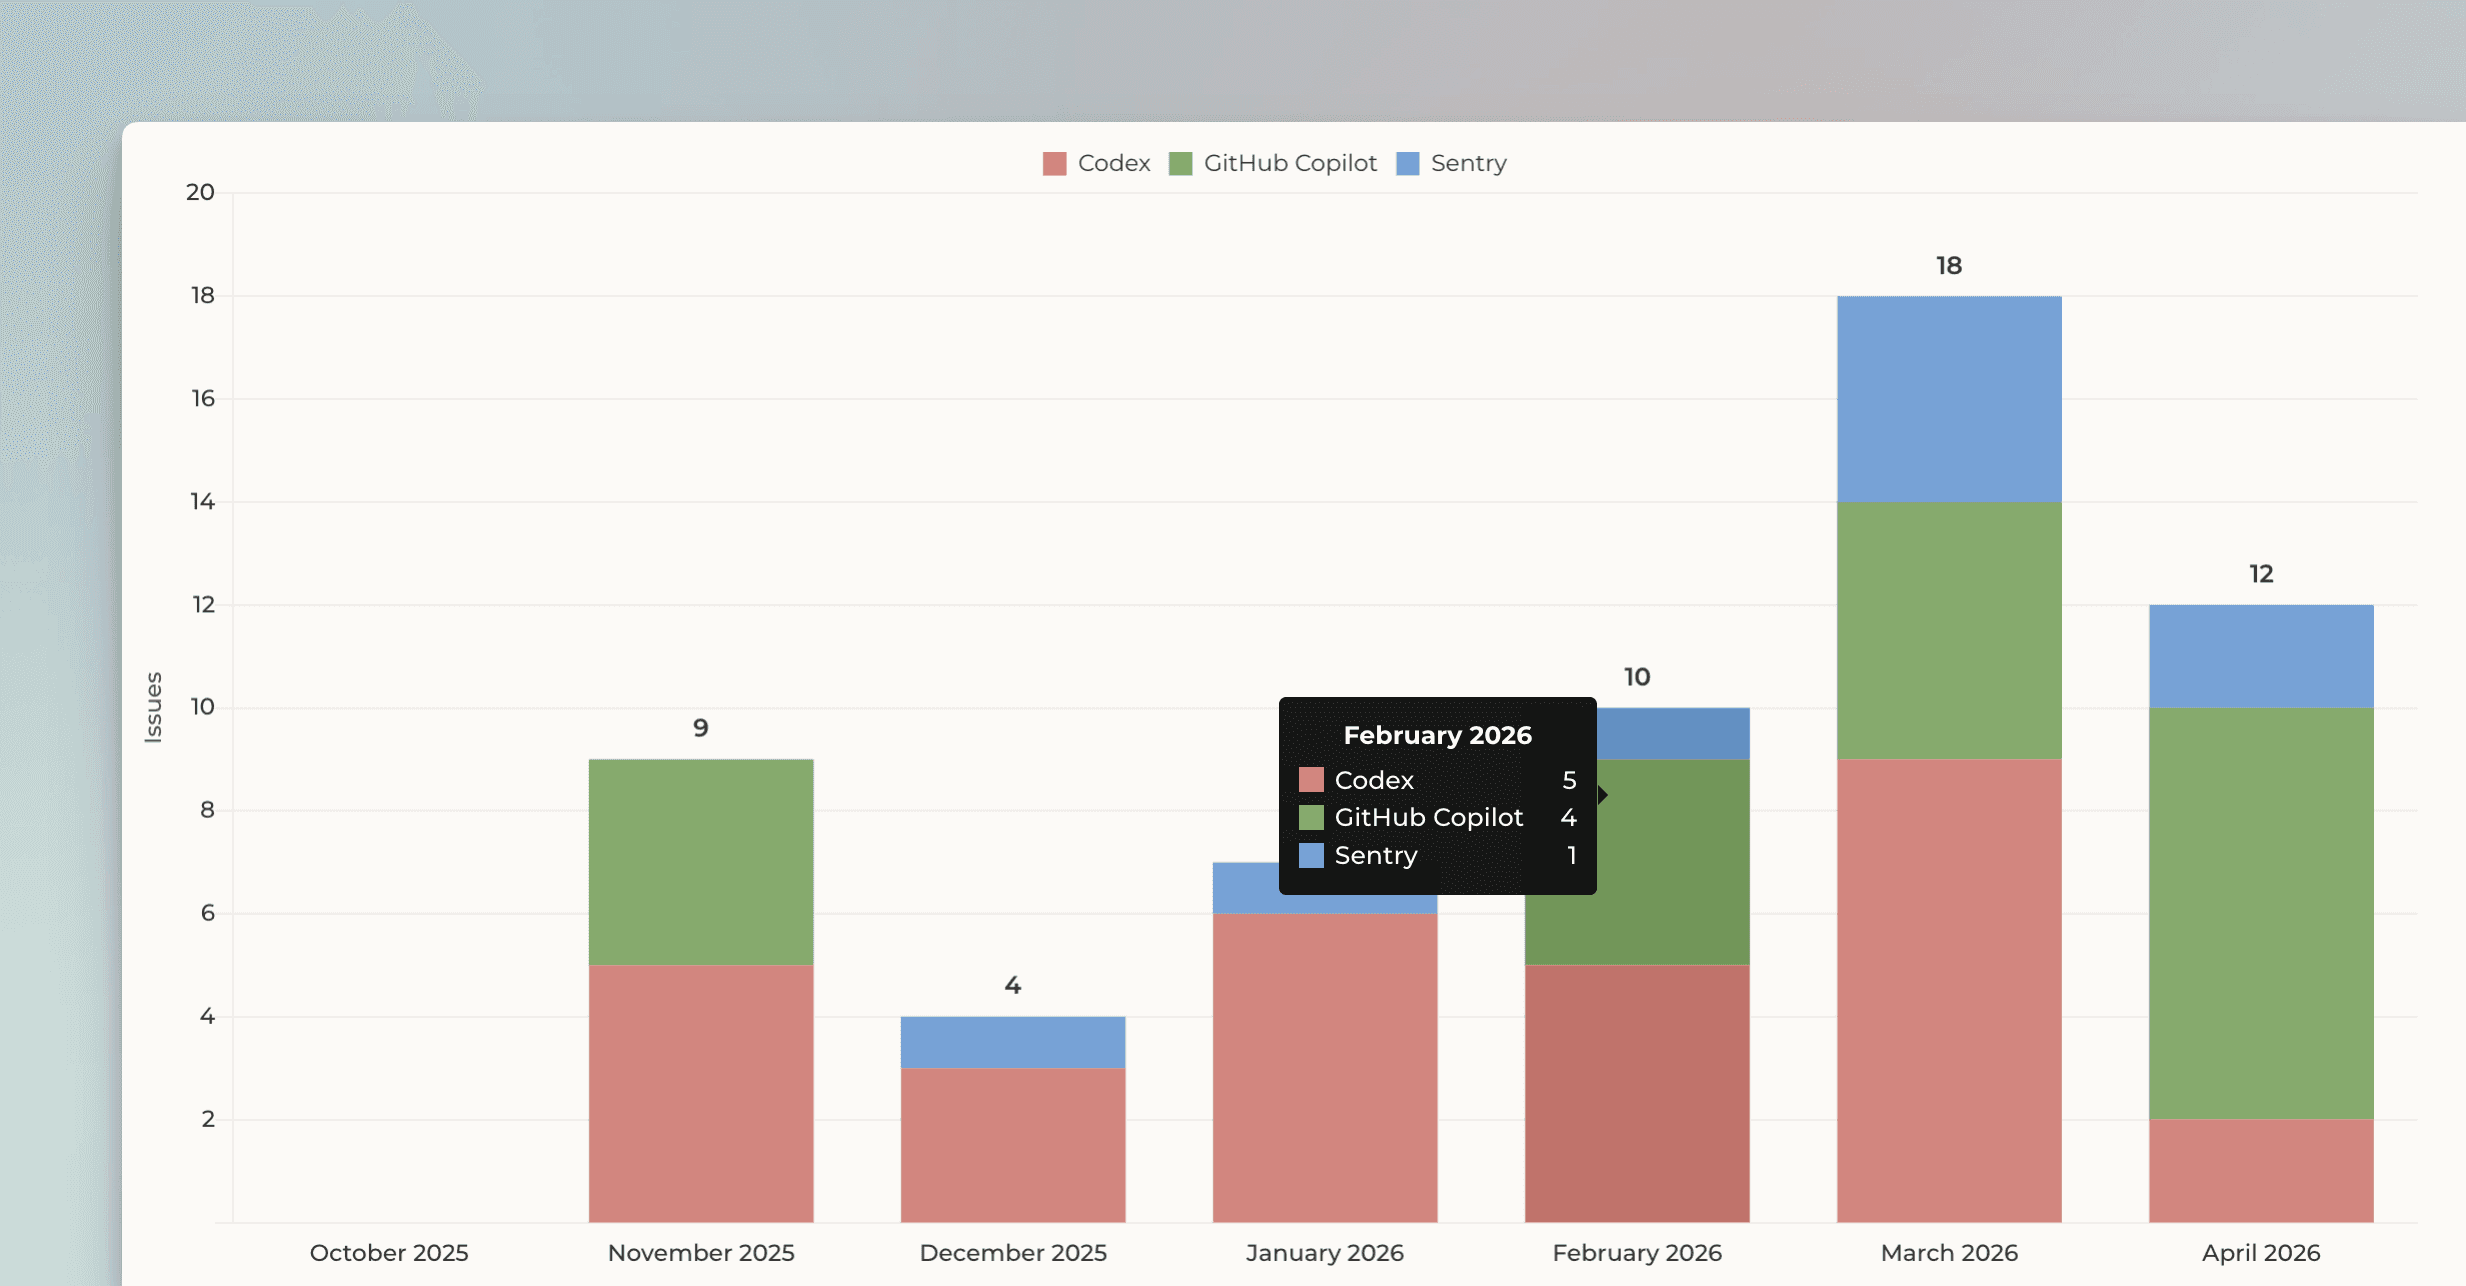
Agent delegation began in November 2025 and peaked in March 2026 with a total of 18 issues, representing the highest volume of agent participation in a single month
Track the ratio of agent-assisted work over time
The table below shows the monthly ratio of agent-assisted work, tracking total completed work against agent-assisted issues from October 2025 to April 2026.
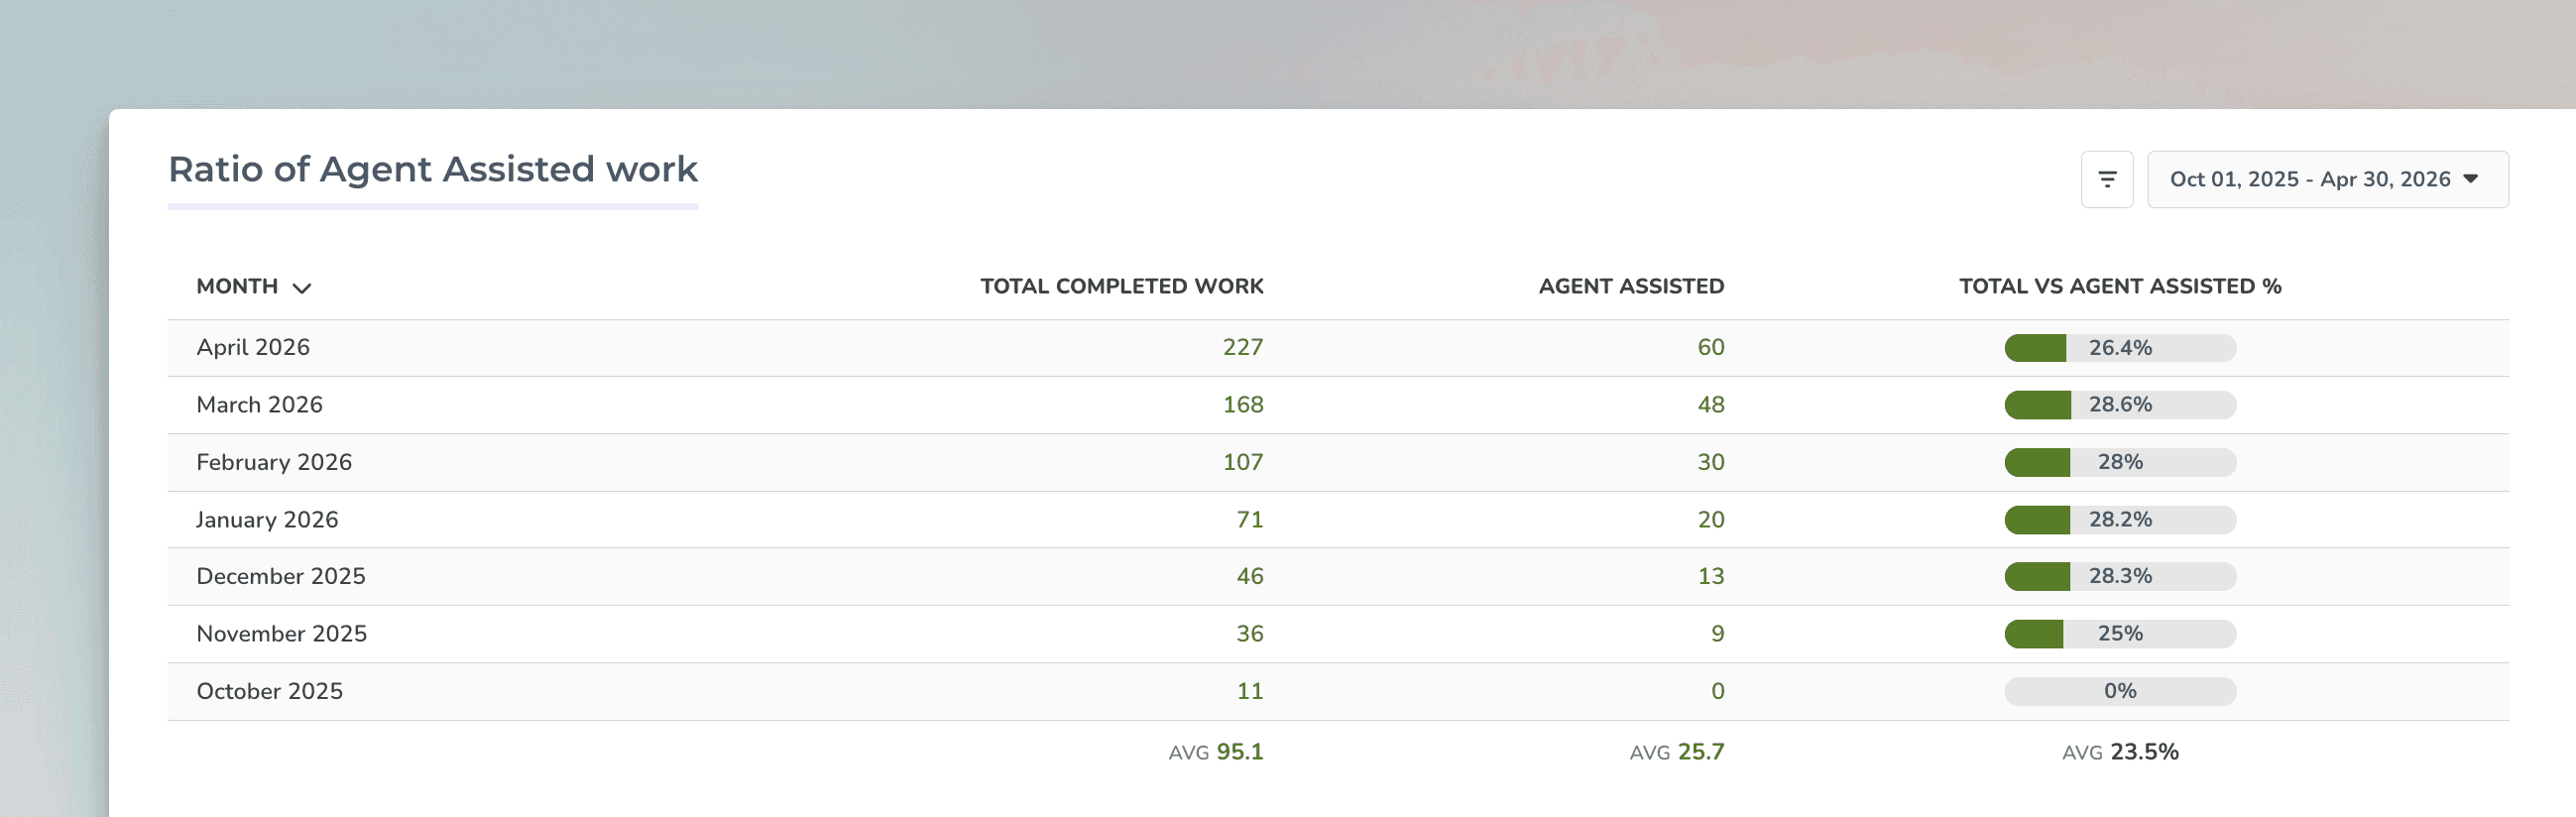
Across the entire seven-month timeframe, an average of 23.5% of all completed issues utilized an agent delegate in Linear. Following initial adoption in November 2025 (25%), the share of agent-assisted work was fairly stable, remaining between 26.4% and 28.6% for five consecutive months.
Create the report from a template
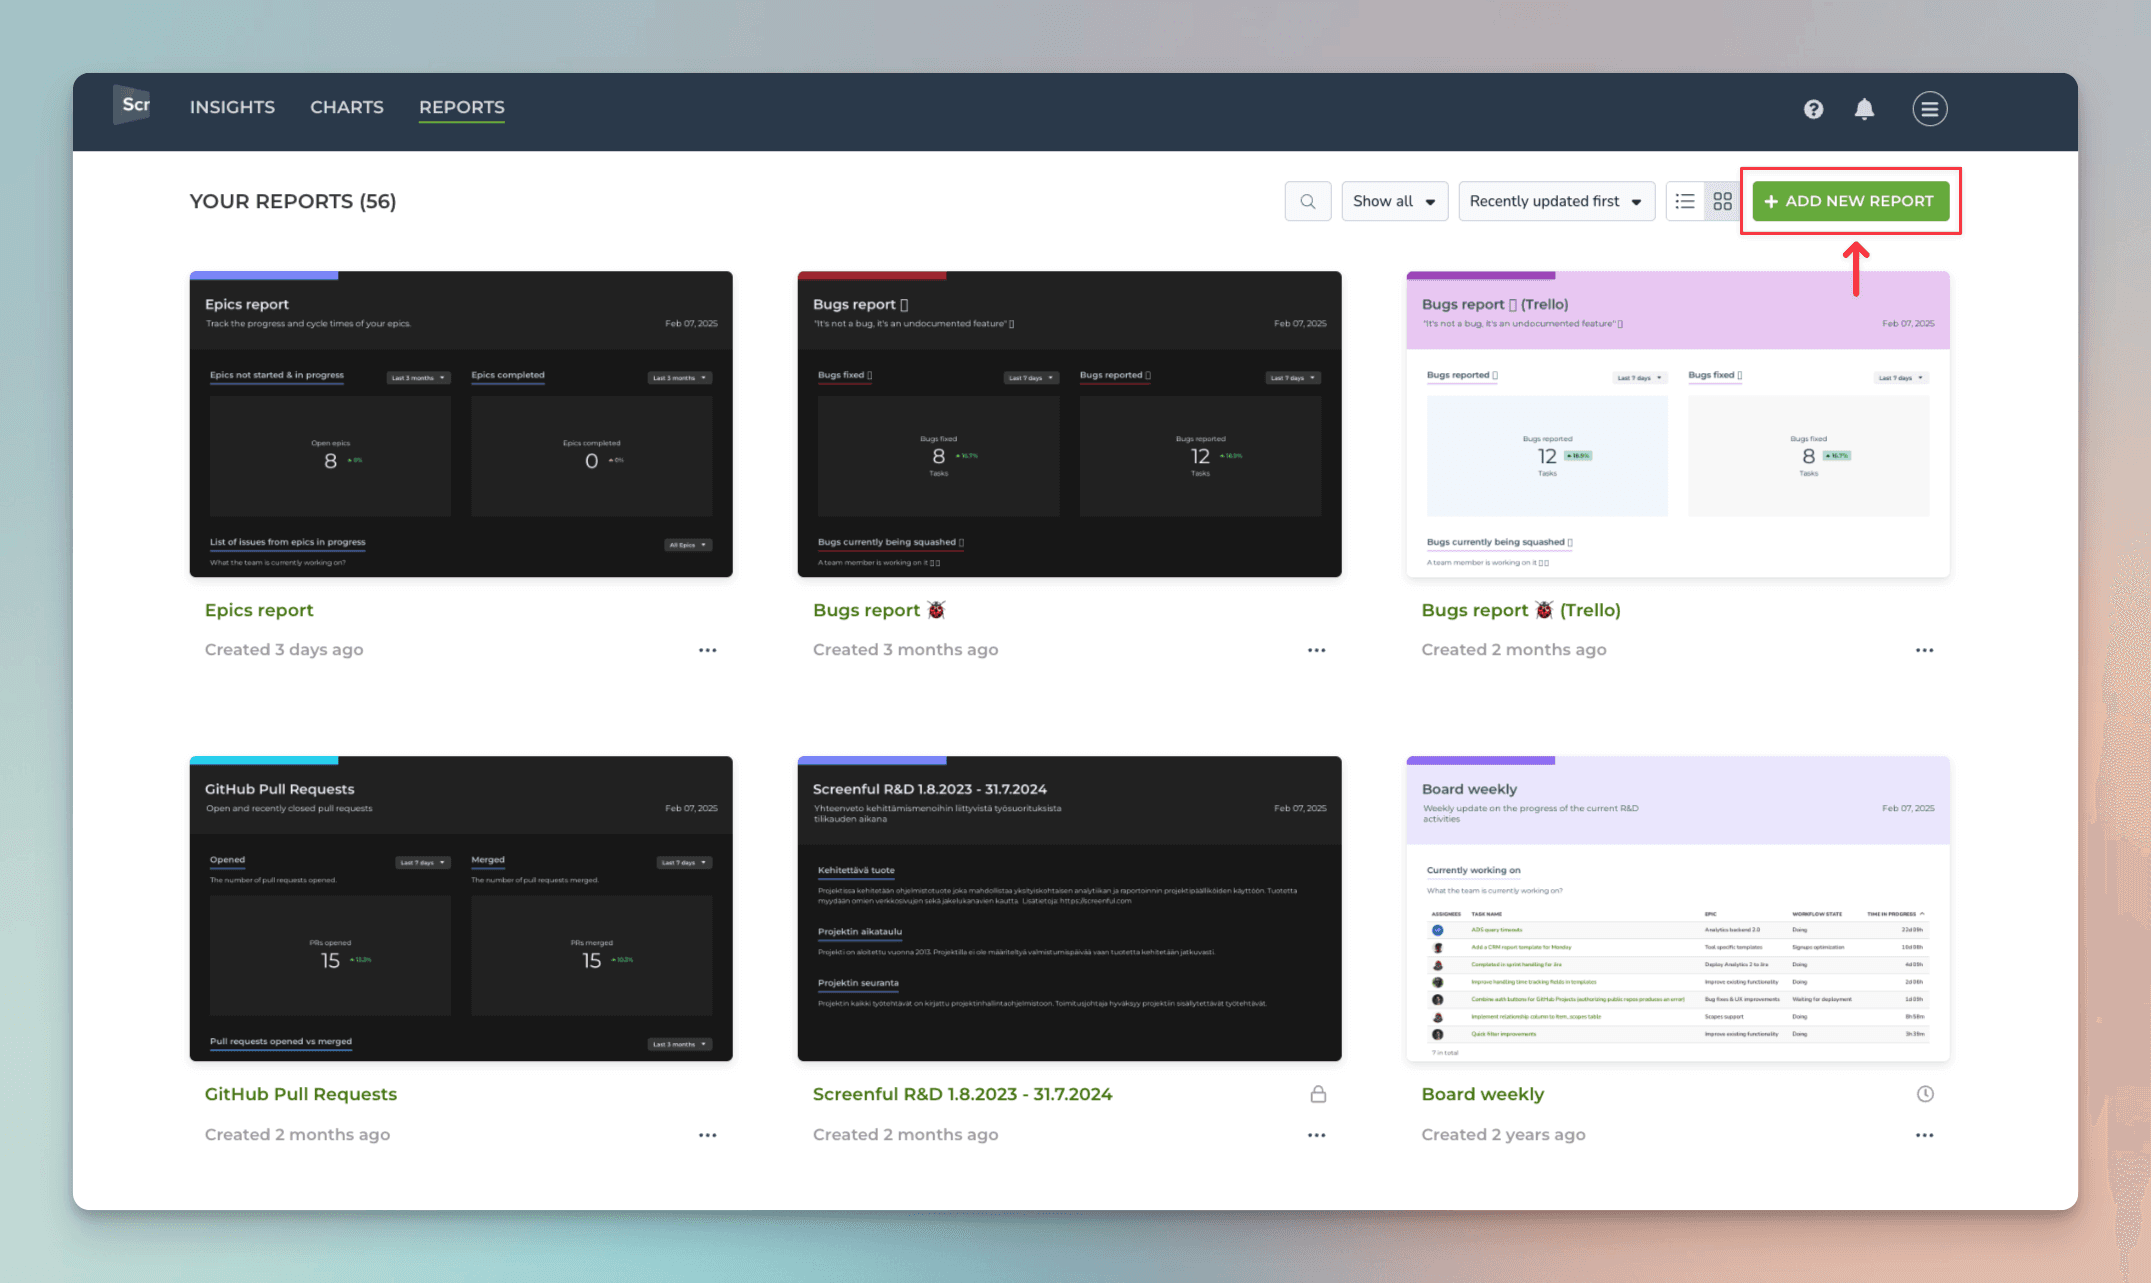
You can create a Agent-Assisted Delivery report by using a report template. The report contains the charts introduced in this post. In Screenful UI, go to the Reports tab and click Add new report:
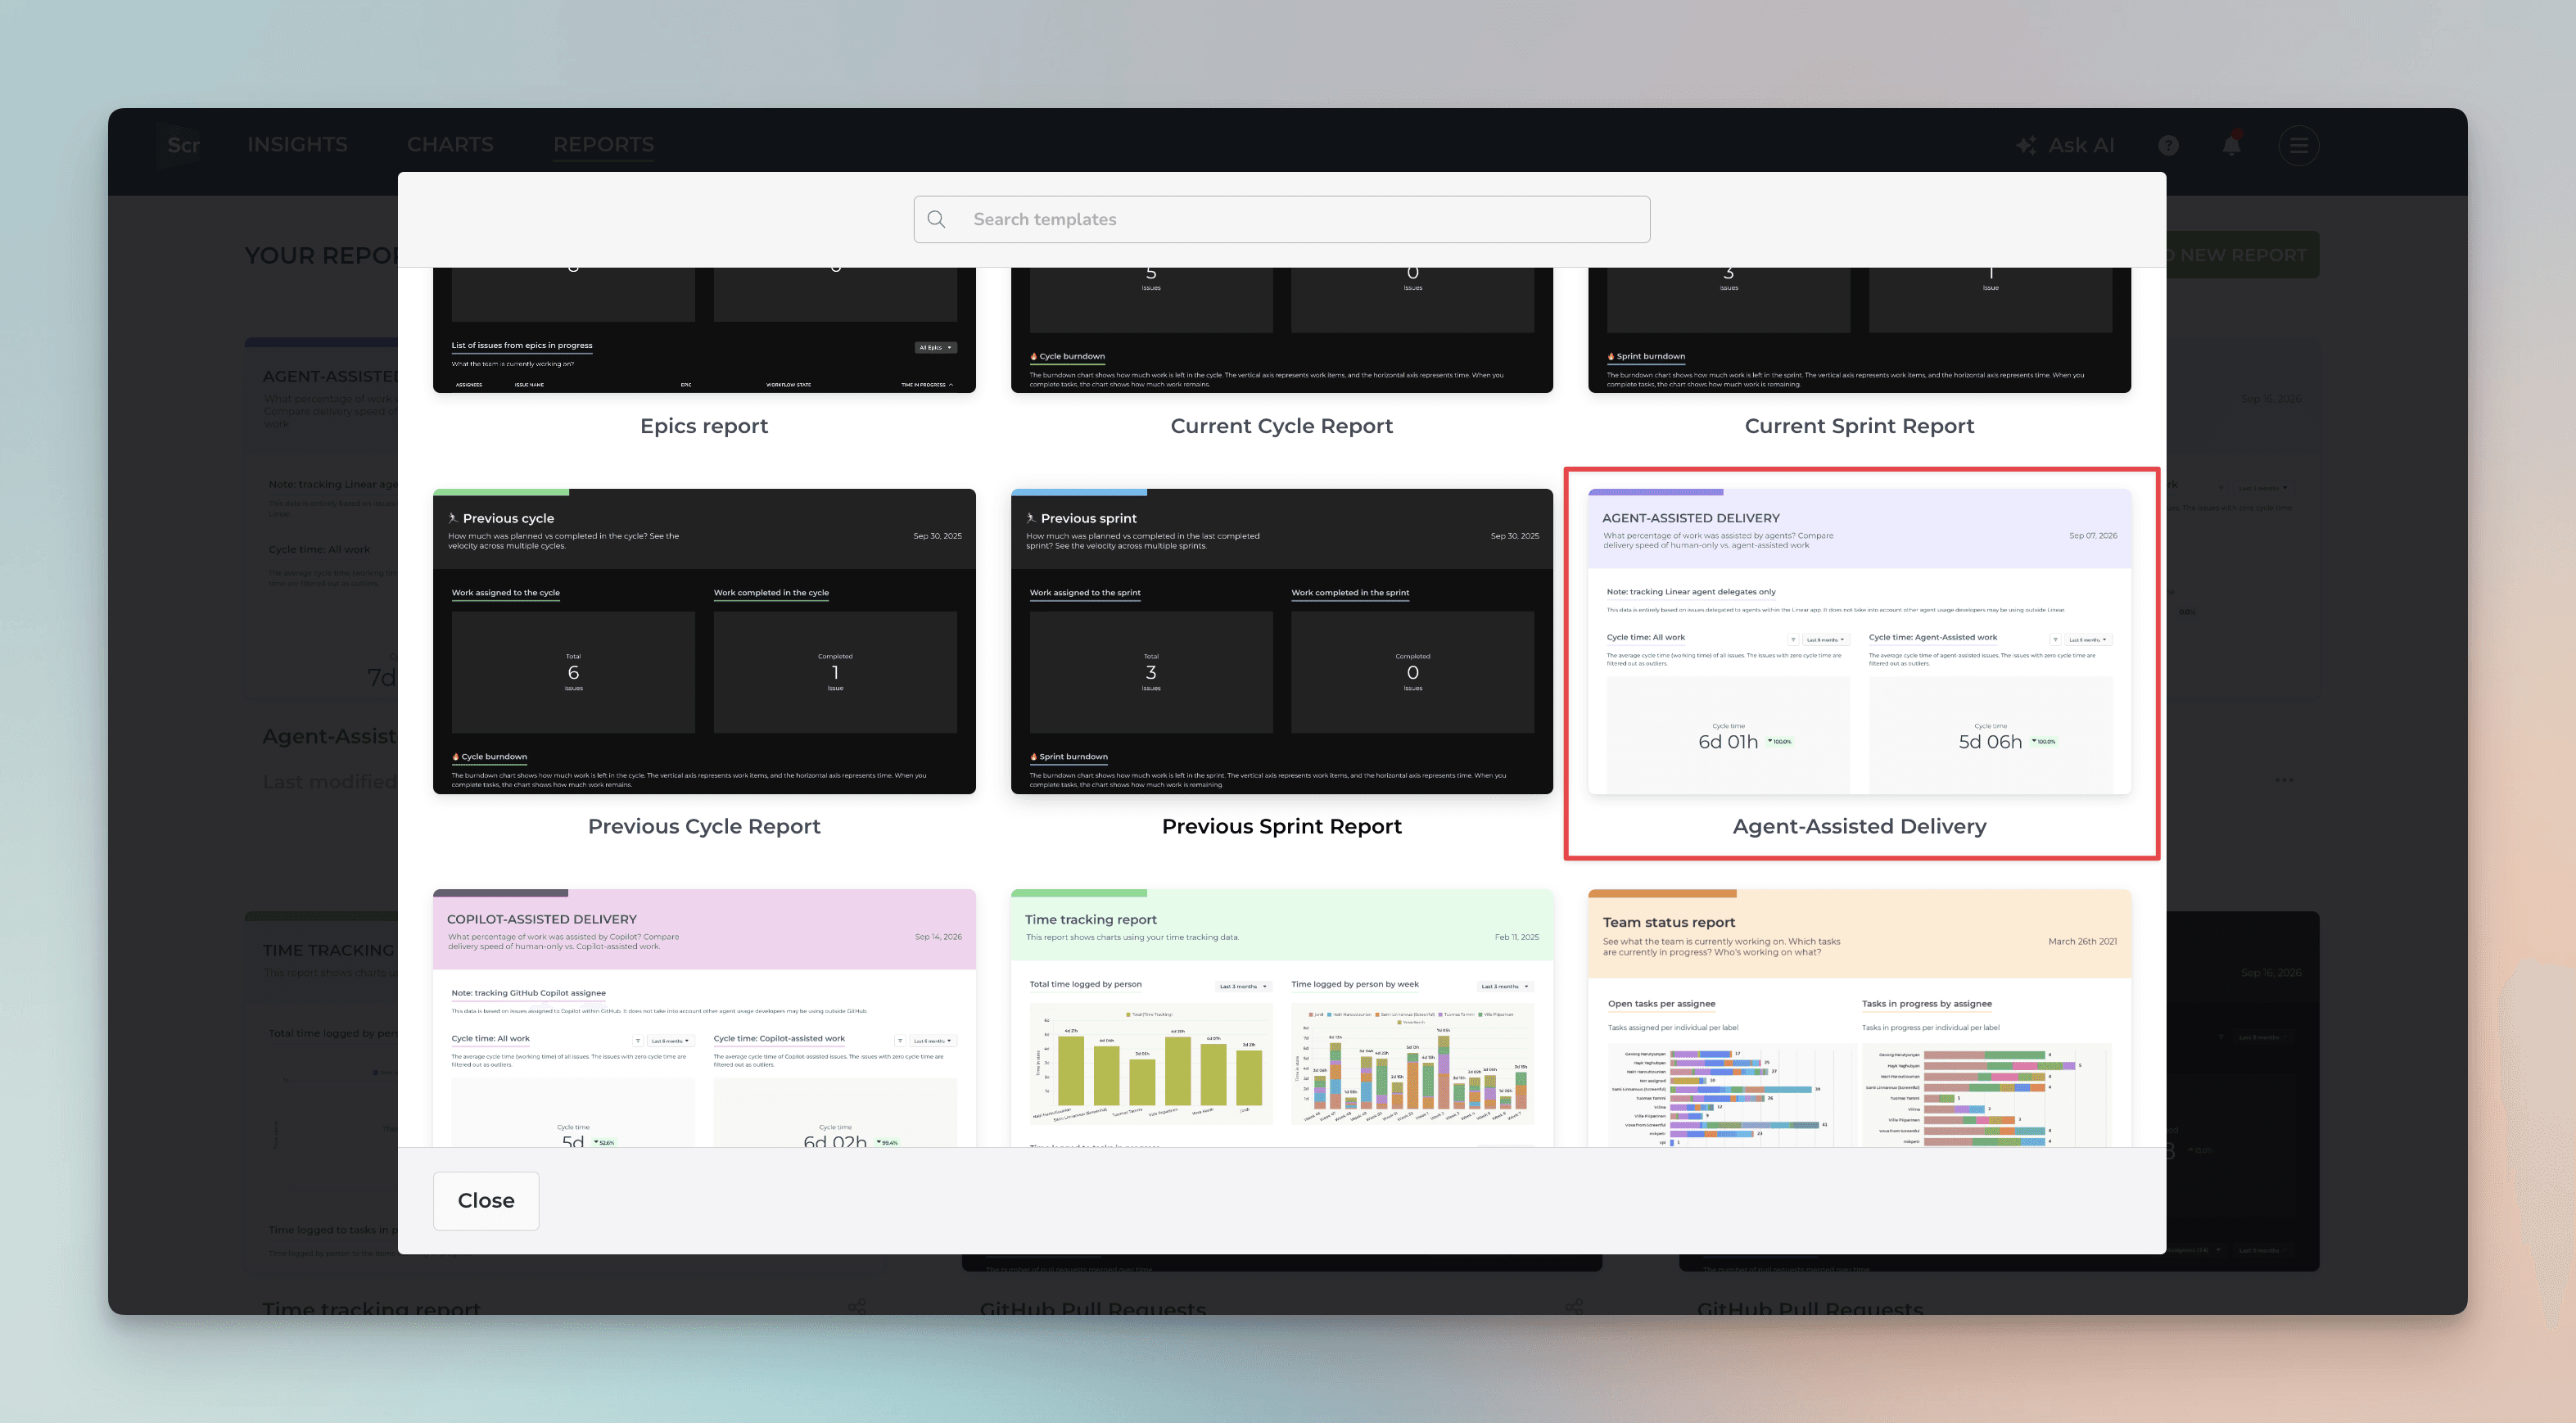
A modal opens, showing the available report templates. Select Agent-Assisted Delivery:
A report is created containing agent delegate data from the selected Linear data sources:
You can share the report with others by scheduling it via email or Slack.
About Screenful
Screenful provides multidimensional analytics of the data in Linear. You can slice & dice your data with 15 different chart types, and click through to drill into details.
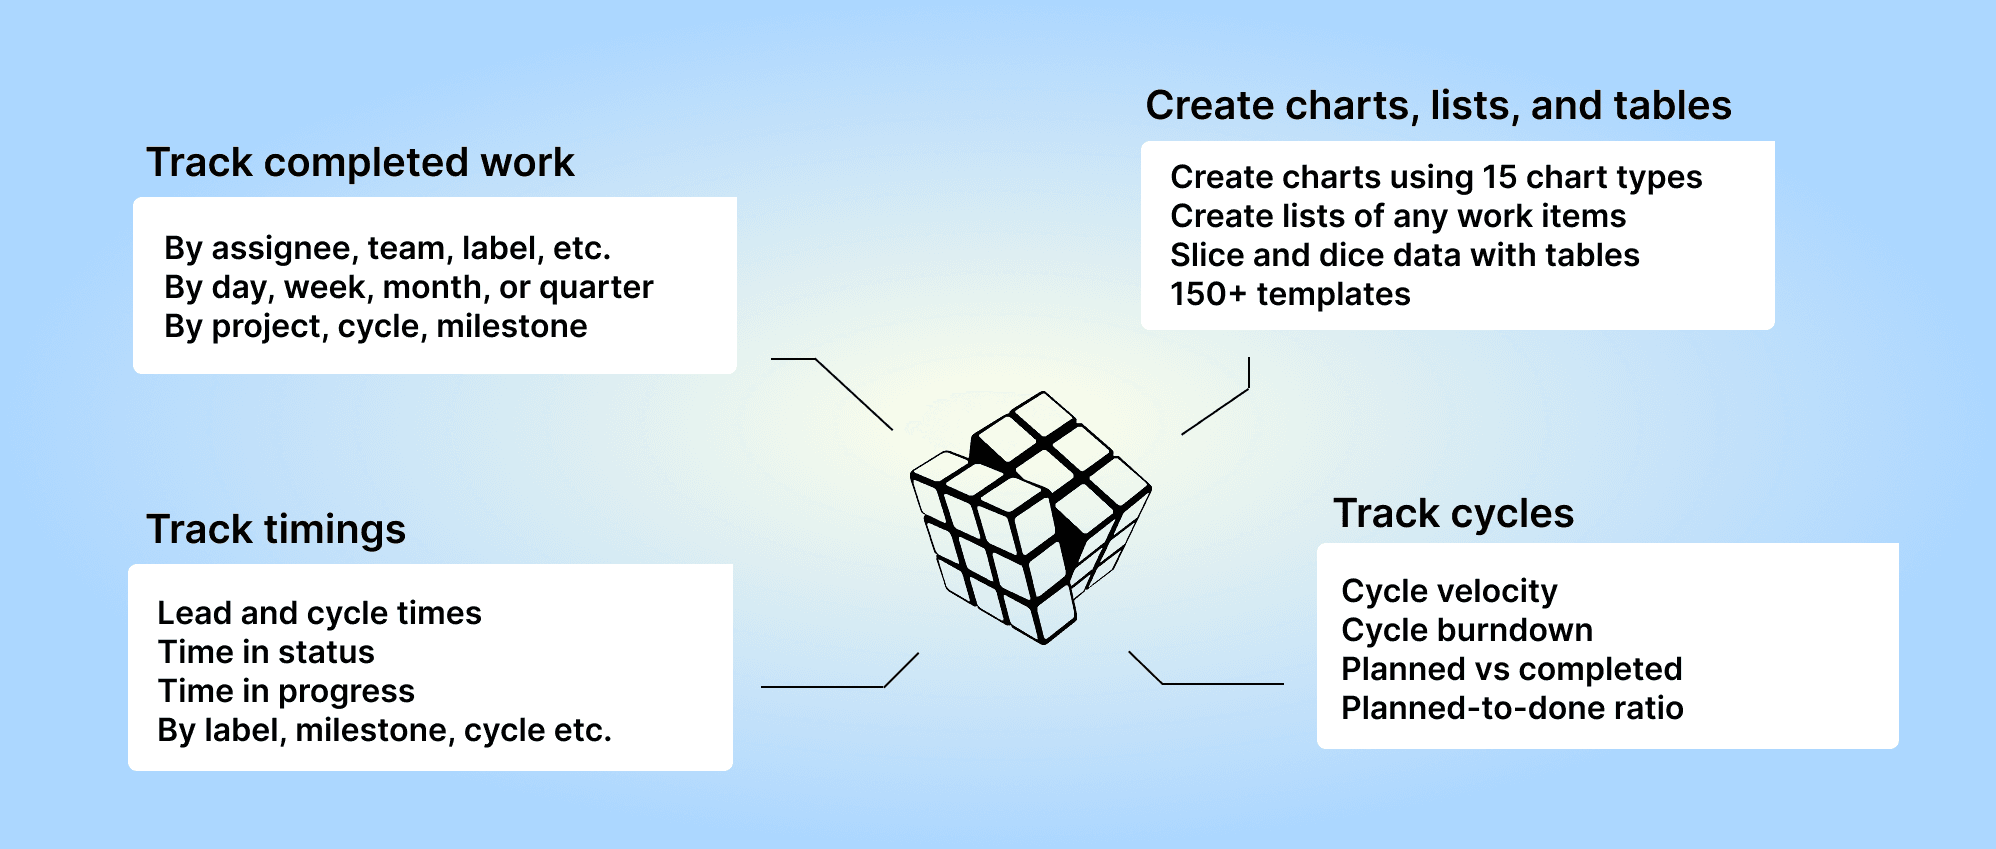
Analytics & Reports by Screenful is available in Linear integrations. For more information, see the guide for setting up Screenful with Linear.
Let us know if you have questions or feedback by contacting hello@screenful.com. To stay on the loop, read our blog, or follow us on LinkedIn.

Screenful MCP server is coming soon
Use your Screenful project data inside your favorite AI tools. Join the waitlist.