
💊 Reports on Steroids part 5: Text formatting, copy & paste charts, new templates
This is the fifth release in a series related to improvements for our reports feature. You can find the notes of the previous releases here:
Reports on Steroids part 1: Configurable summaries
Reports on Steroids part 2: Introducing the new report editor
Reports on Steroids part 3: Send to selected users, new colors, and more
Reports on Steroids part 4: Show date range menu in reports, new templates and dark mode
Time to show some 🫶 to our reports feature again! You can now add rich text formatting to your text fragments and copy & paste charts between reports. We also have introduced two new report templates for tracking agentic work.
Contents:
Add text fragments with formatting
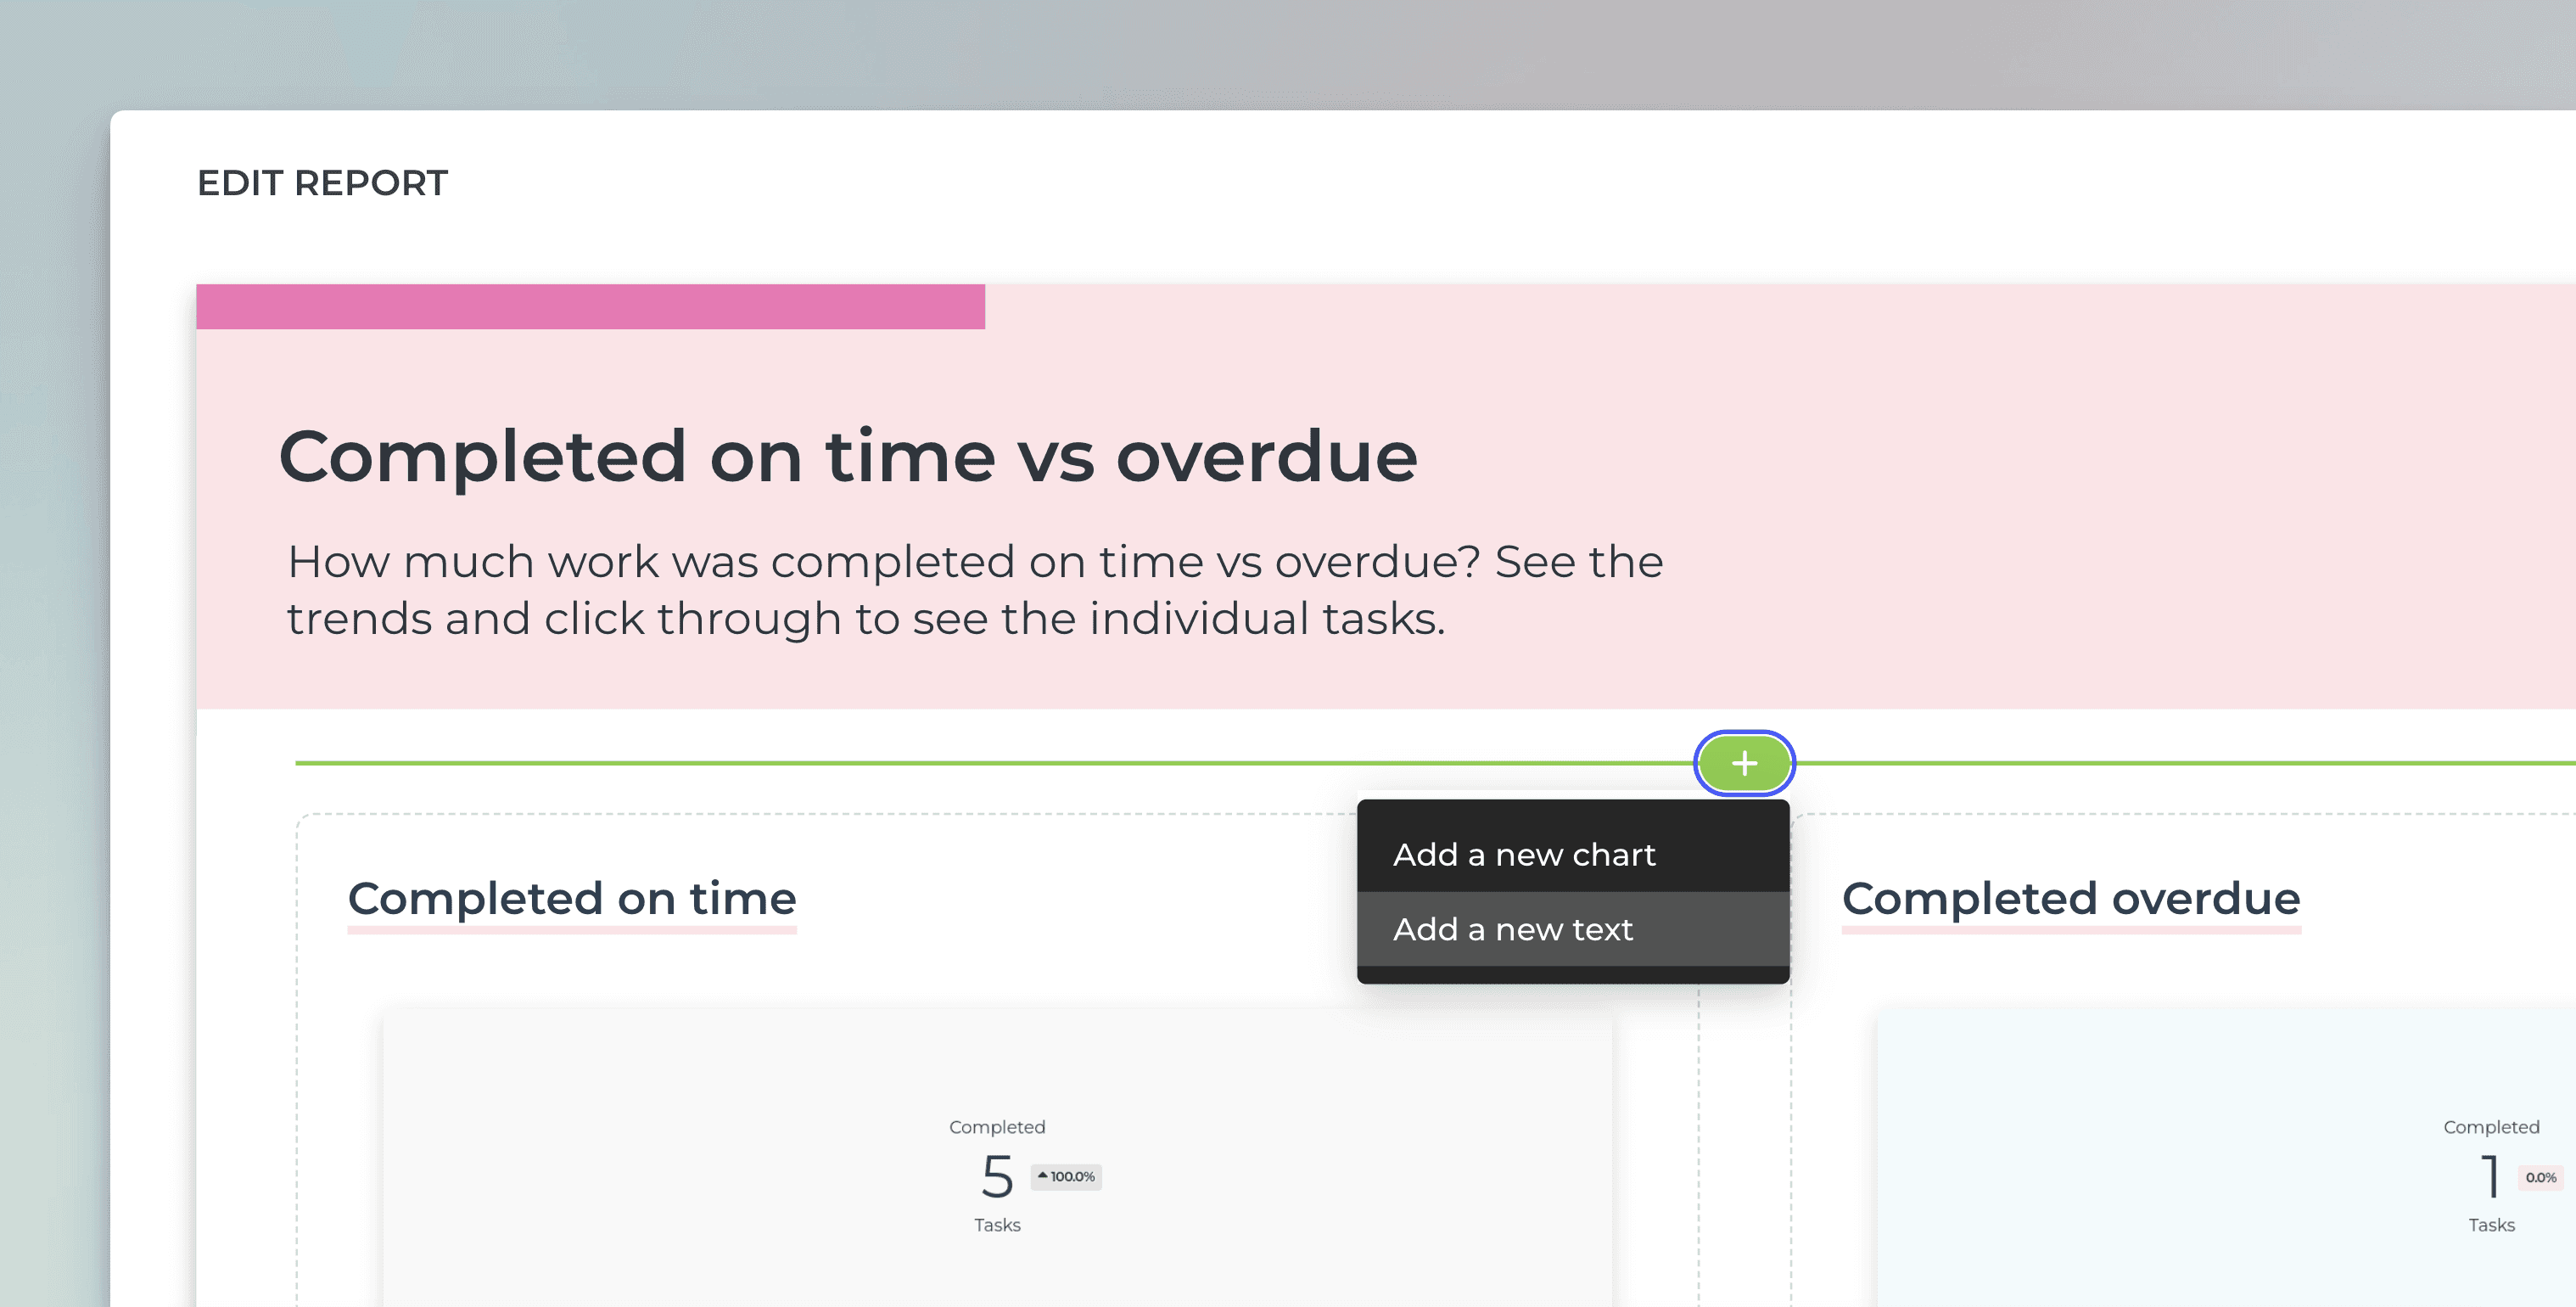
You can now add formatting to the text fragments in reports. First, add a text fragment to a report:
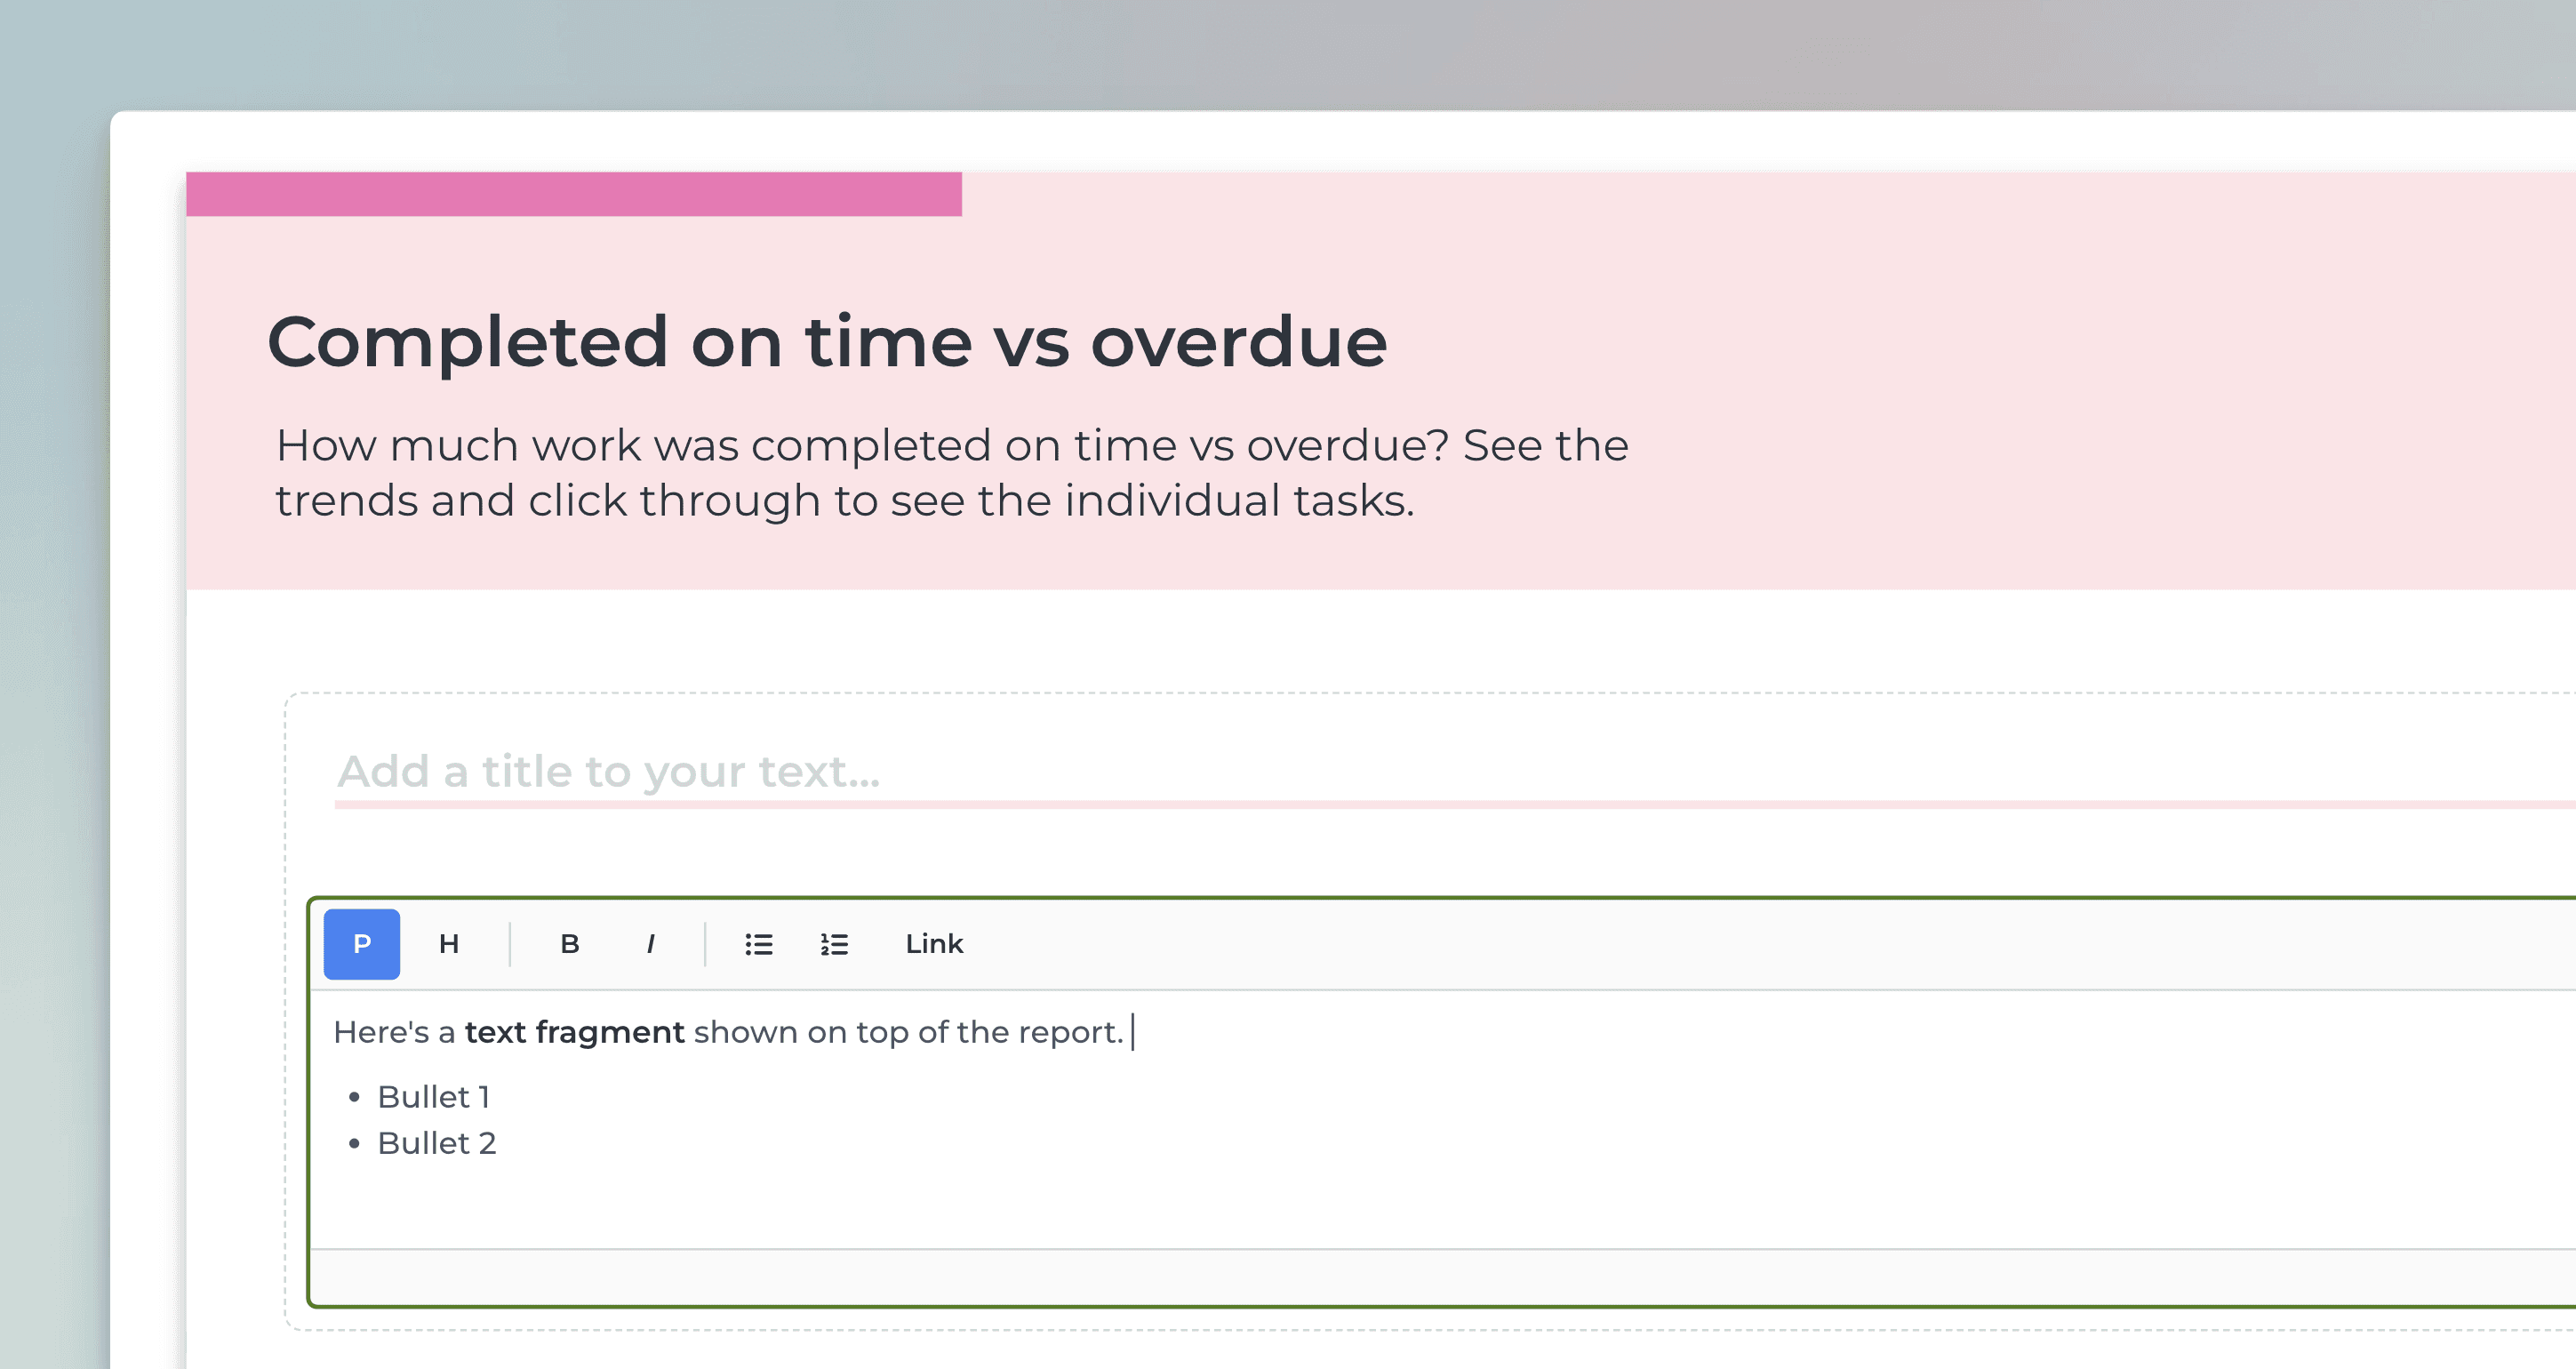
A text area component is added to the report. You can enter text and format it using the format toolbar:
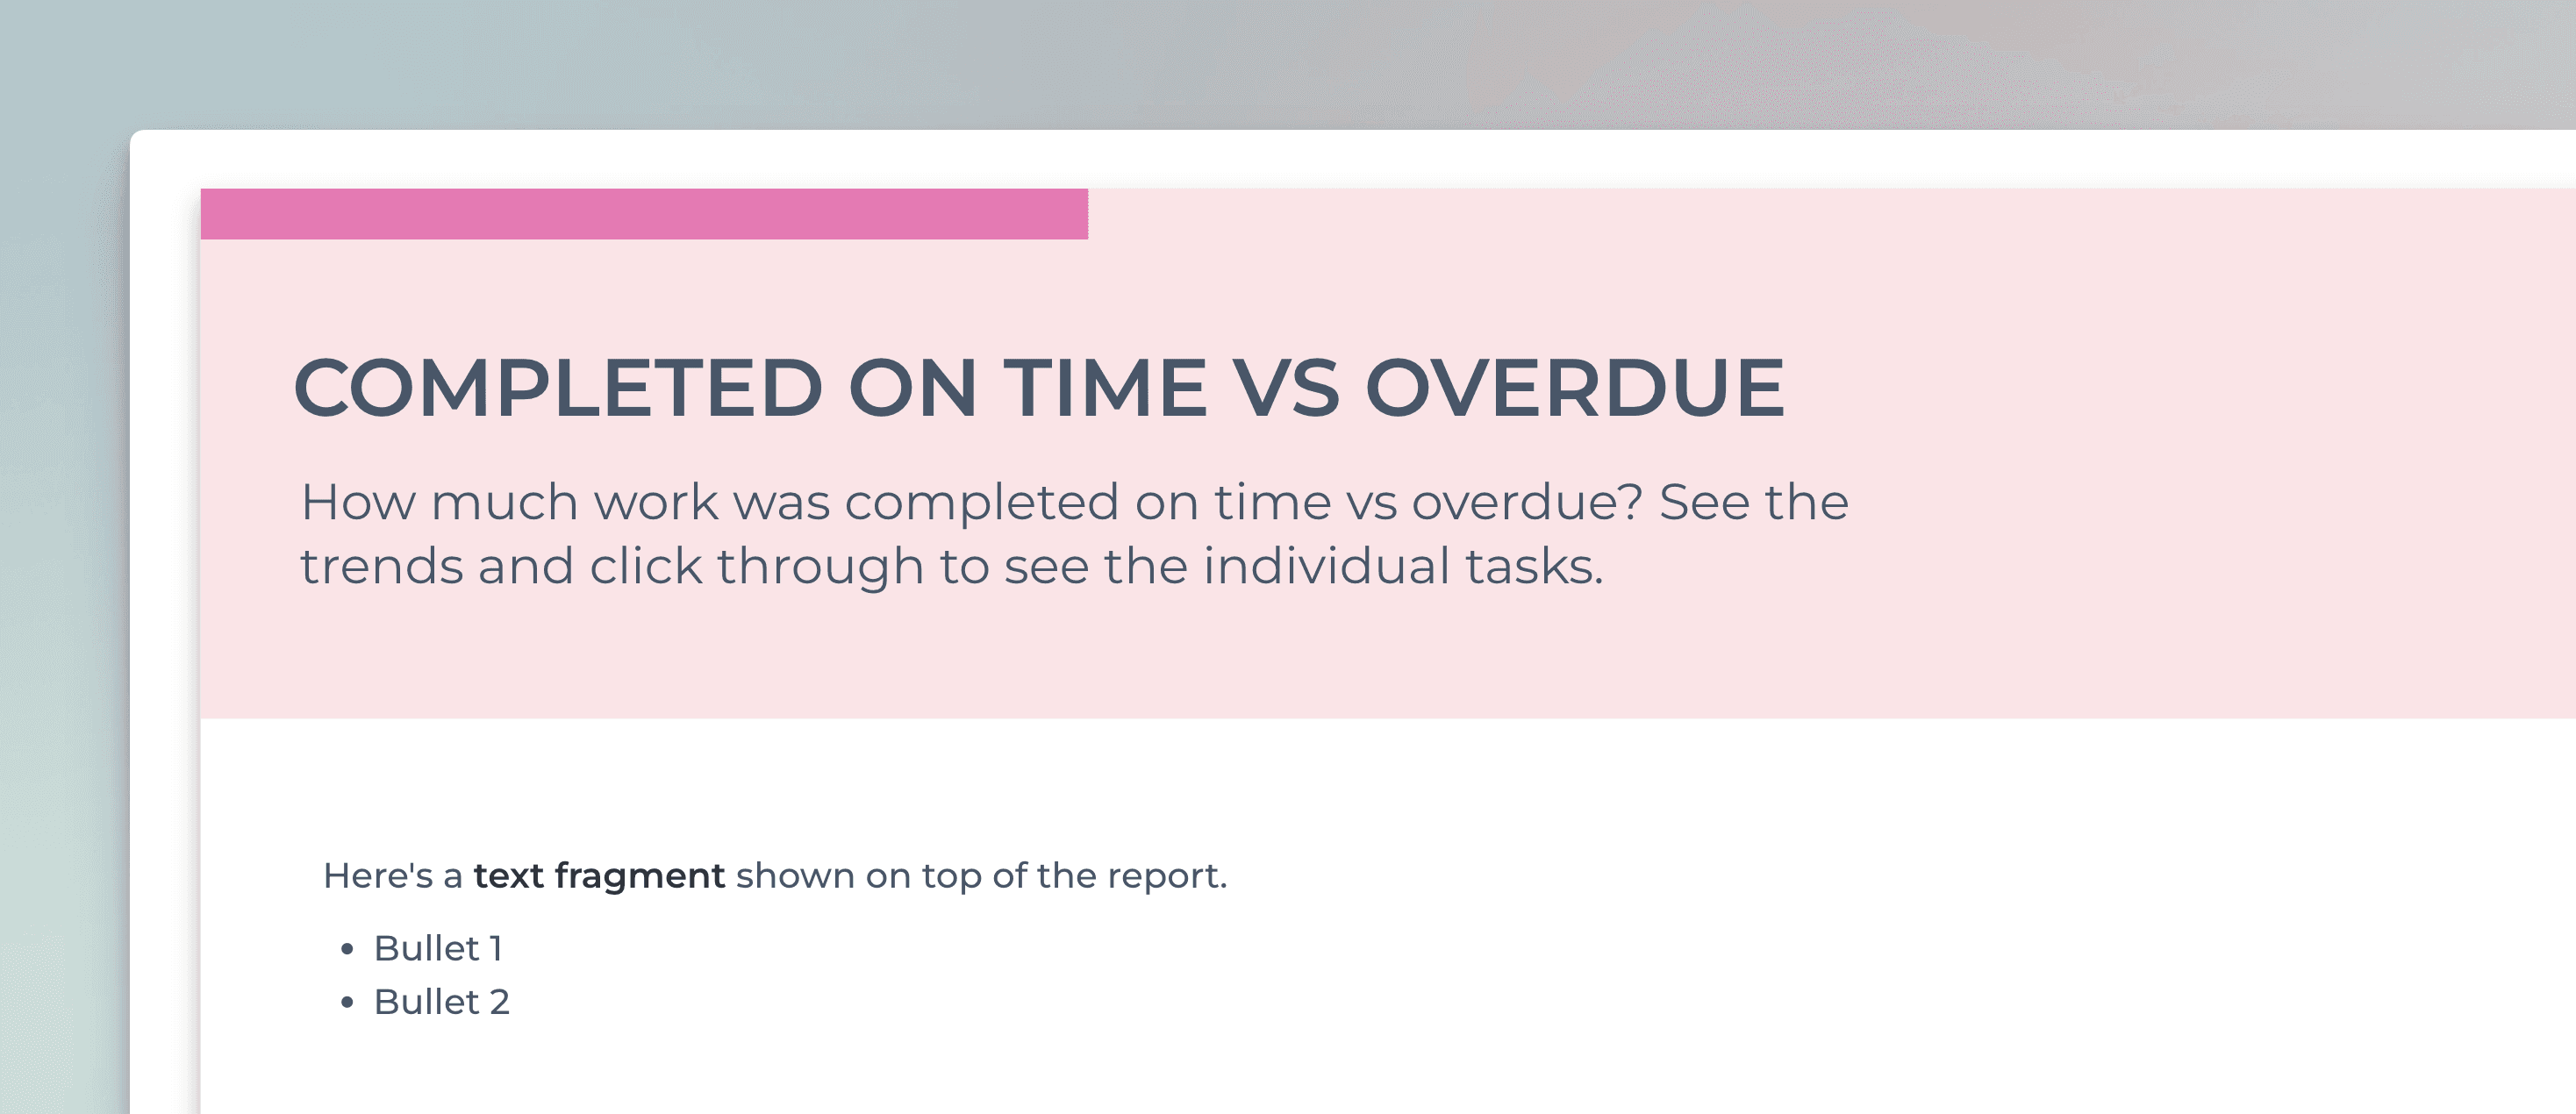
Clicking Preview shows the formatted text:
Copy & paste charts
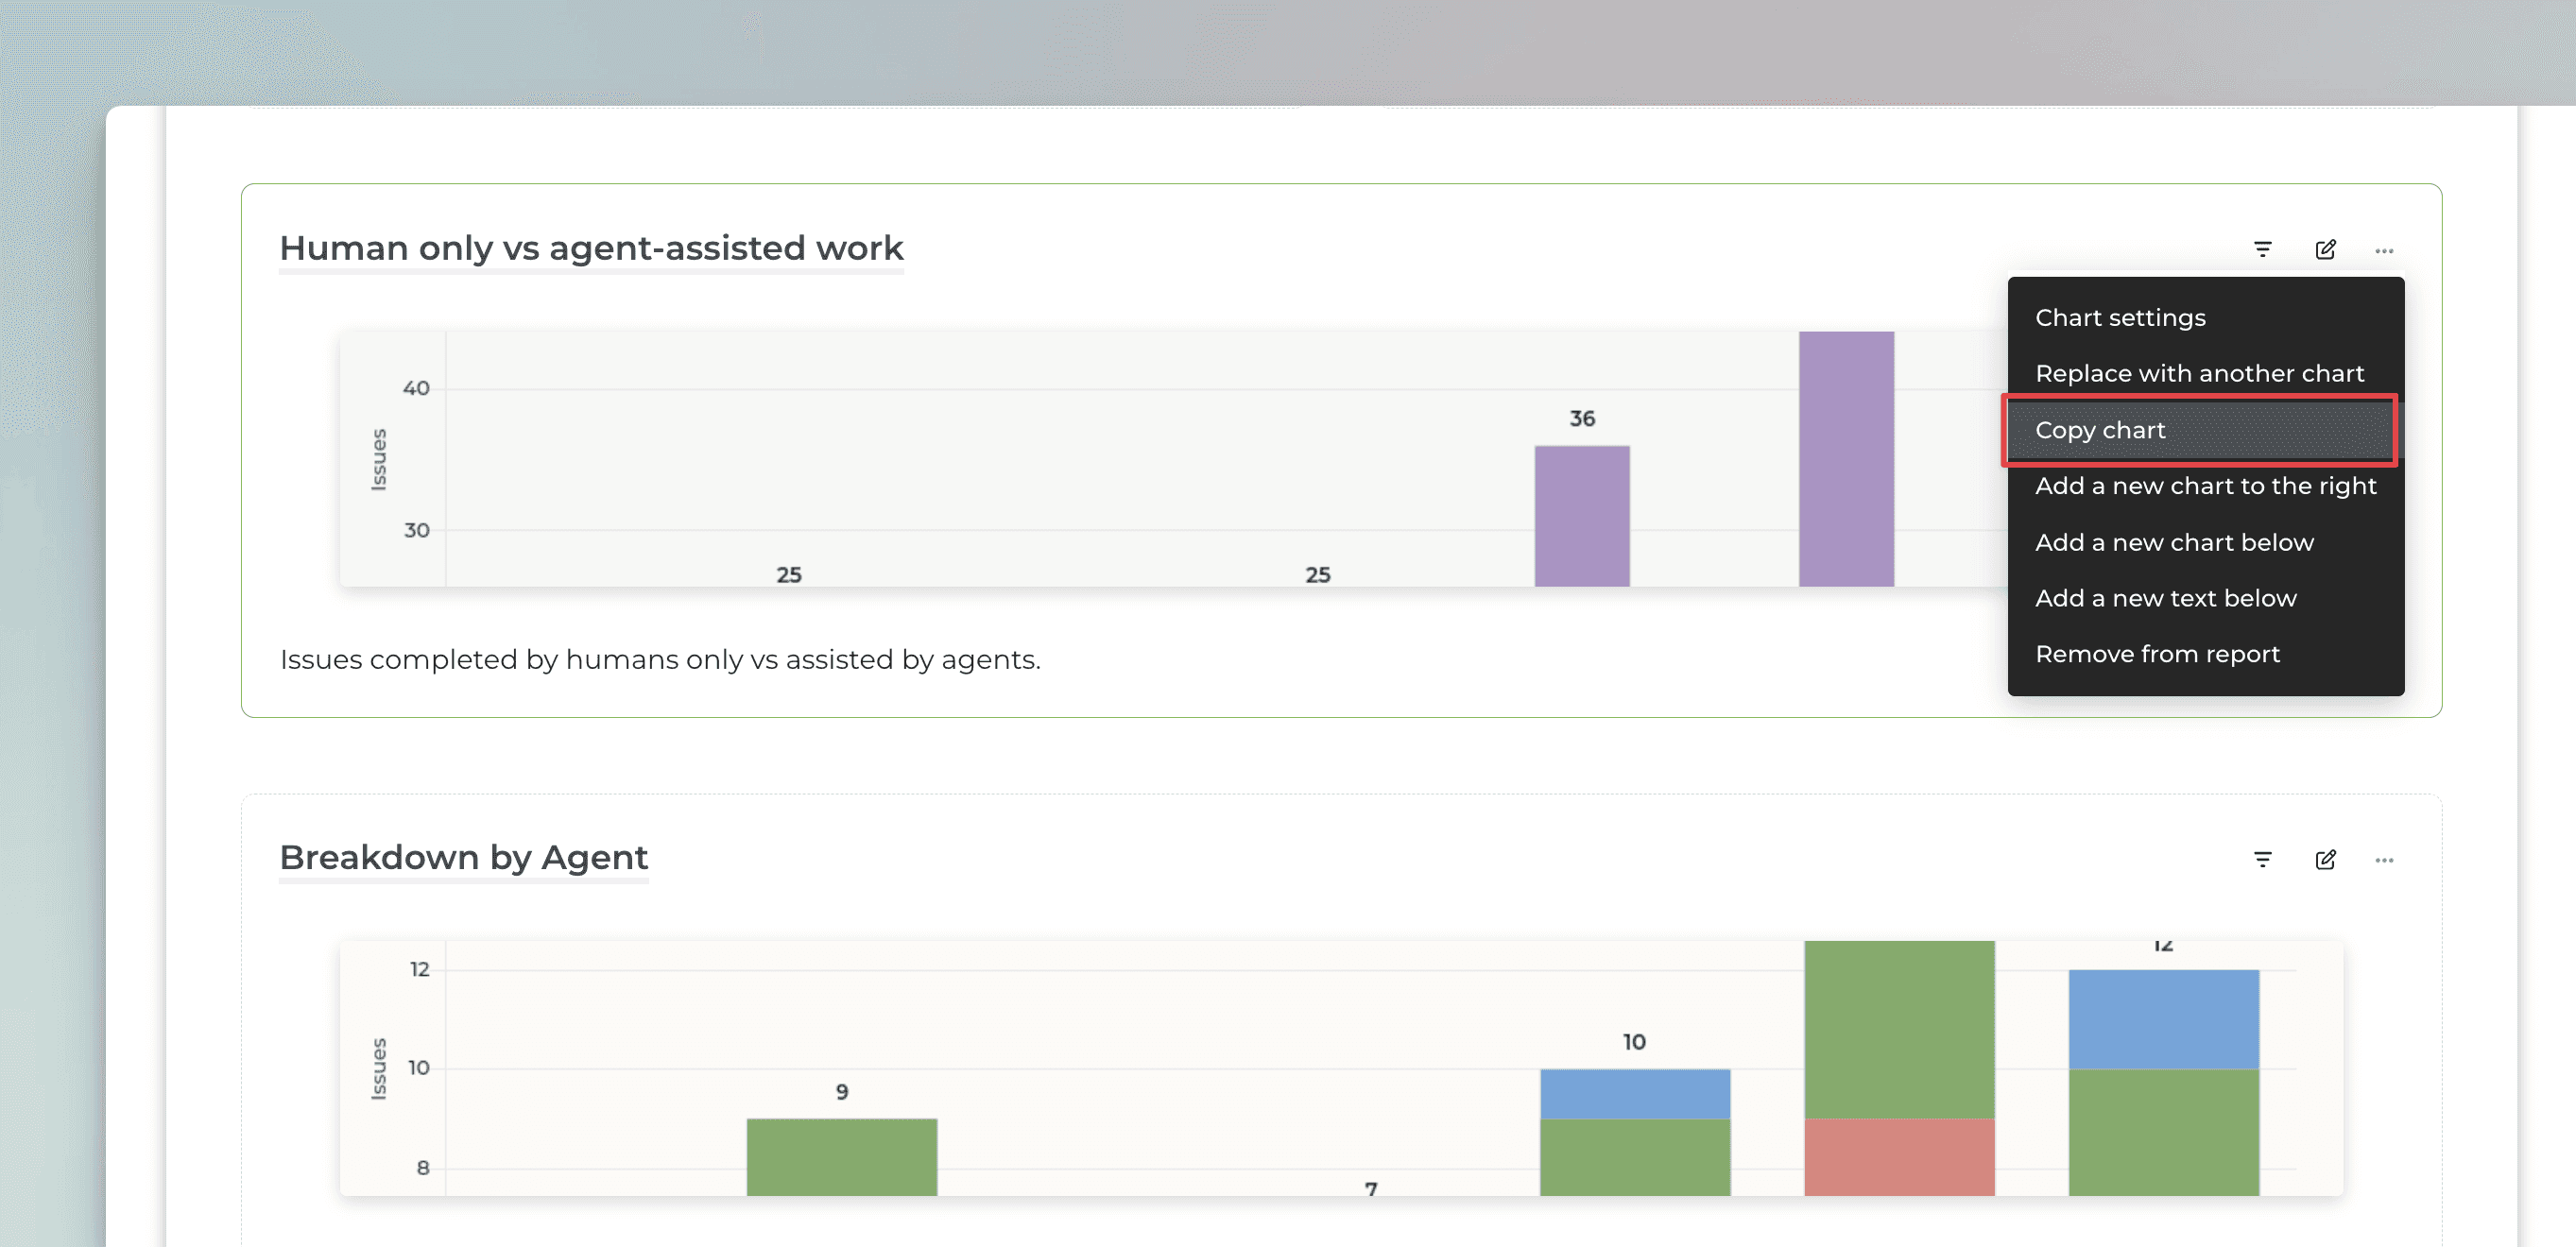
You can copy any chart in a report and paste it to the same report or to another report. You can find the Copy chart feature under the three dots menu within the report editor:
The chart gets copied, including all the settings and filters you've set. You can paste by clicking the plus ('+') icon between charts, and selecting Paste chart:
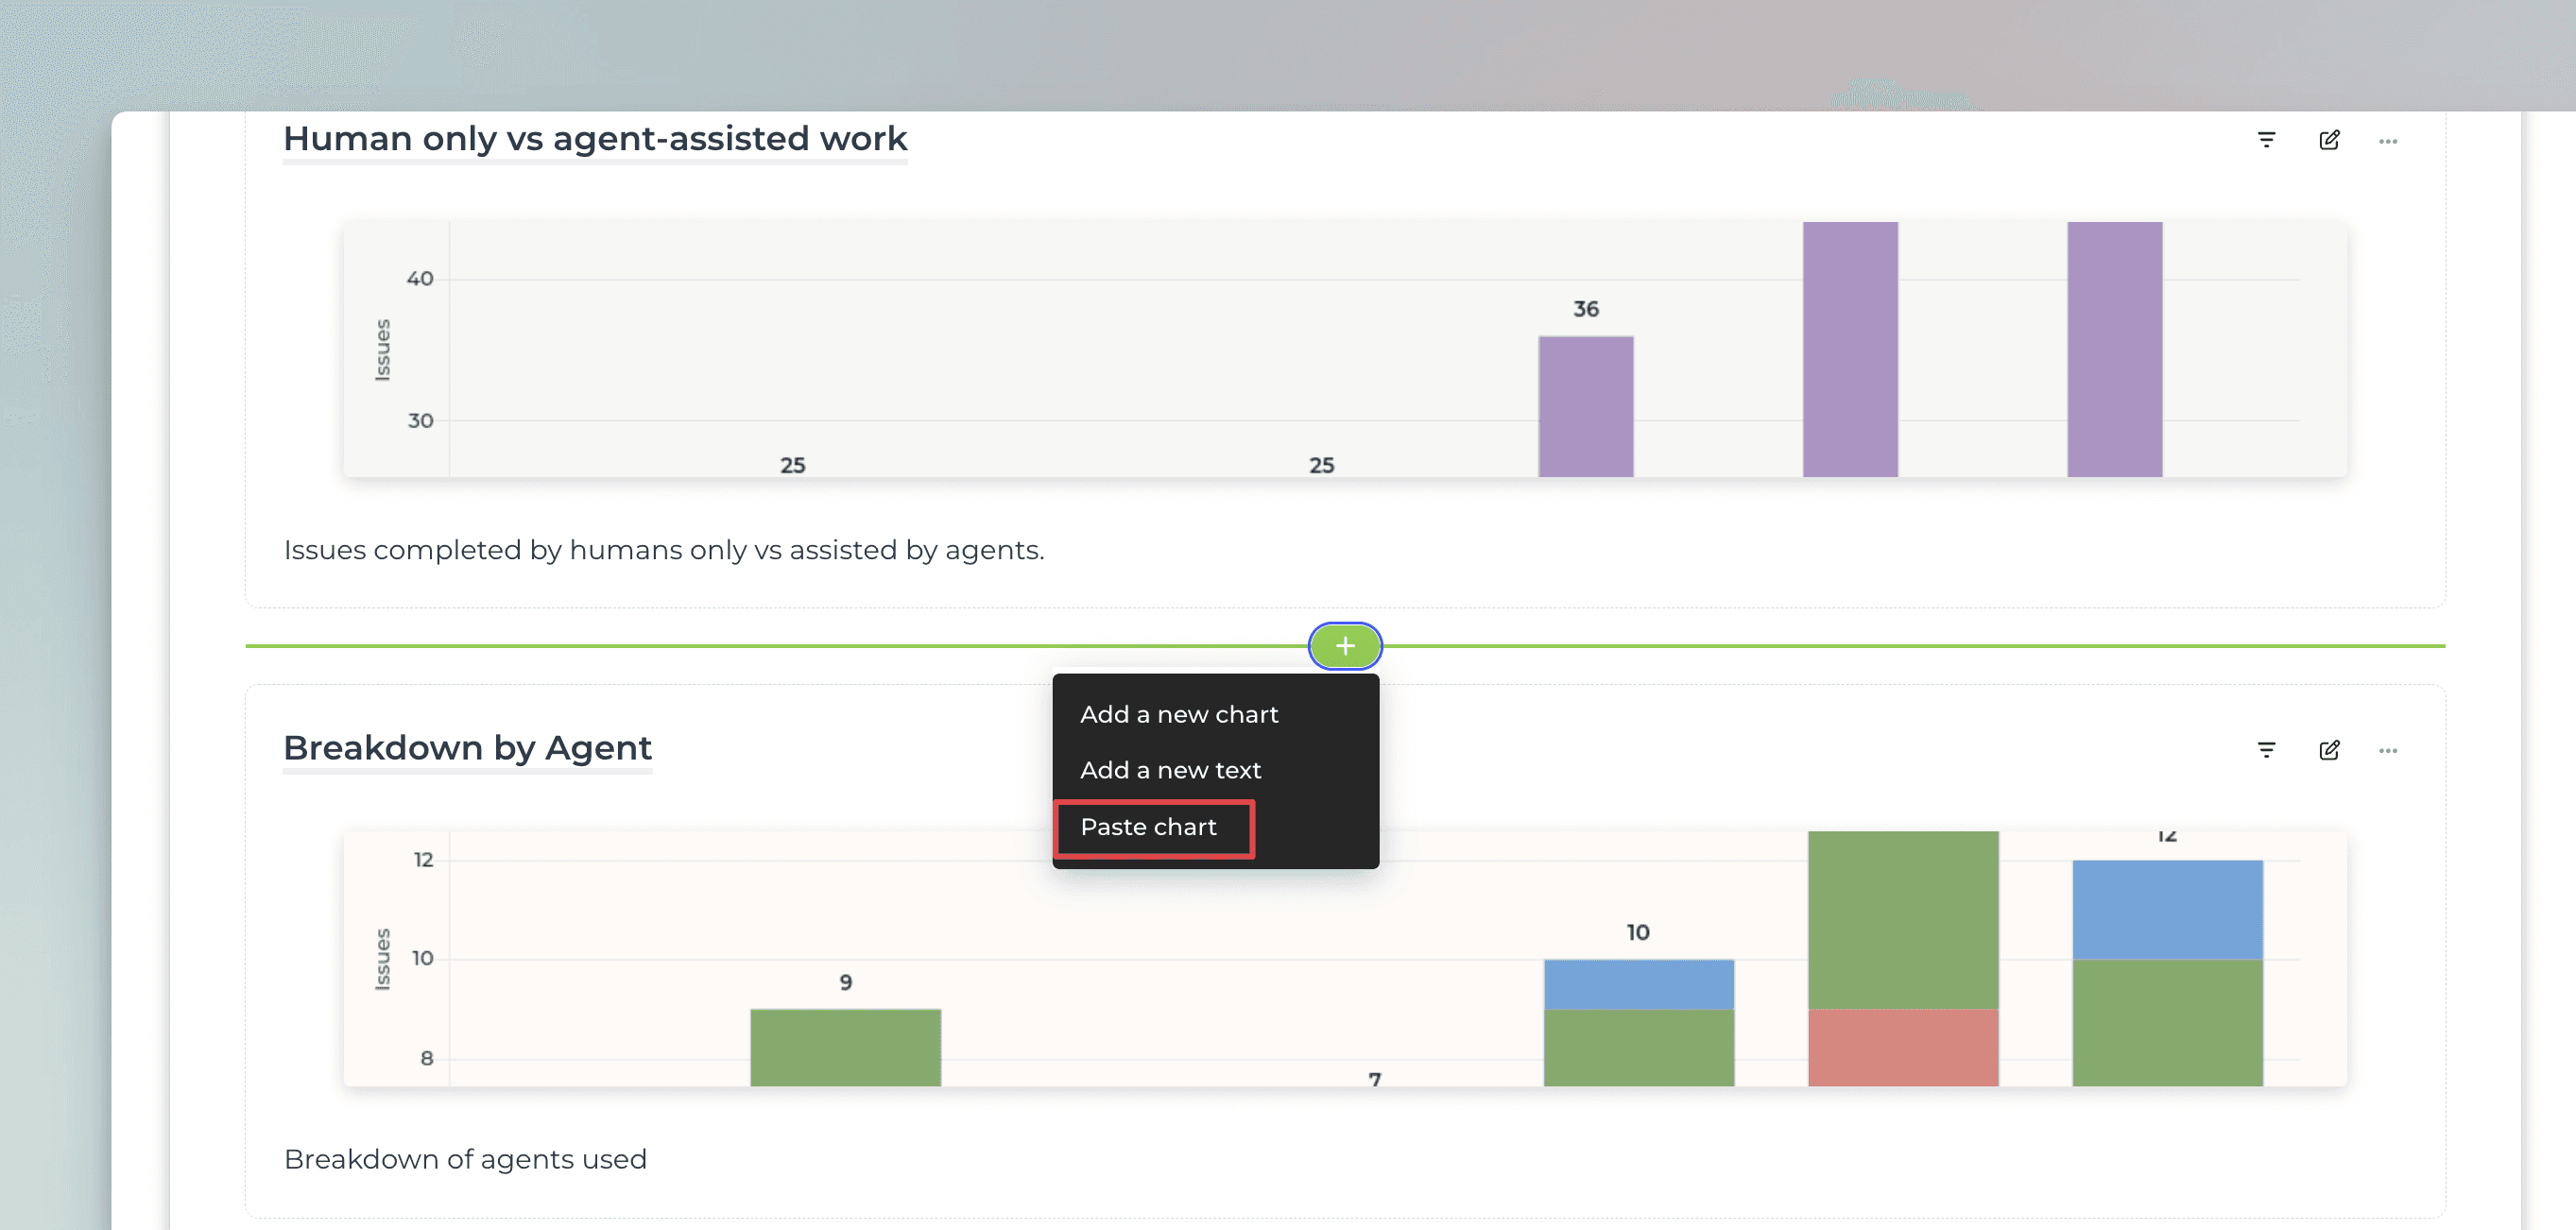
Pasting a chart creates an independent copy. You can modify the pasted chart without affecting the original.
Reveal filter with a mouse hover
We have added a filter icon for each chart in a report that allows revealing the filter used in a chart. When you hover the mouse over the filter icon, the filter is shown in a tooltip:
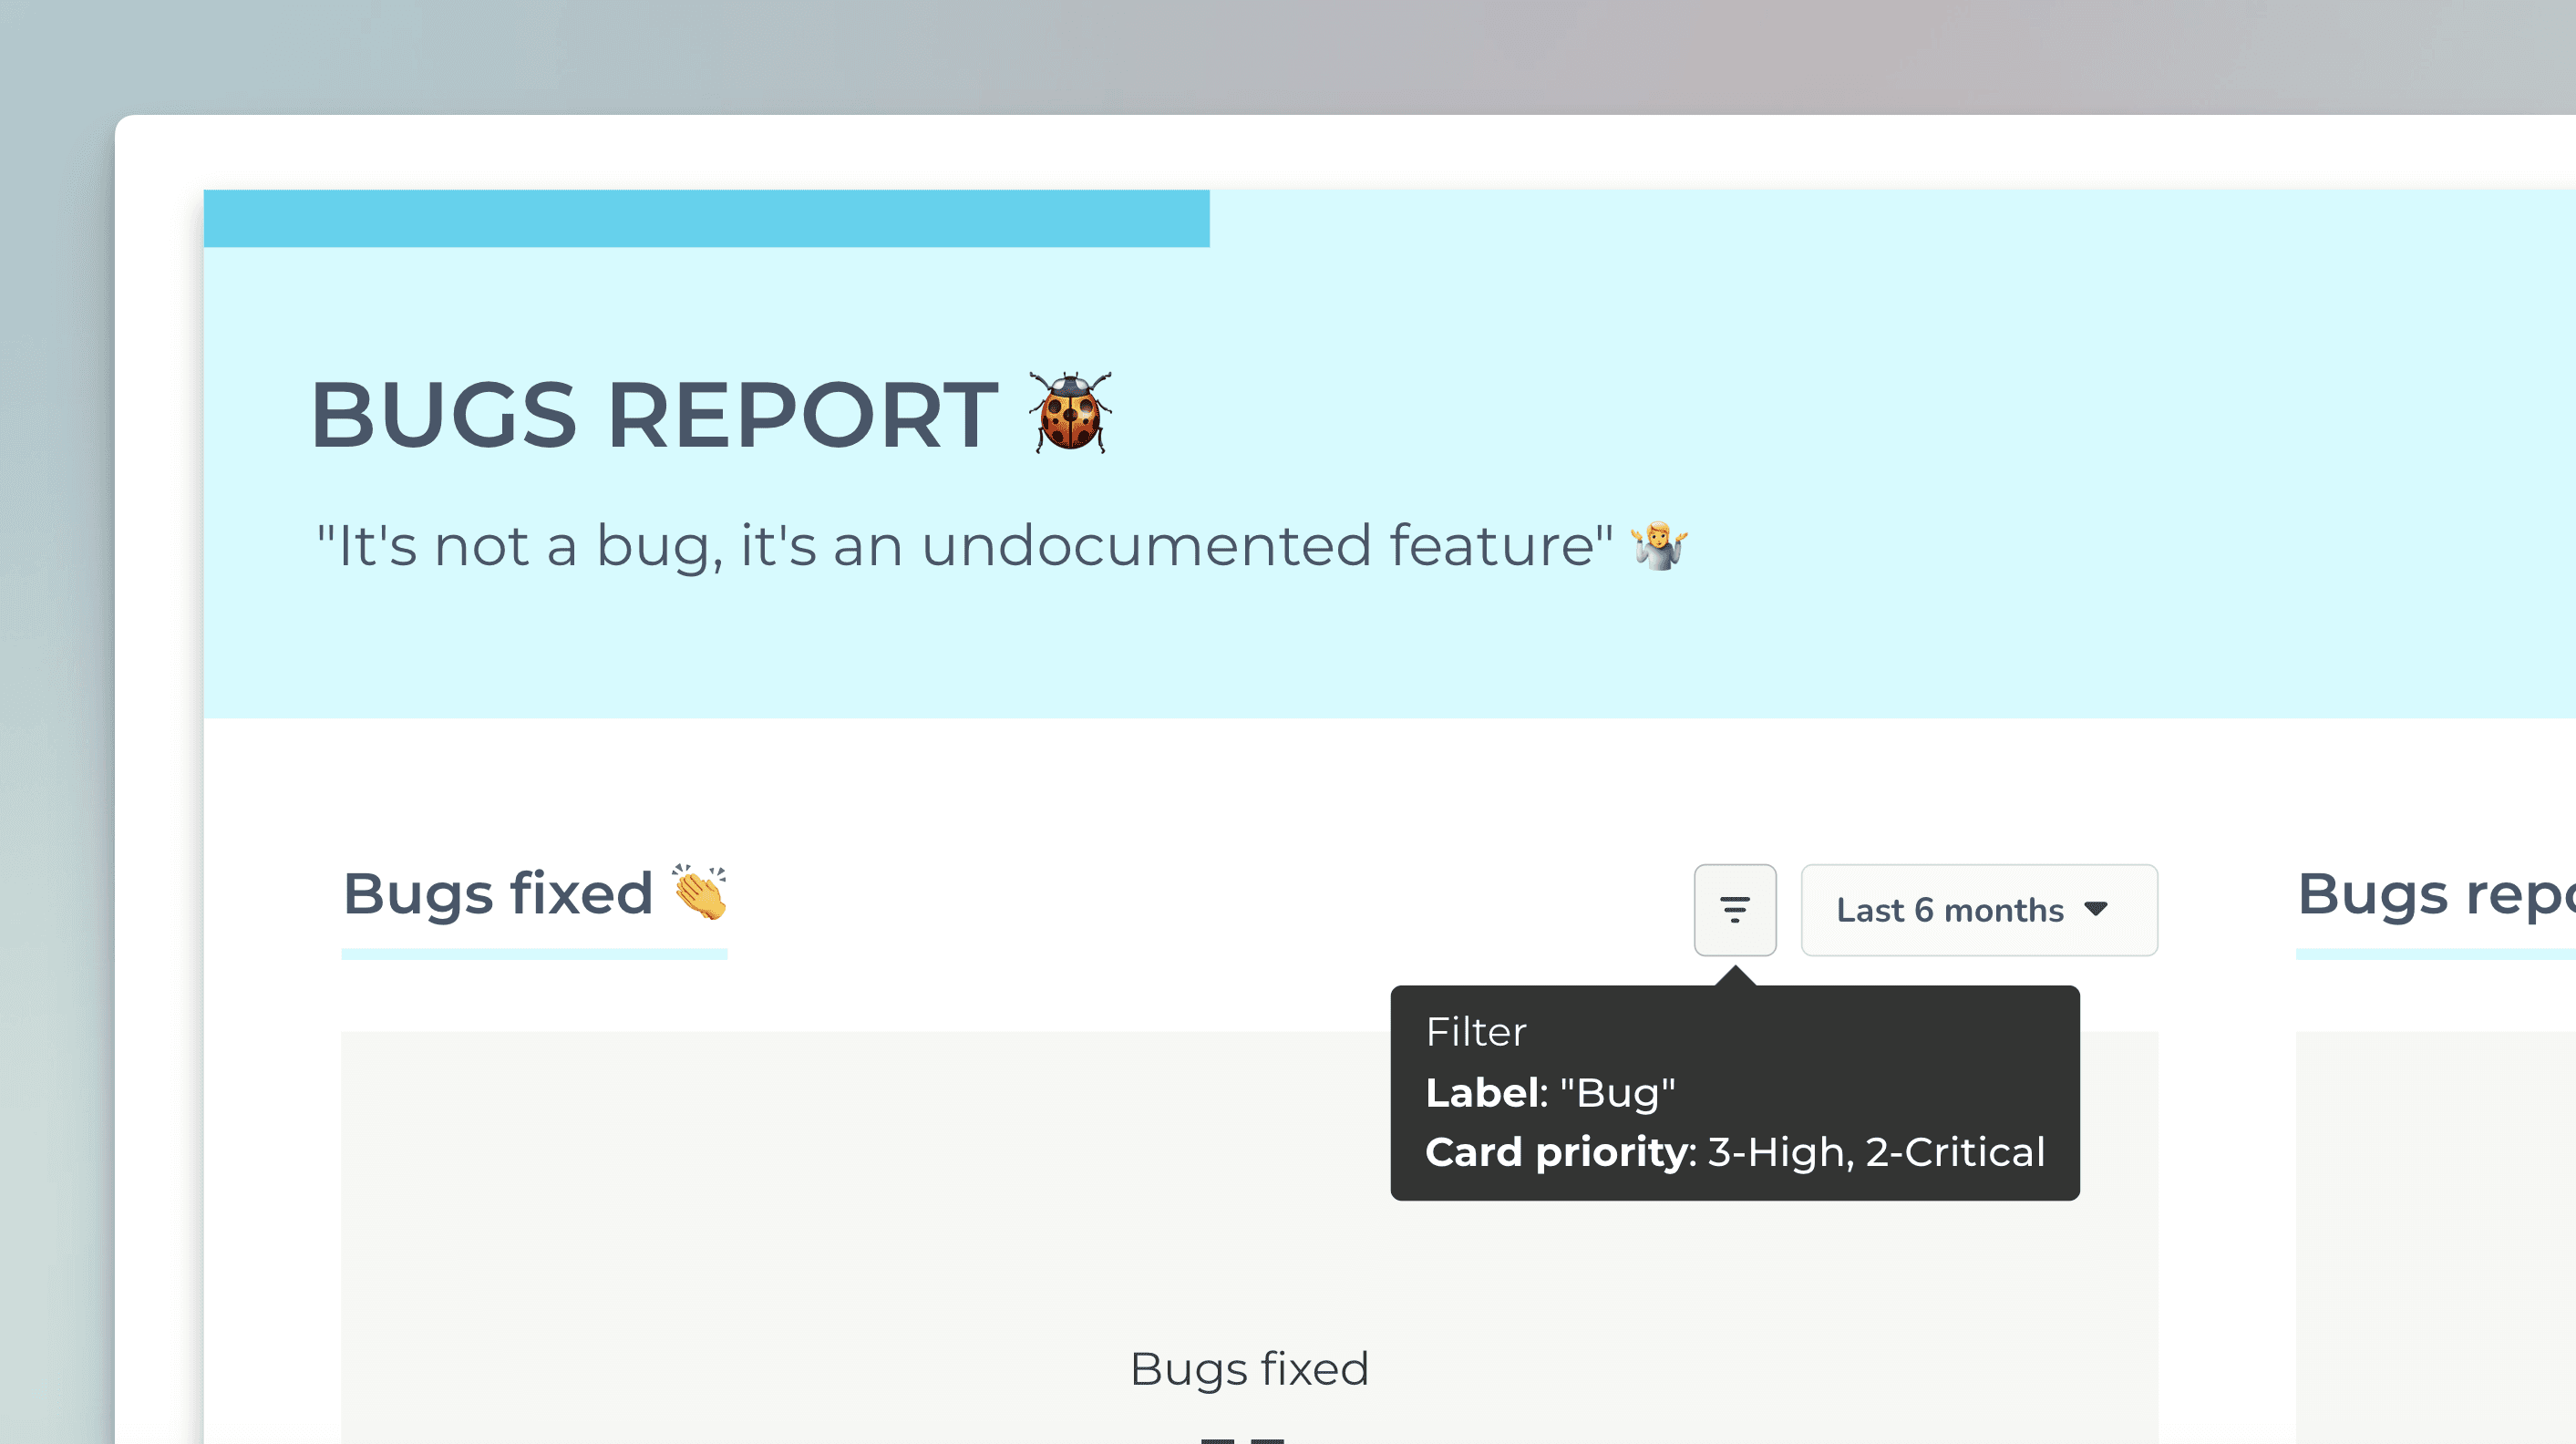
It provides more transparency to the report as the report receiver can easily see what filters are used in the charts.
Bulk actions in data source management
You can now sync, reauthorize, or delete multiple data sources at once. Just go to the Integrations page, and use the checkboxes to select the data sources you want to include:
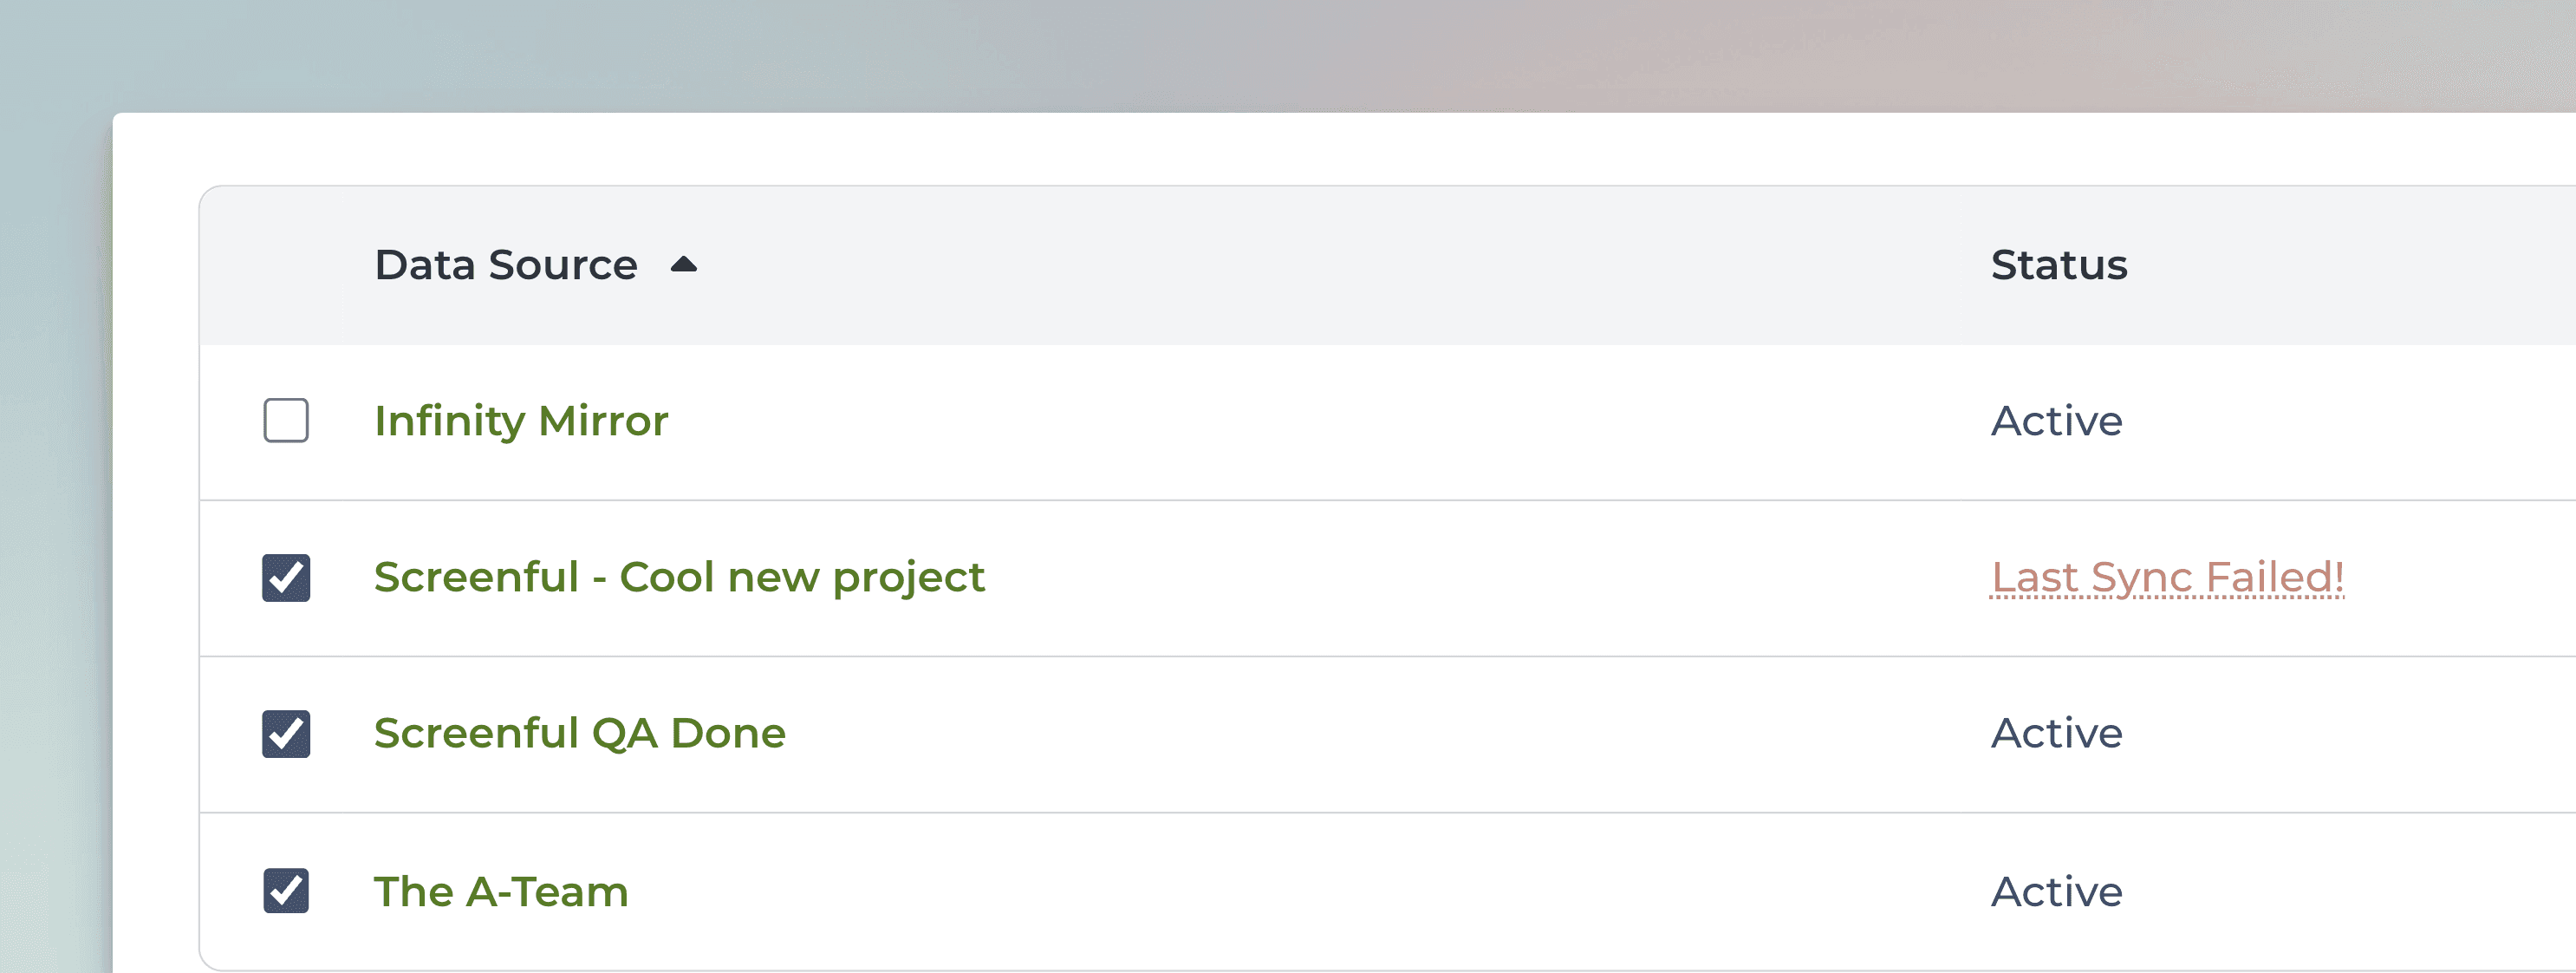
When you select one or more data sources from the list, the button on the top right becomes active:
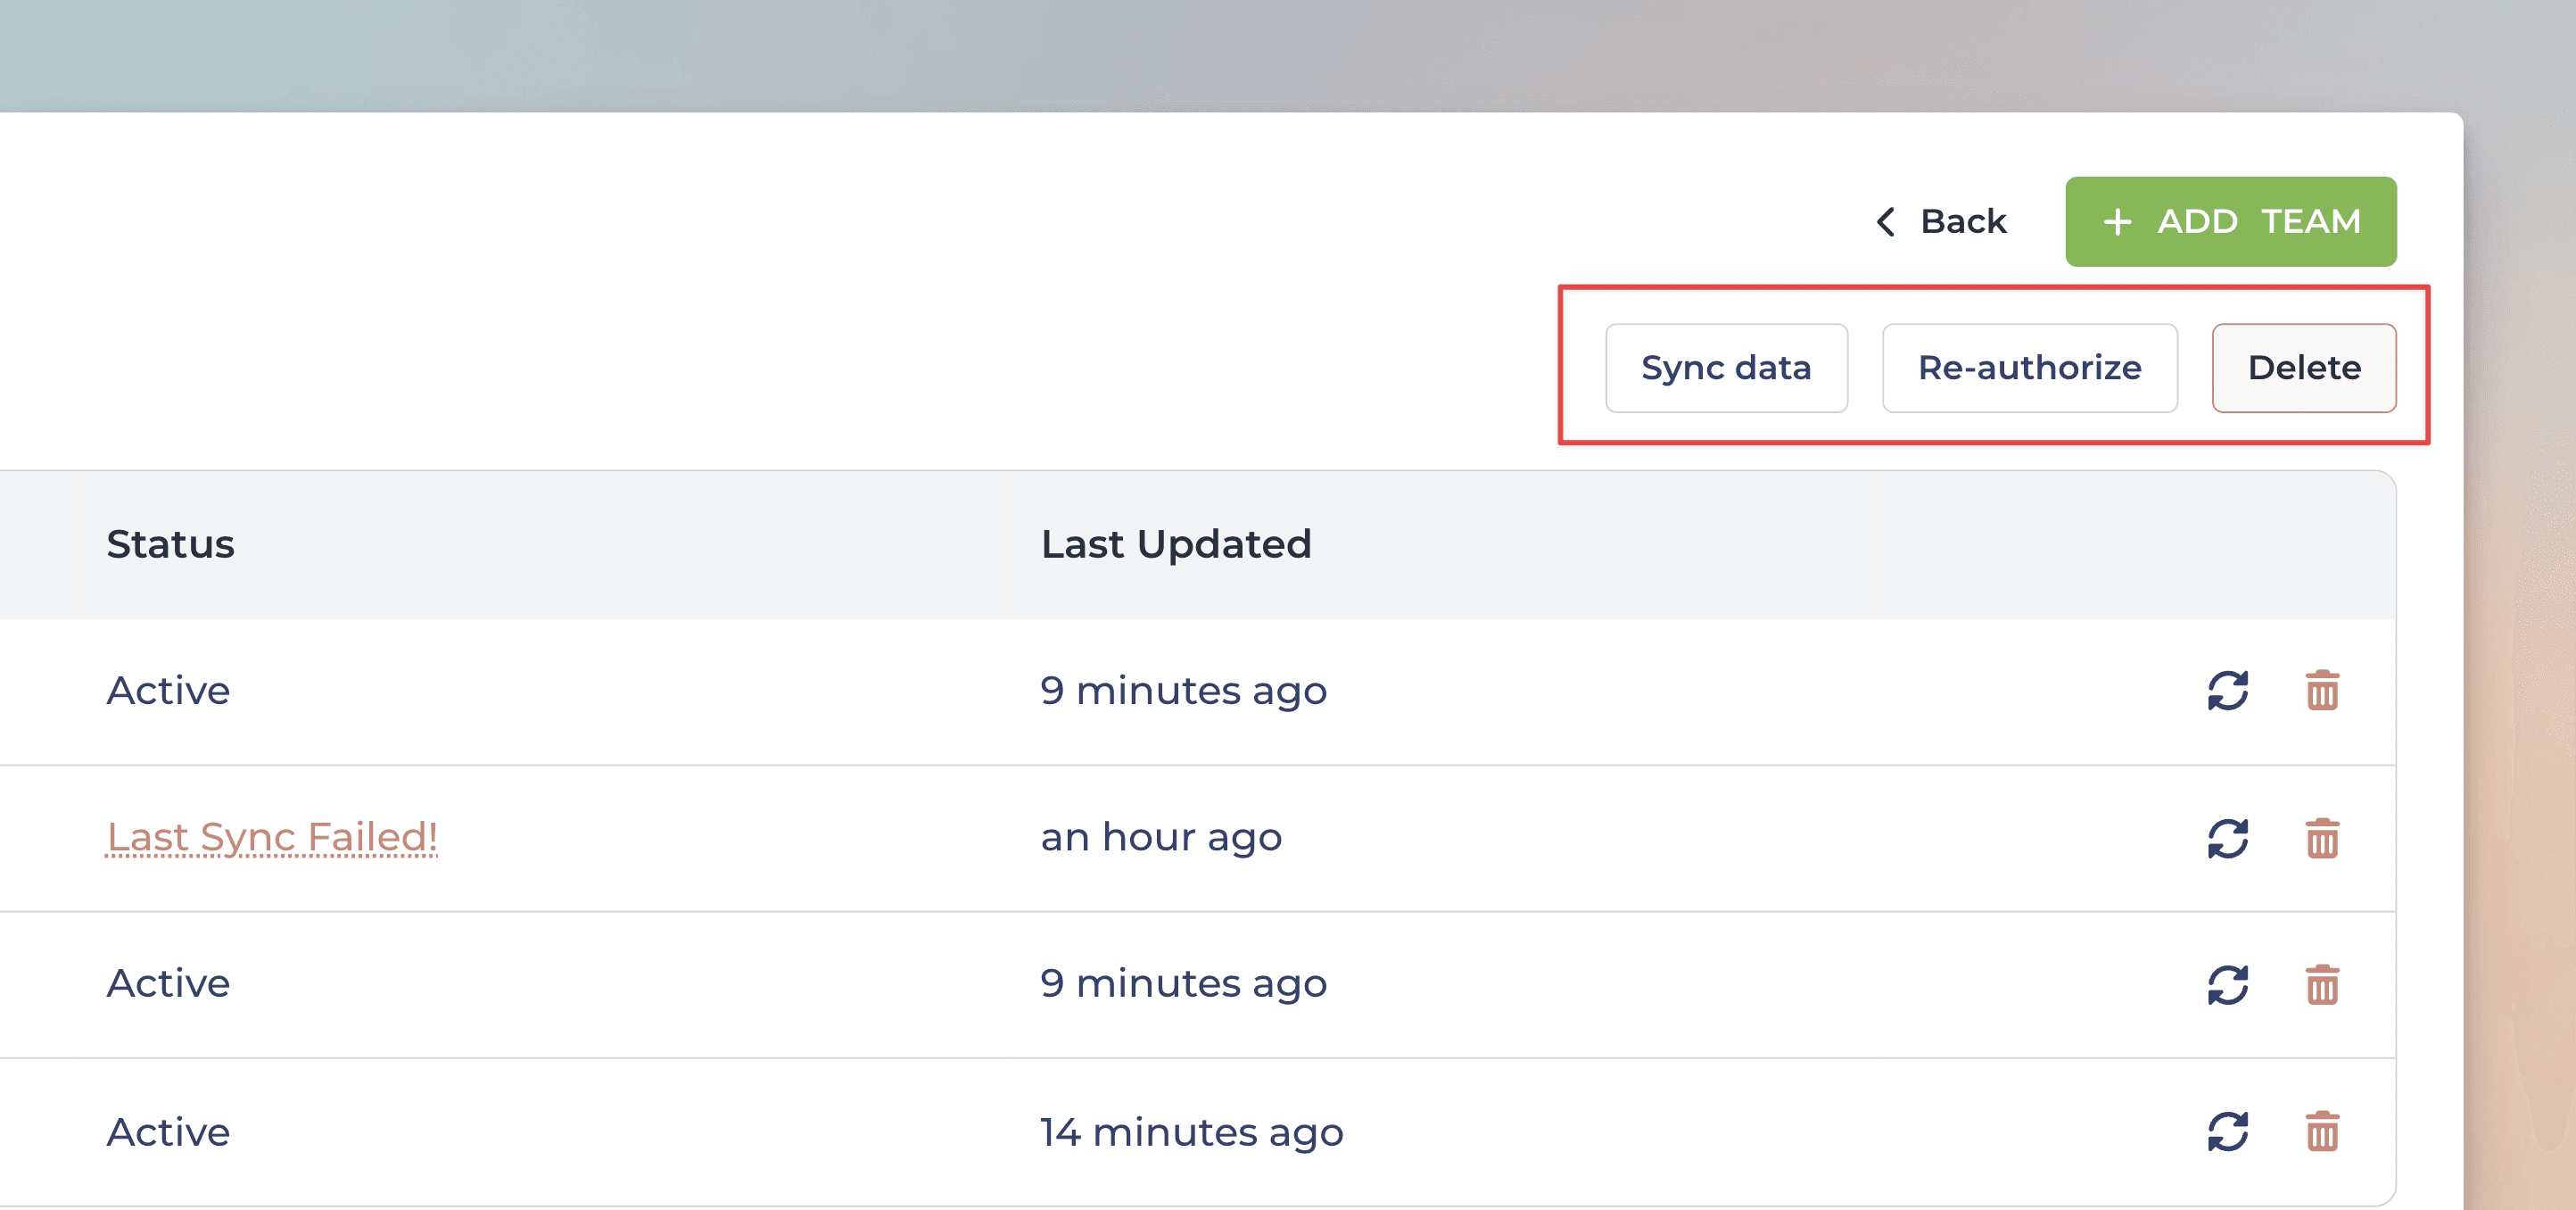
Using bulk actions can save you a lot of time when you need to work with many data sources!
Track agent-assisted work with the new report templates
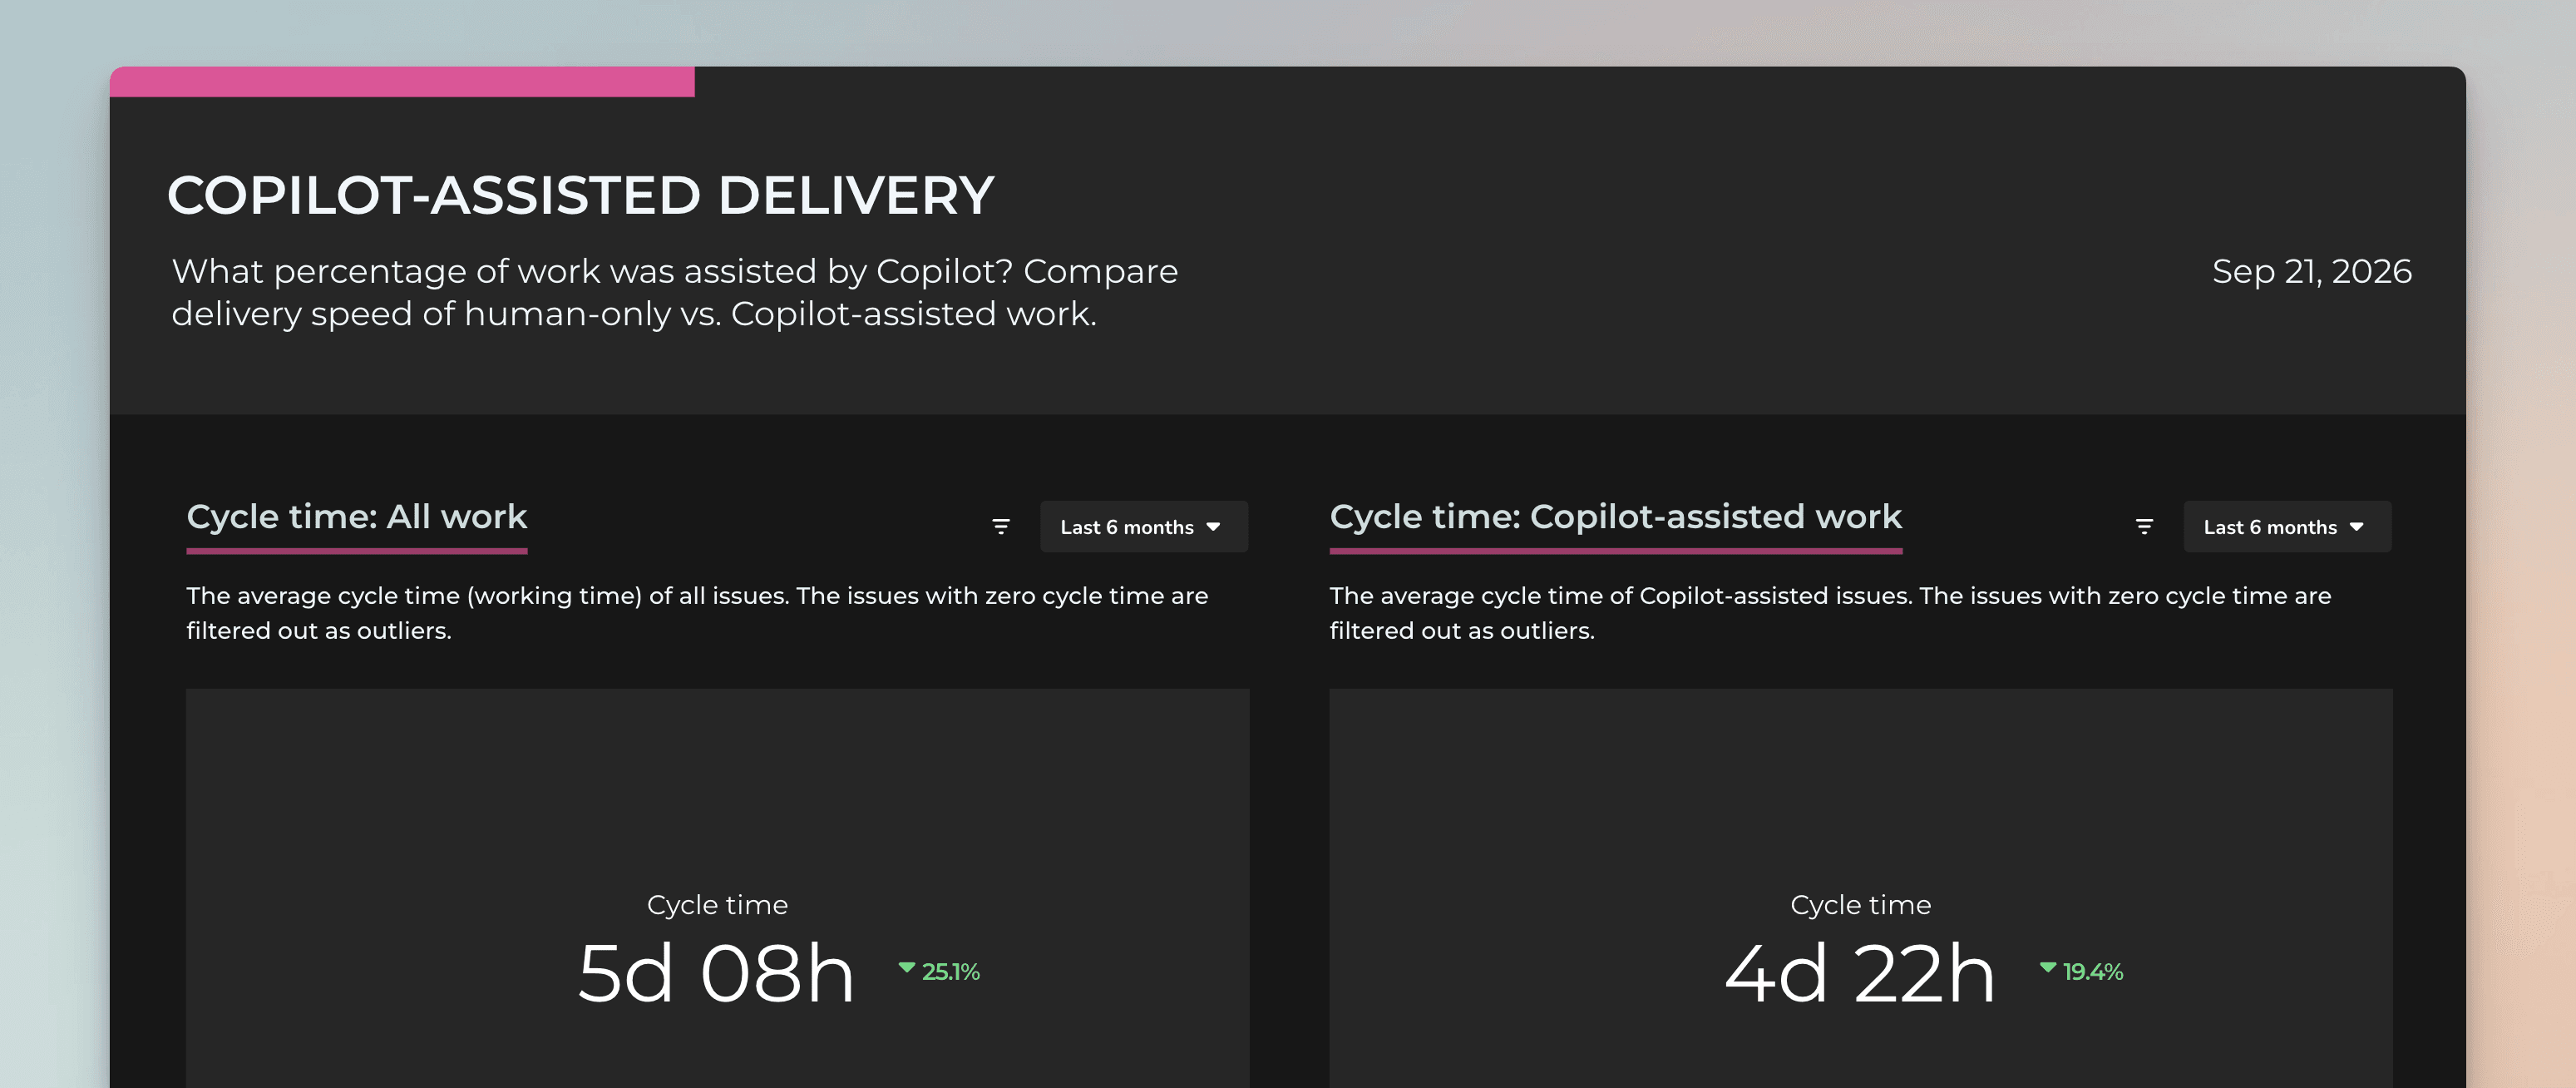
We have introduced two new report templates for GitHub and Linear users to help tracking agent-assisted work. The reports allow comparing the velocity and the cycle times of all tickets vs those assisted by an agent. It helps answering the question everyone's asking now: "are agents improving our productivity?"
If you have a Linear or GitHub Data sources, you find the Copilot-assisted delivery and Agent-assisted delivery in the report templates:
Let us know if you have questions or feedback by contacting hello@screenful.com. To stay on the loop, read our blog, or follow us on LinkedIn.

Screenful MCP server is coming soon
Use your Screenful project data inside your favorite AI tools. Join the waitlist.