Análisis y Informes

Get data-driven insights to deliver projects on time

Crea gráficos e informes, y compártelos por correo electrónico o Slack. Usa el modo de TV para configurar la rotación en una gran pantalla en la oficina.

Integraciones

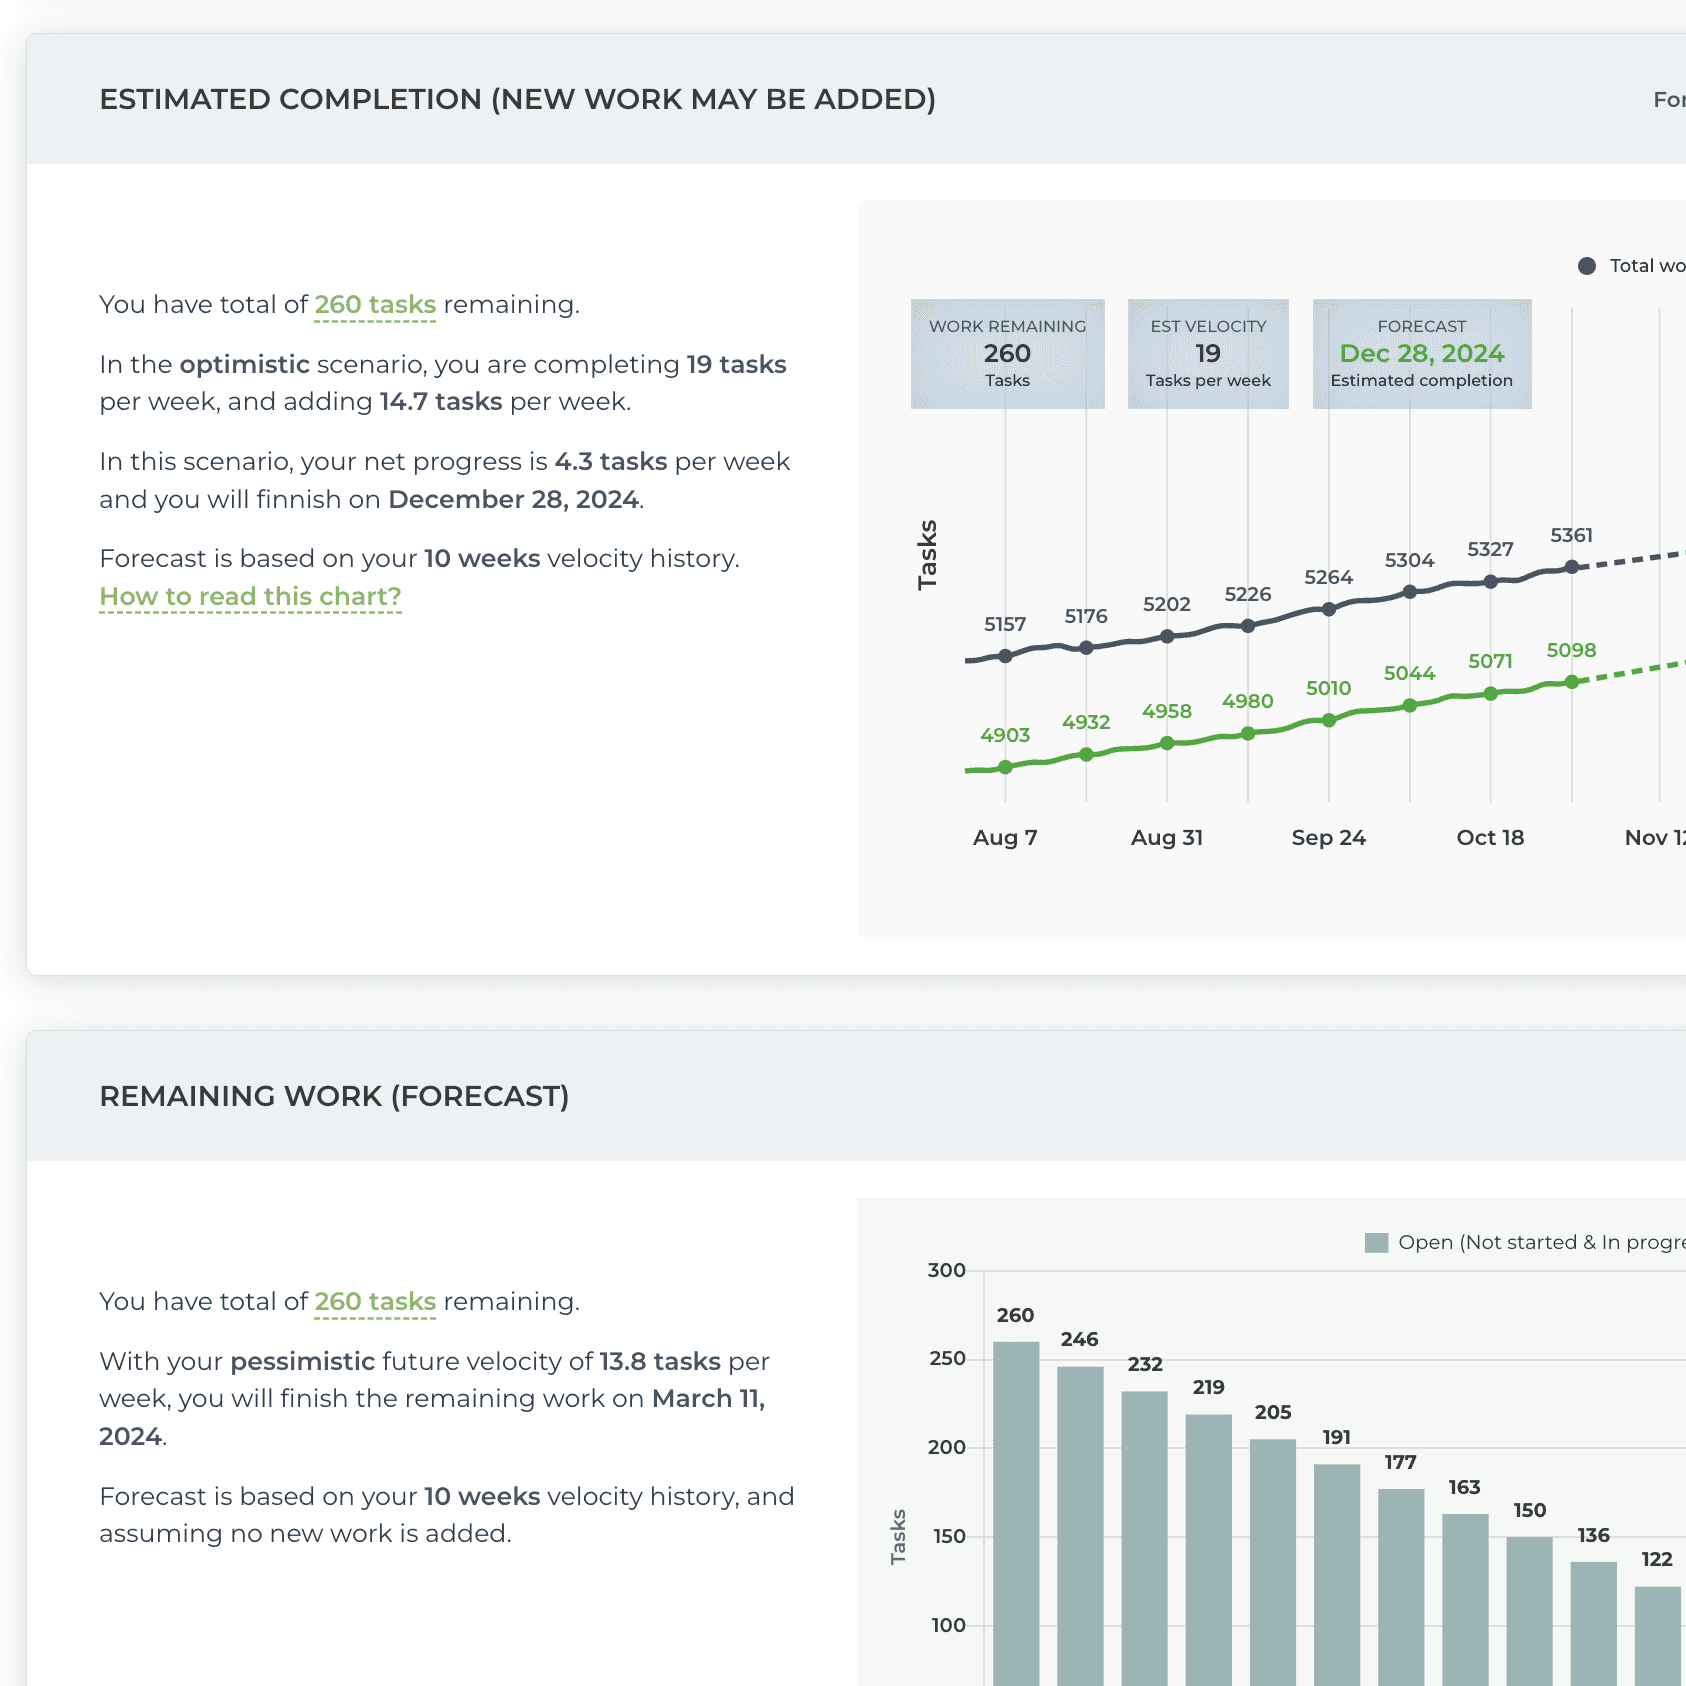
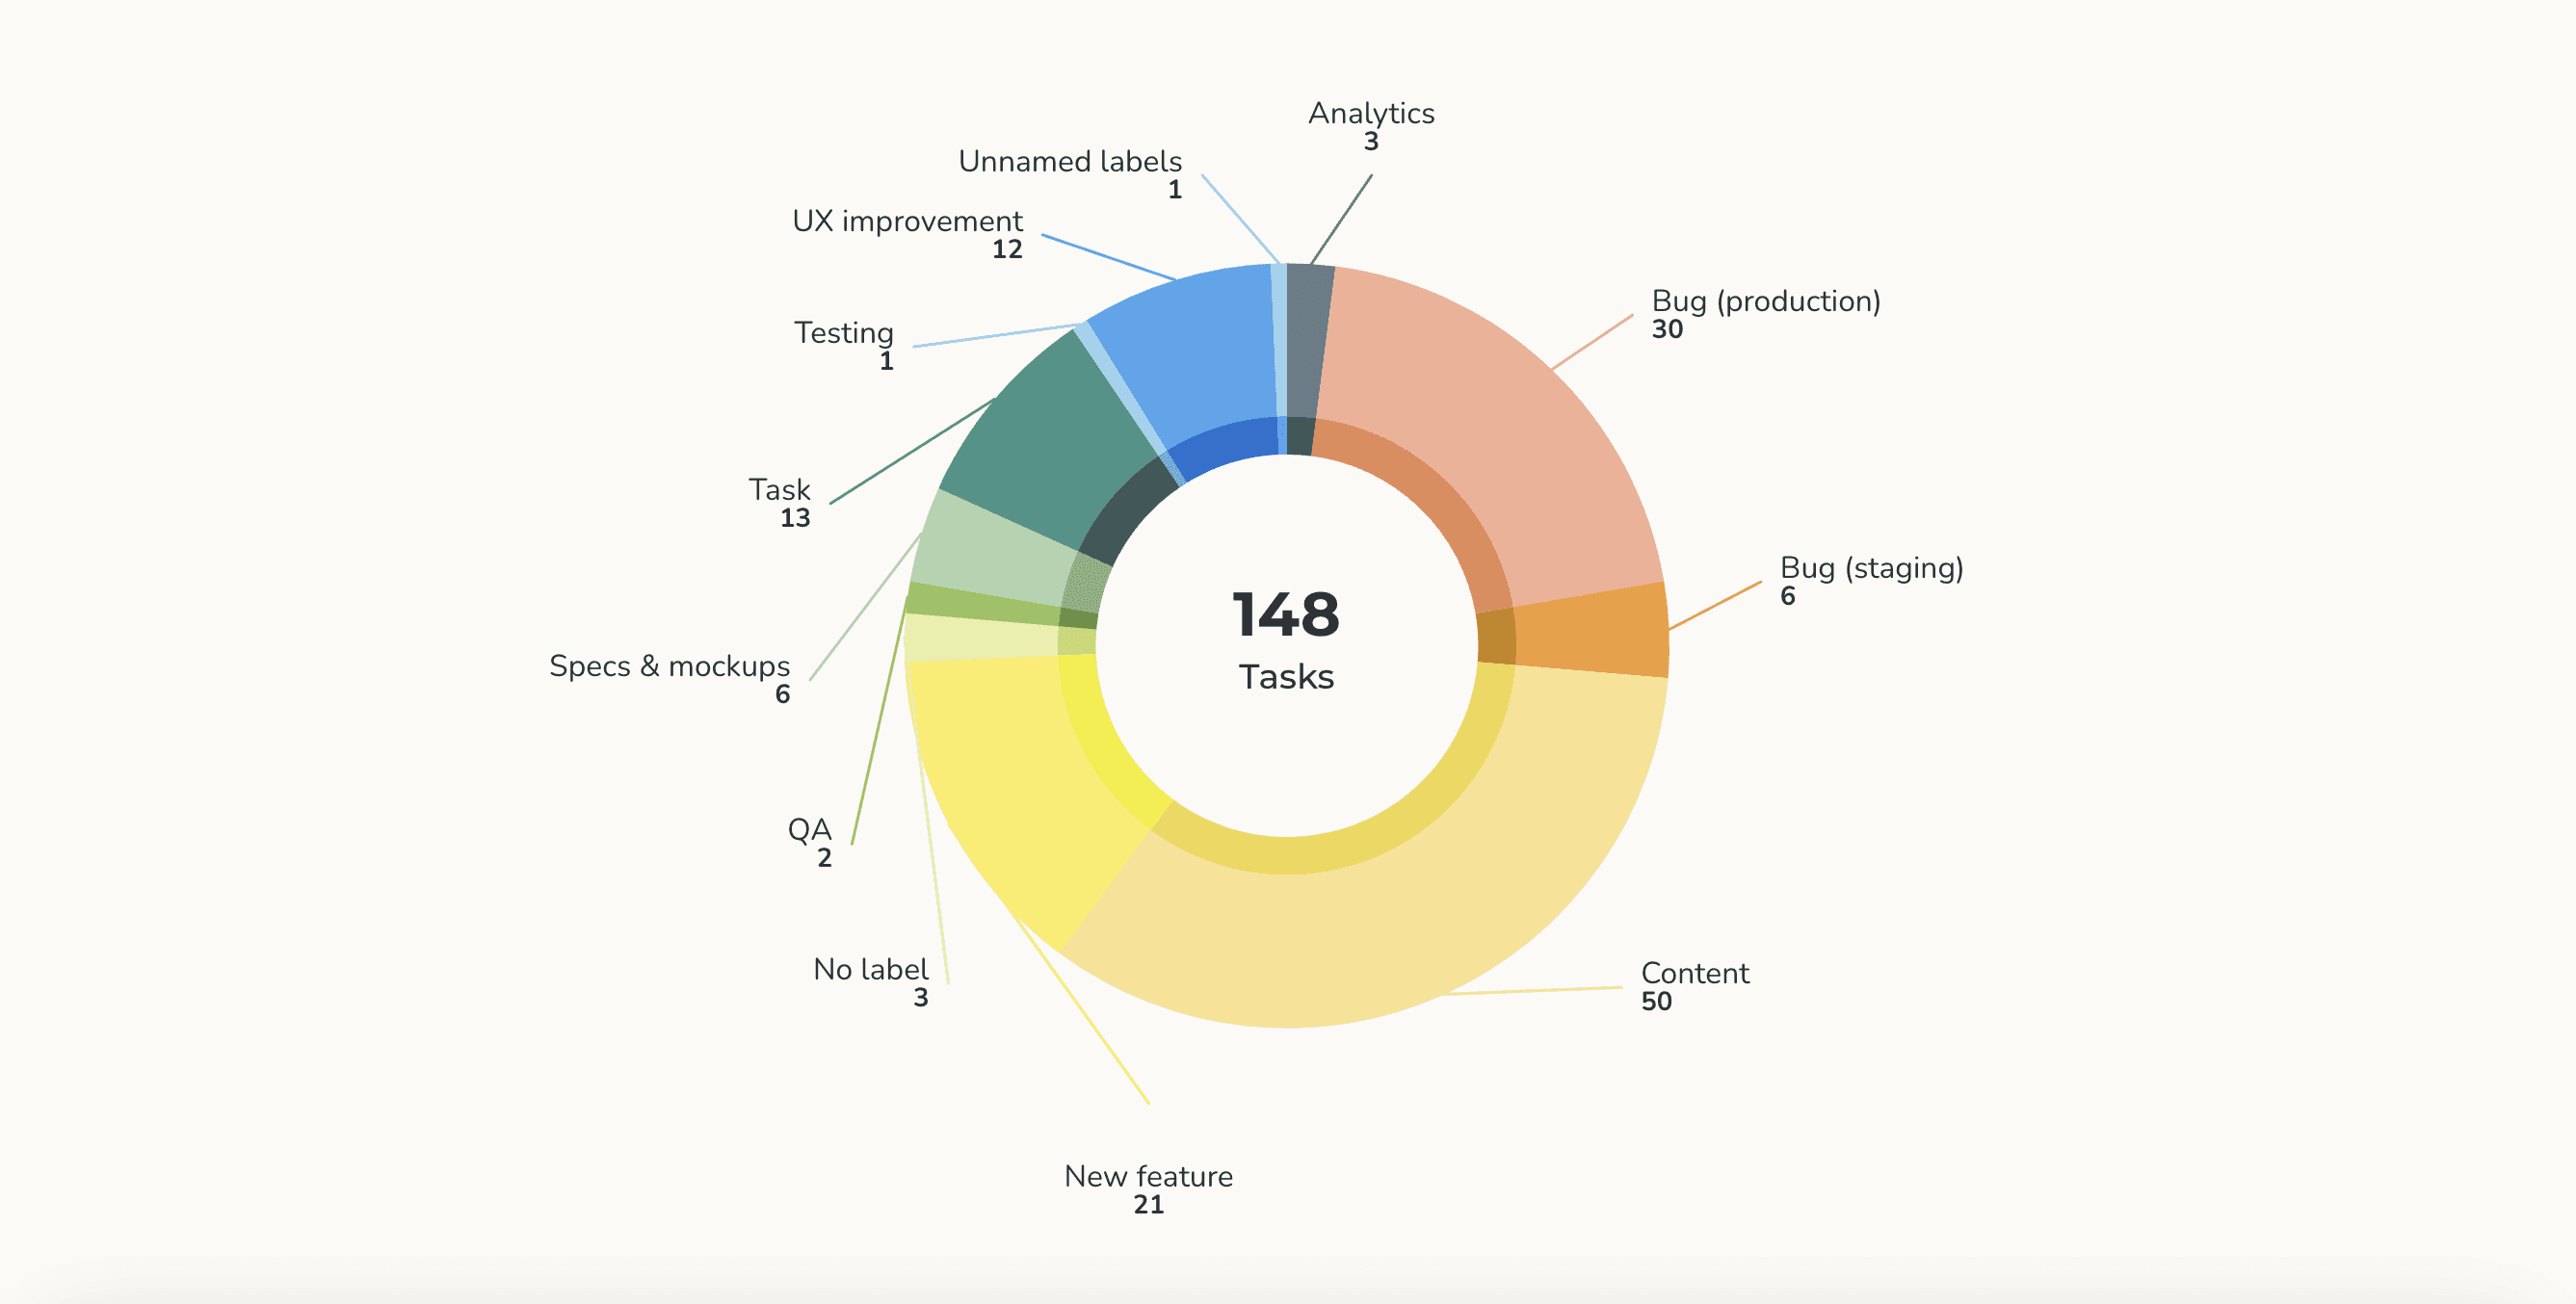
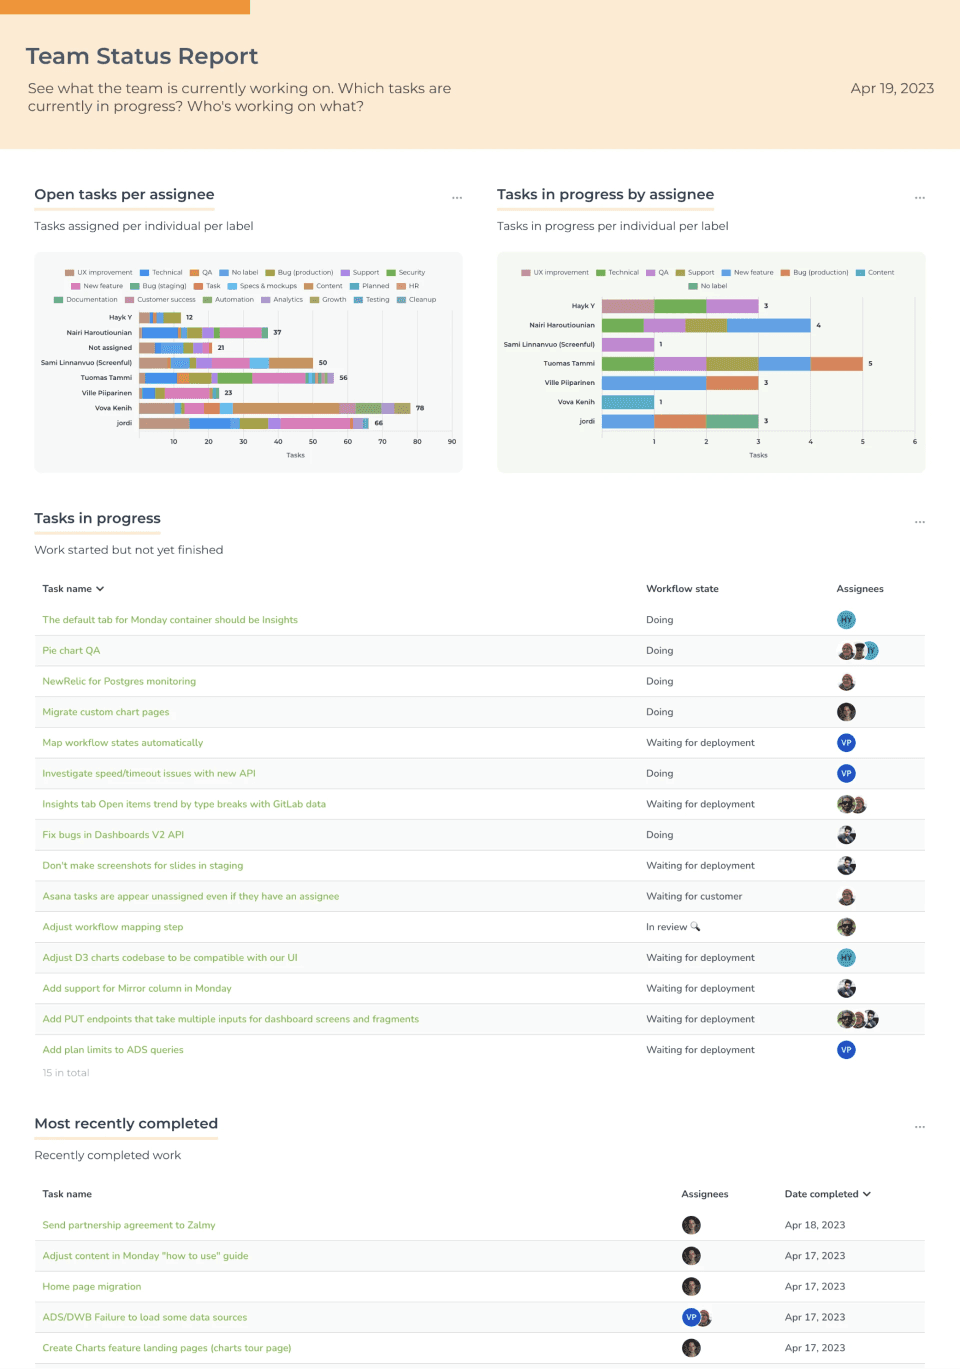
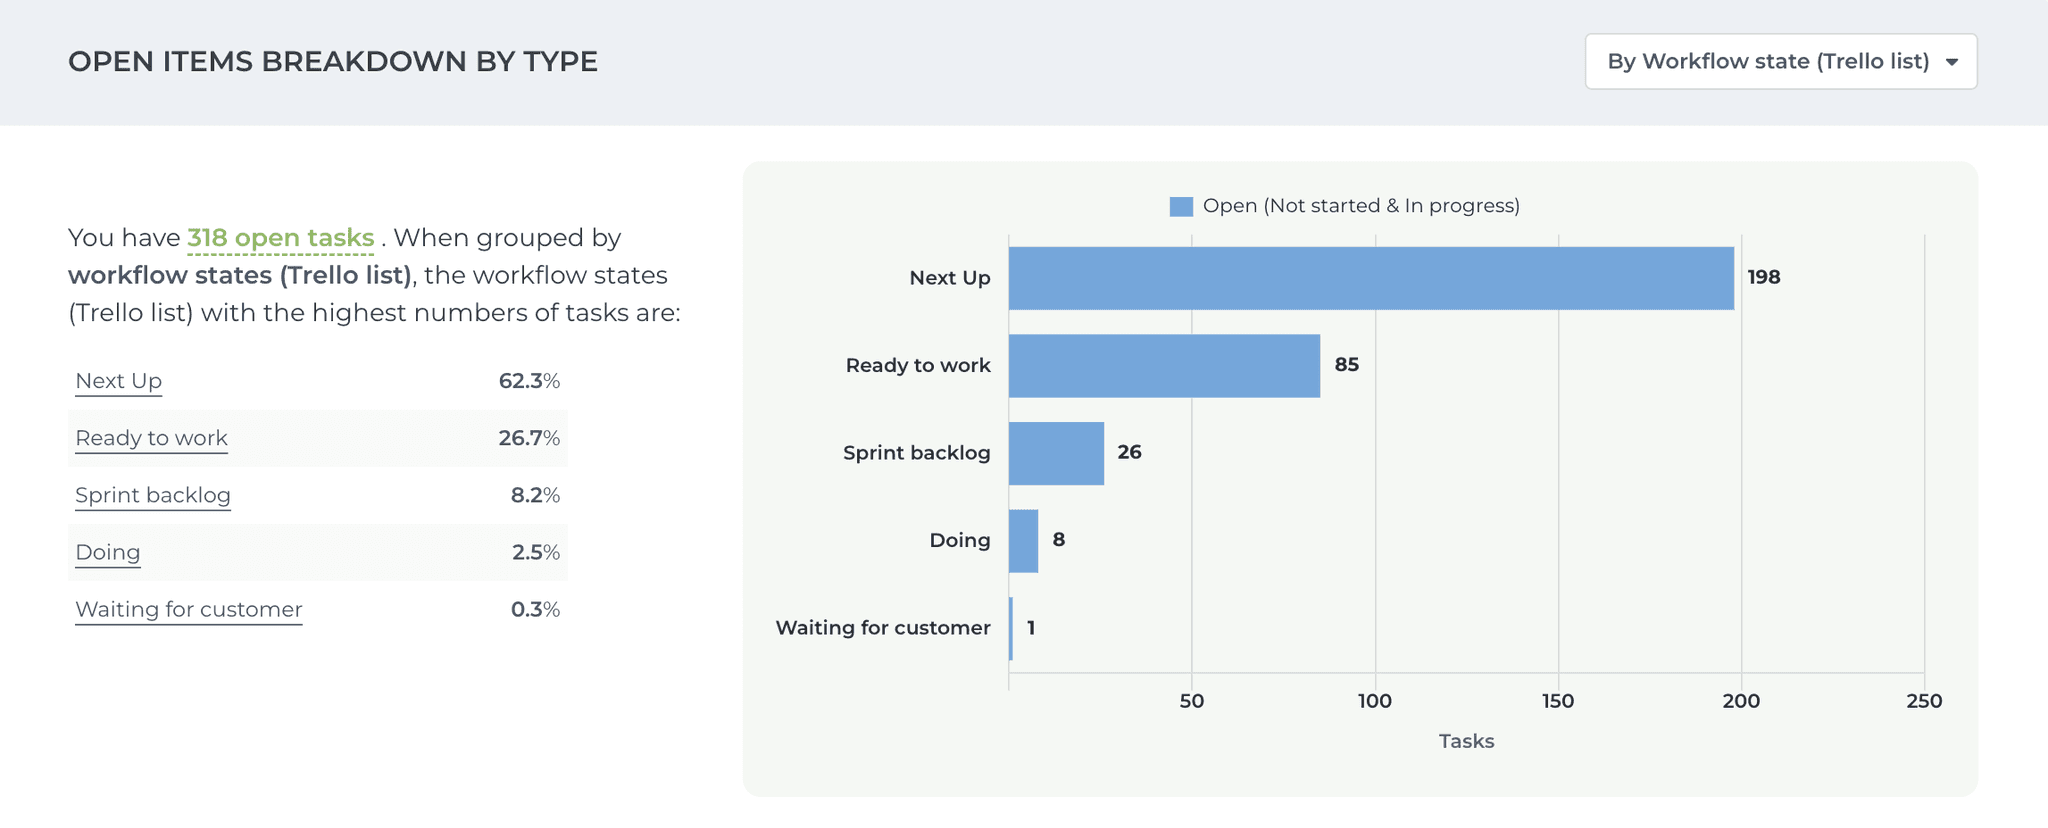
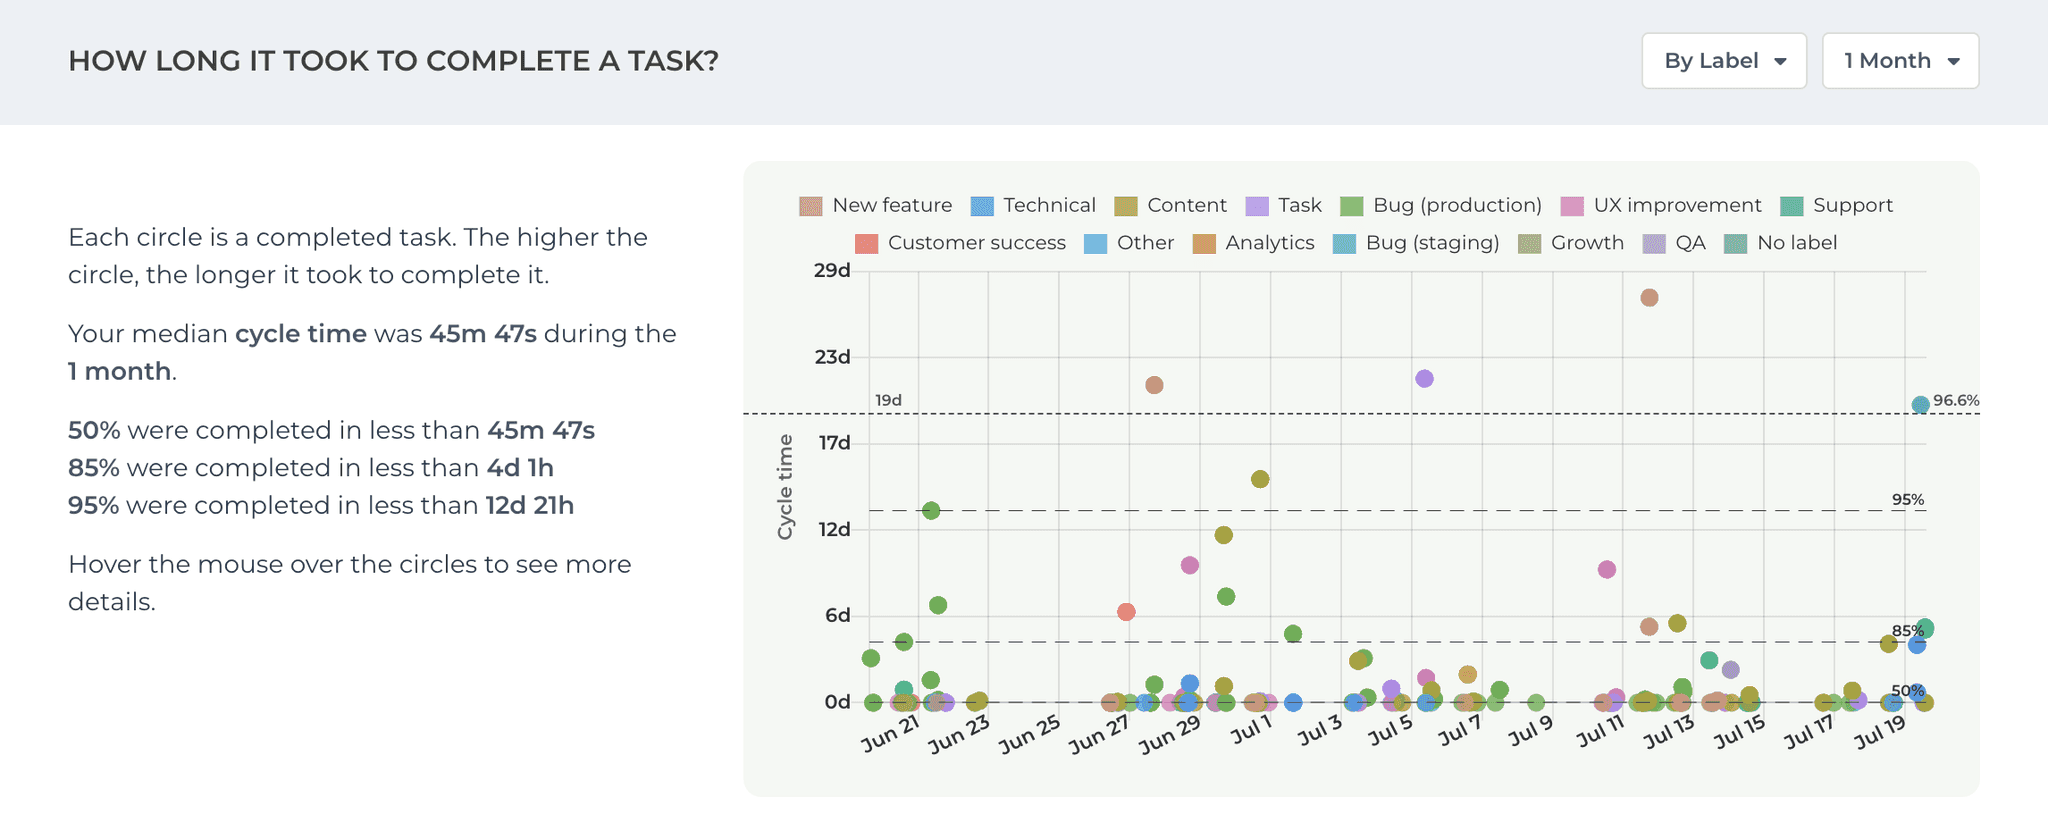
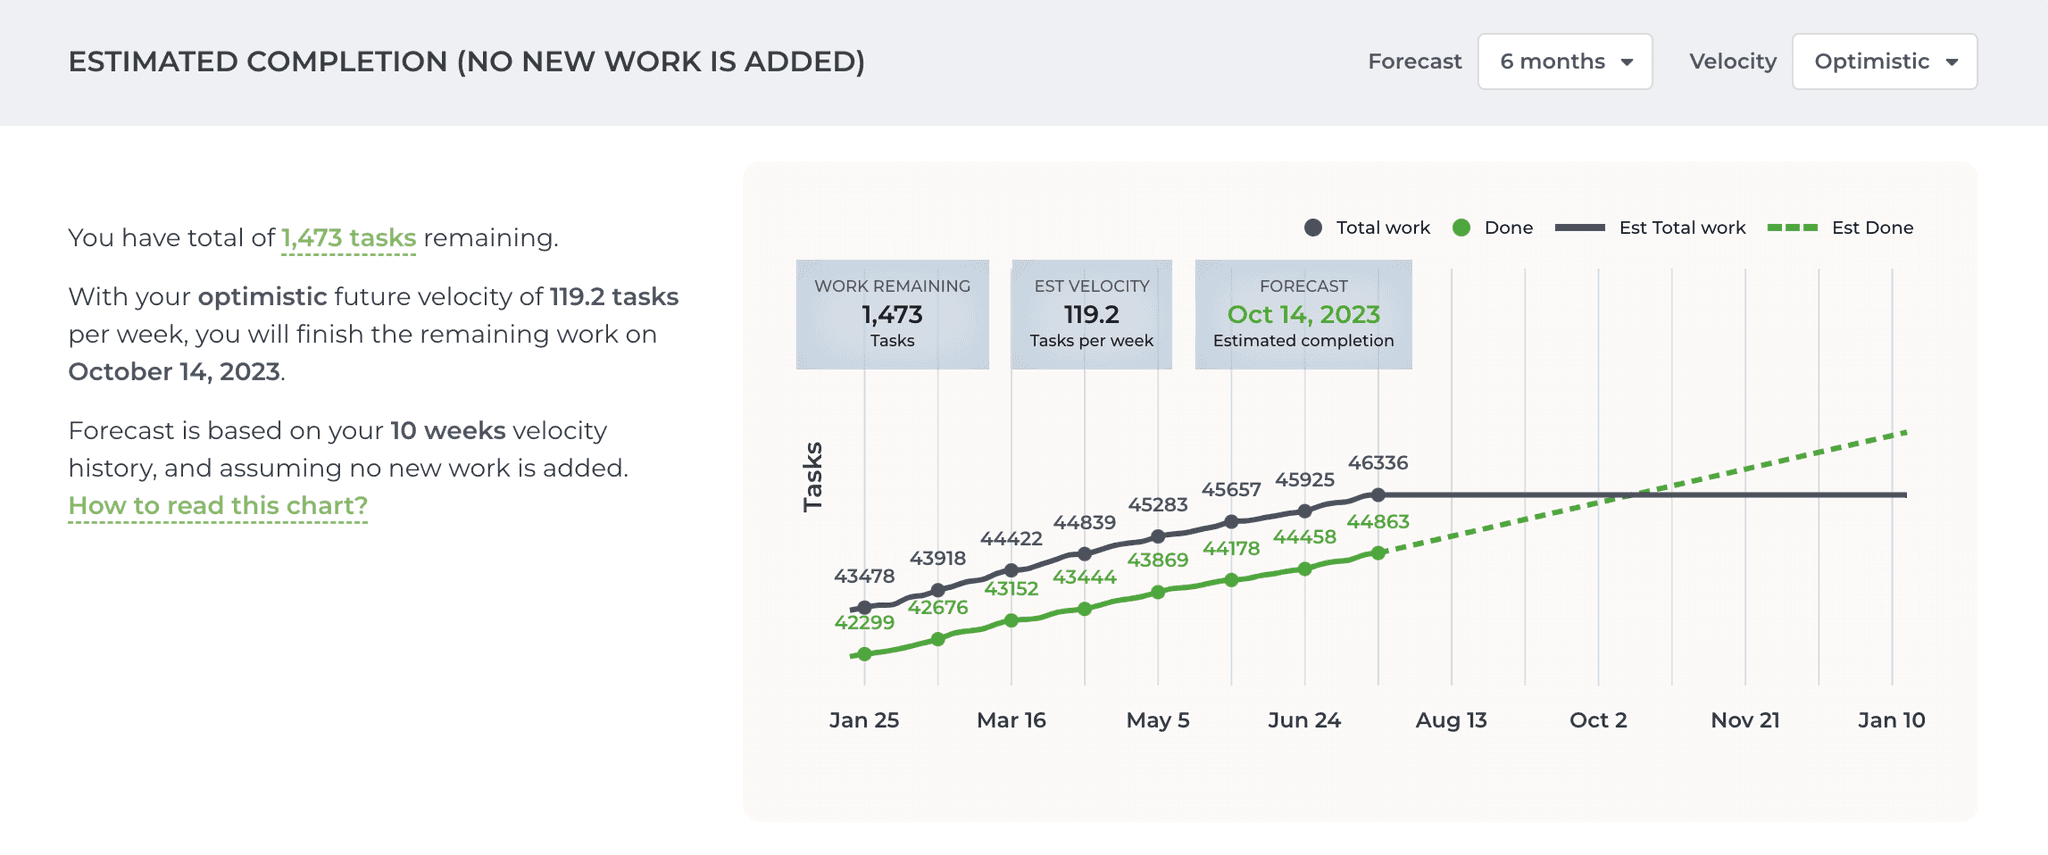
Obtenga información útil a partir de los datos de sus tareas

Capture engineering KPIs

Get the engineering metrics you need - the lead and cycle times, team velocity, work-in-progress, and more. Get data-driven forecasts based on your historical velocity. Instead of guesswork, you can use the data to make your own judgment!

Ejemplo de sitio web

Capture engineering KPIs

Get the engineering metrics you need - the lead and cycle times, team velocity, work-in-progress, and more. Get data-driven forecasts based on your historical velocity. Instead of guesswork, you can use the data to make your own judgment!

Ejemplo de sitio web

Consolidate Your Data into Actionable Insights

Stop constantly switching between platforms. Screenful centralizes all engineering data for complete analysis and reporting.

Ejemplo de sitio web

Consolidate Your Data into Actionable Insights

Stop constantly switching between platforms. Screenful centralizes all engineering data for complete analysis and reporting.

Ejemplo de sitio web

Easily Share Metrics Across the Organization

Distribute reports to showcase engineering progress and blockers with stakeholders. Real-time visibility builds trusted relationships.

Ejemplo de sitio web

Easily Share Metrics Across the Organization

Distribute reports to showcase engineering progress and blockers with stakeholders. Real-time visibility builds trusted relationships.

Ejemplo de sitio web

Keep Engineering Teams Informed

Share reports to keep teams updated on productivity goals and performance. Add context to guide teams and align everyone.

Ejemplo de sitio web

Keep Engineering Teams Informed

Share reports to keep teams updated on productivity goals and performance. Add context to guide teams and align everyone.

Ejemplo de sitio web

Schedule and Share Reports with Ease

Deliver monthly, weekly or even daily updates without any extra effort. Screenful lets you schedule report distribution on any cadence directly to stakeholders. Say goodbye to scrambling to pull presentations together. Automated reporting makes it easy to share progress consistently.

Ejemplo de sitio web

Apreciado por líderes de la industria

  • Screenful was best in every category. It beautifully and simply highlights key agile metrics for our whole in-office team and any visiting stakeholders.

    Jason Walter

    Agile coach, writer, trainer

    I love Screenful for its user-friendly interface and seamless integration to multiple data sources. The customer service is outstanding; they provided exceptional support whenever we needed it!

    Jason Walter

    Project Coordinator at Fashion Snoops

    Outright best reporting tool. We have tried many different ones over the past 2 years, and none of them beats Screenful. The ability to build custom reports provides amazing capabilities for agile teams.

    Jason Walter

    Director of Engineering at Singular

    Using visual boards without metrics misses the whole point of improving performance. Screenful is a must have tool for our Kanban.

    Jason Walter

    CEO & Co-founder at Keyo Inc.

    We've been using Screenful for 13 months now and we can't say enough good things about it. The insight we have is invaluable to us and has helped us keep the delivery capacity at a steady temperature.

    Jason Walter

    CTO & Co-founder at Stackeo

    Screenful is a wonderful visualization tool that I use to illustrate to organizations why they should relentlessly focus on reducing lead time & cycle time, understand cumulative flow and decompose work.

    Jason Walter

    Enterprise Agility Consultant

    Accenture is working with Screenful to roll out best practice agile metrics in minutes - allowing our world class delivery teams to be led by data.

    Jason Walter

    Business & Technology Innovation Senior Principle, Accenture UK

    Screenful allows me to easily identify where I am spending time so that I can ensure I'm working on the right things. The weekly email is a great summary delivered right to my phone

    Jason Walter

    Agile coach

confiado por las empresas más innovadoras del mundo

confiado por las empresas más innovadoras del mundo

confiado por las empresas más innovadoras del mundo

Informes de proyectos automatizados fáciles para todos

La herramienta galardonada de visualización de datos que satisface las necesidades de todas las partes interesadas

¿Cómo podríamos entregar más manteniendo la calidad elevada?

¿Cuáles son las tareas de mayor prioridad en las que debería enfocarme a continuación?

¿Cuál es el estado de nuestro proyecto - se entregará a tiempo?

Líder de equipo

Negocios

Desarrollador

Ventas

Cliente

¿Cuáles son los canales de venta que generan más ingresos para nosotros?

¿Hay alguna tendencia en nuestro pipeline de ofertas de la que deba ser consciente?

"Really good looking views and easy setup. Ideal for providing open visibility for the progress across the company."

FAQ

Preguntas comunes

Will Screenful make changes to my data, or is my data affected in any way?

We do not make changes to your data. We only read it via the API of your tool. Screenful is only for reporting and analytics. It does not update any data within your tools.

We do not make changes to your data. We only read it via the API of your tool. Screenful is only for reporting and analytics. It does not update any data within your tools.

Are weekends included in the cycle time calculation?

By default yes, but you can specify your working hours and days in the Account Settings.

By default yes, but you can specify your working hours and days in the Account Settings.

Can I filter charts based on epic, version, sprint etc.

Yes, you can learn more by reading the filtering guide.

Yes, you can learn more by reading the filtering guide.

How do I adjust the contents of the charts?

You can choose what data is included by setting a filter, and you can adjust the appearance of a chart in the chart settings.

You can choose what data is included by setting a filter, and you can adjust the appearance of a chart in the chart settings.

Is there a way to remove outliers from the data?

If you want to exclude individual items from the metrics, you can do it by following the steps below

  1. Set a specific label or tag (e.g. "excluded") to the item you want to exclude (task, issue, user story etc.)

  2. Go to Screenful and reset the data source in the Data sync options

  3. Go to the chart in question and set a filter (e.g. label is none of 'excluded')

If the item is already archived, you have to unarchive it first. Then apply the steps 1-2. After that, you can archive it again.

Does this support my specific workflow or do I have to use some specific states like "open", "in progress" and "done"?

You are not limited to any specific set of states or a workflow. You can configure your own workflow, if such exists, and you can use that in your reporting. It's also ok if you don't have any workflow in your boards, as can create reports based on any other criteria by setting a filter.

You are not limited to any specific set of states or a workflow. You can configure your own workflow, if such exists, and you can use that in your reporting. It's also ok if you don't have any workflow in your boards, as can create reports based on any other criteria by setting a filter.

How often is data updated?

All data sources are synced automatically once per hour. Changing settings or configuration will trigger additional sync so your data is at most one hour old. You can sync data manually at any time in the sync settings.

All data sources are synced automatically once per hour. Changing settings or configuration will trigger additional sync so your data is at most one hour old. You can sync data manually at any time in the sync settings.

Can I embed these charts into my intranet?

You can embed any custom chart or report to any web page using the embed code. Learn more about the sharing feature from the online guide

You can embed any custom chart or report to any web page using the embed code. Learn more about the sharing feature from the online guide

I can’t find an answer to my question

The Getting Started Guide contains Instructions for setting up Screenful.

See also our Accounts & Pricing FAQ.

Check out our how-to and public roadmap or get in touch by emailing to support@screenful.com

The Getting Started Guide contains Instructions for setting up Screenful.

See also our Accounts & Pricing FAQ.

Check out our how-to and public roadmap or get in touch by emailing to support@screenful.com