Get automated productivity insights from your Trello data and share them with ease
Visualize your data like never before


Available as Trello Power-Up
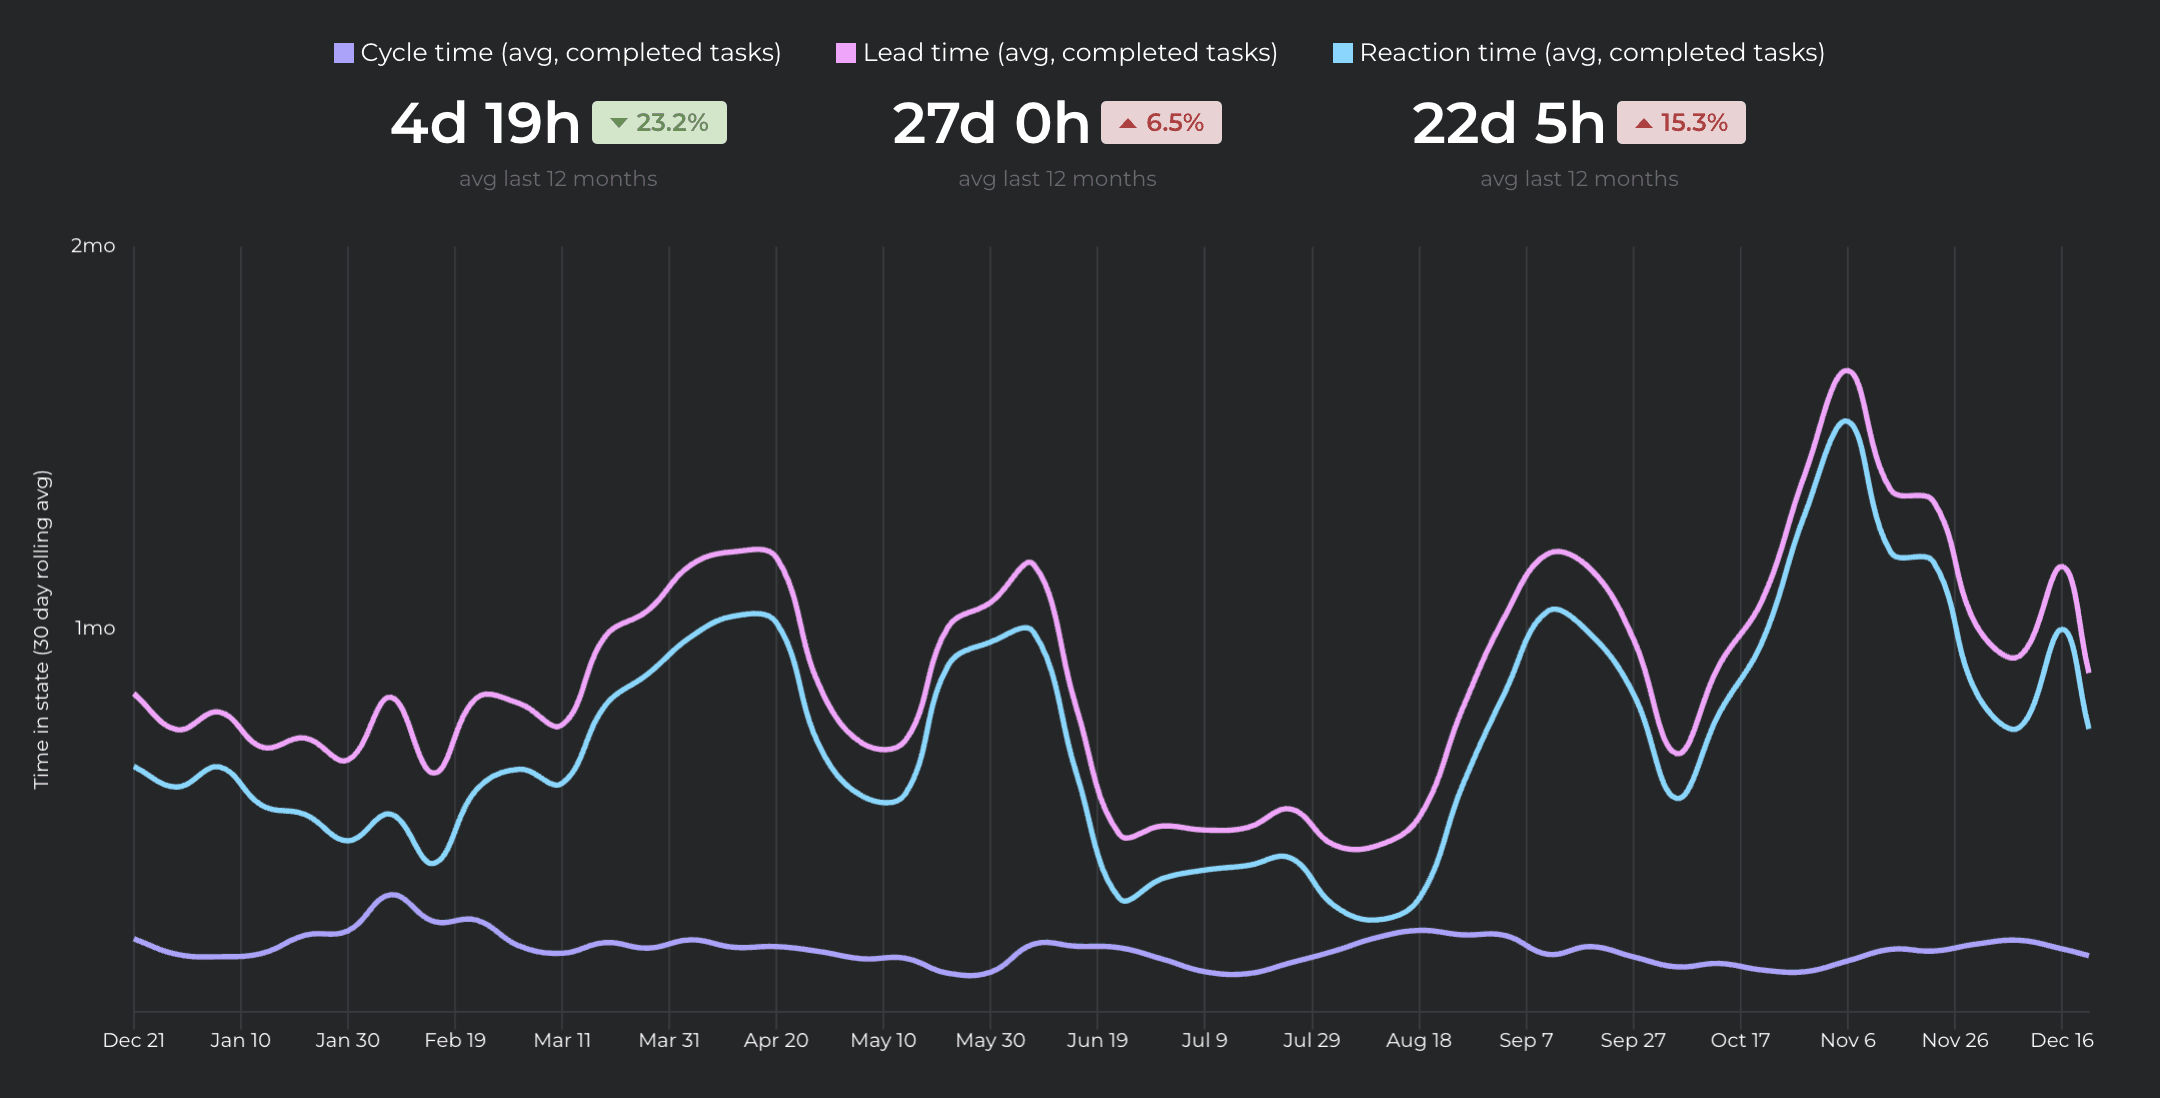
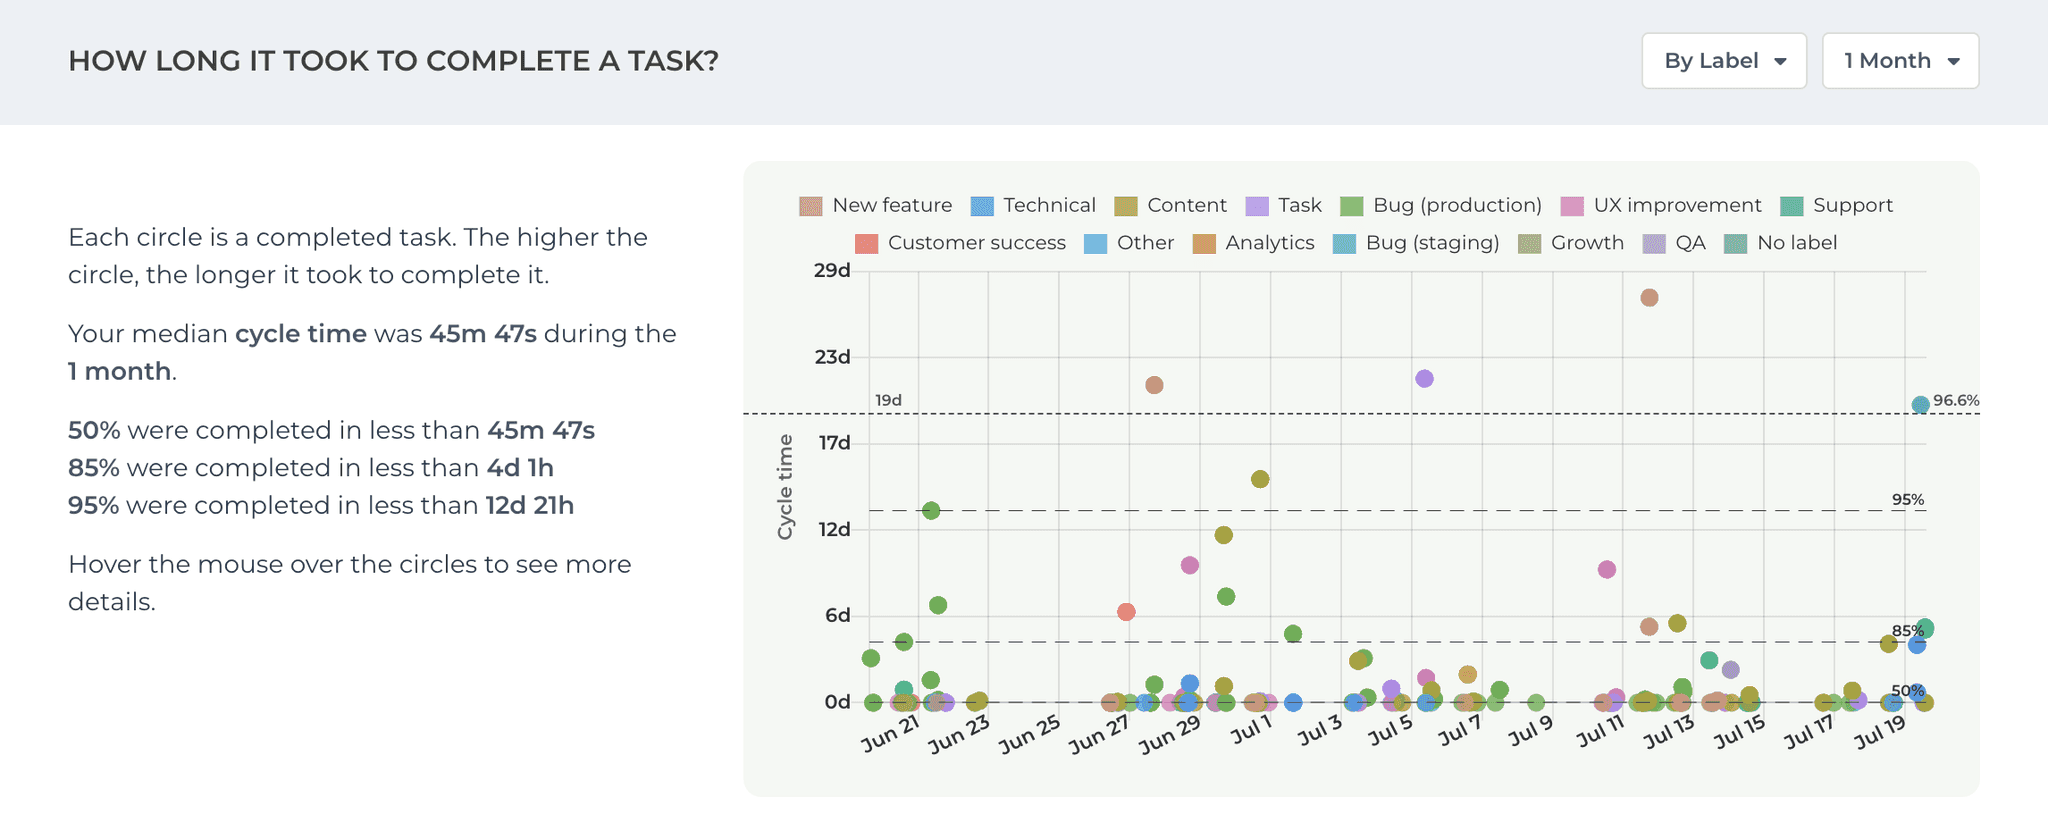
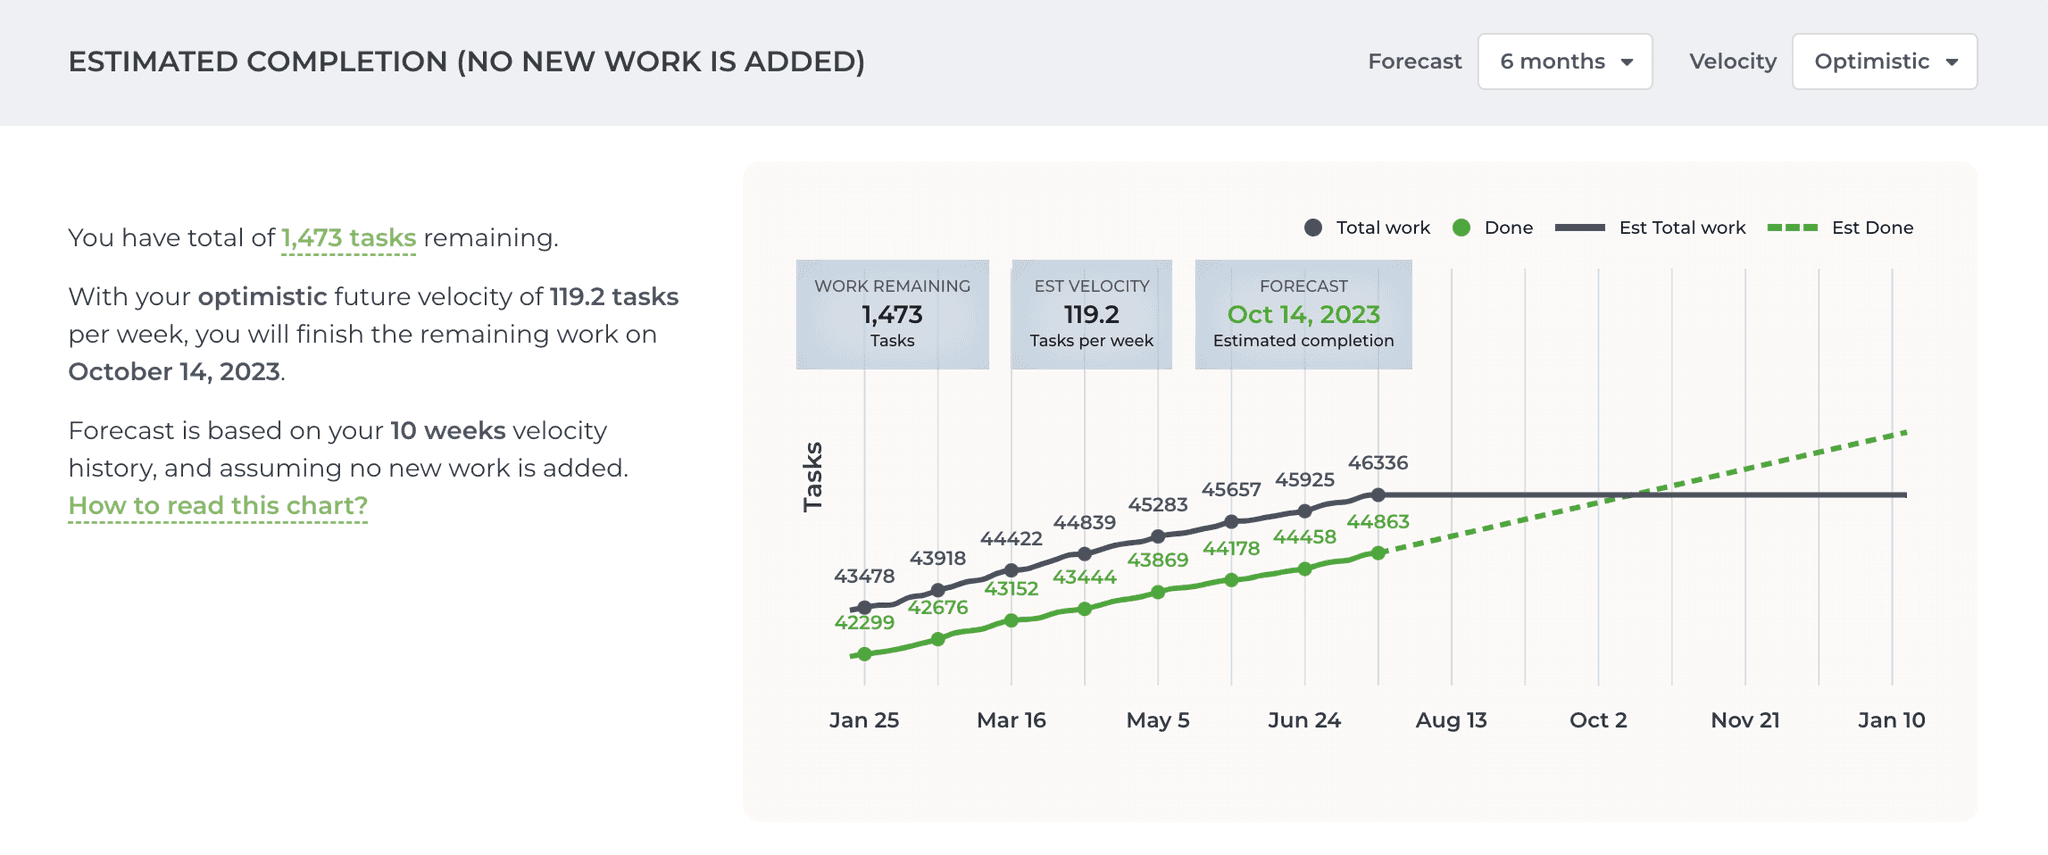
Análisis e Informes
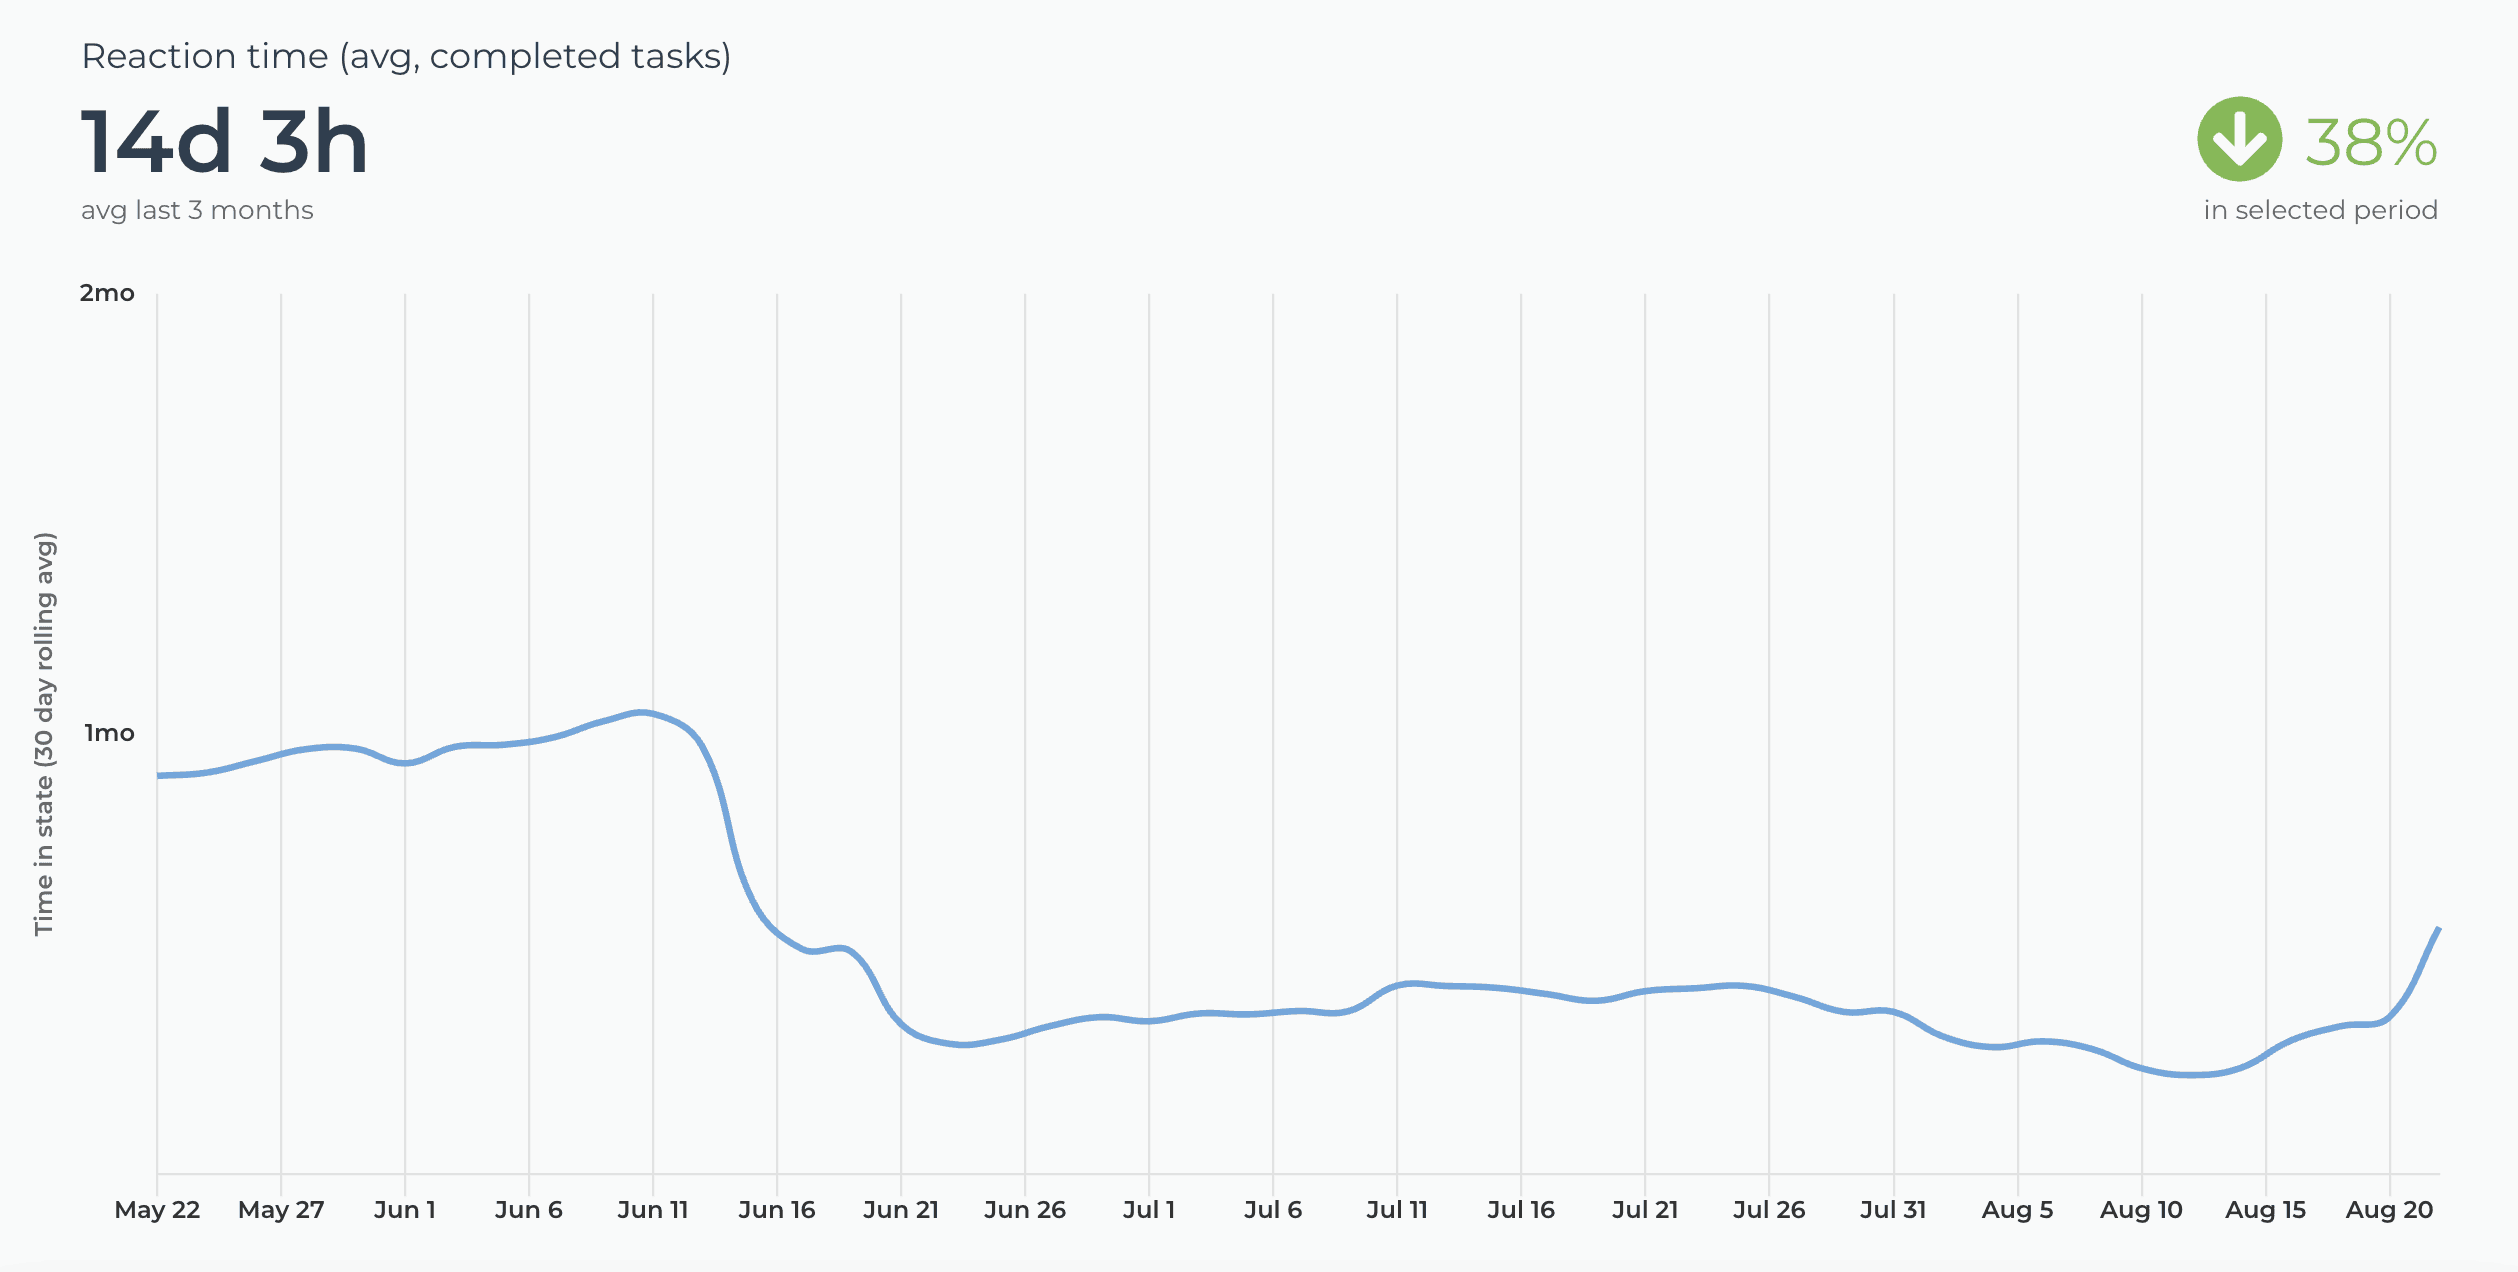
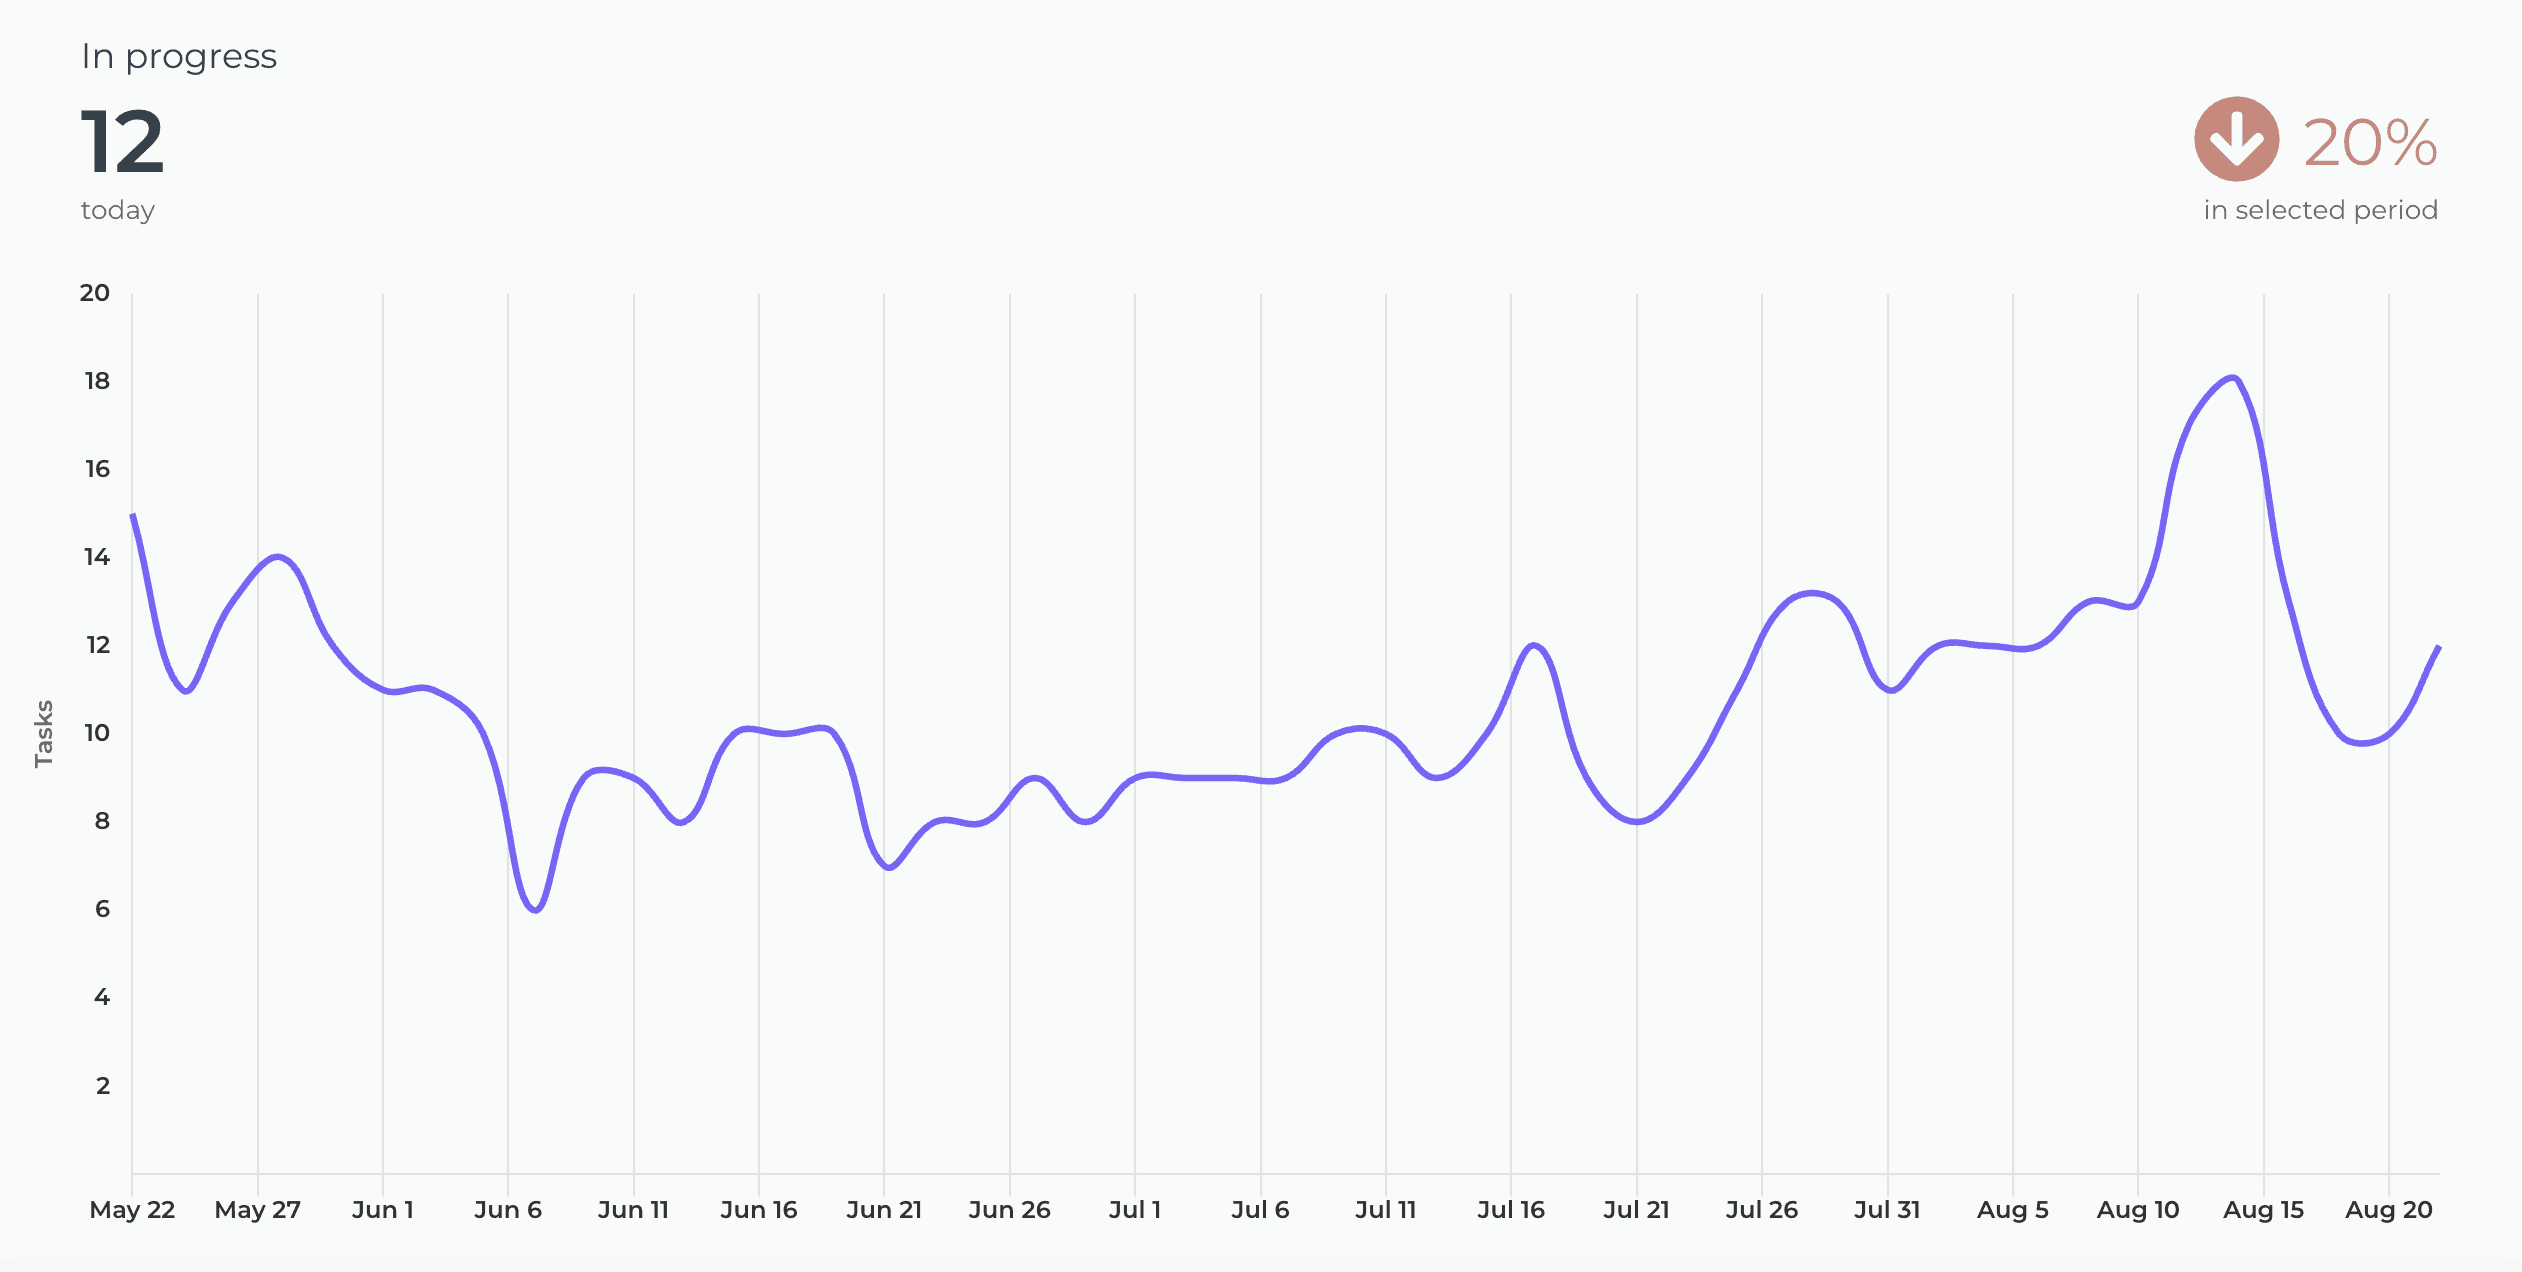
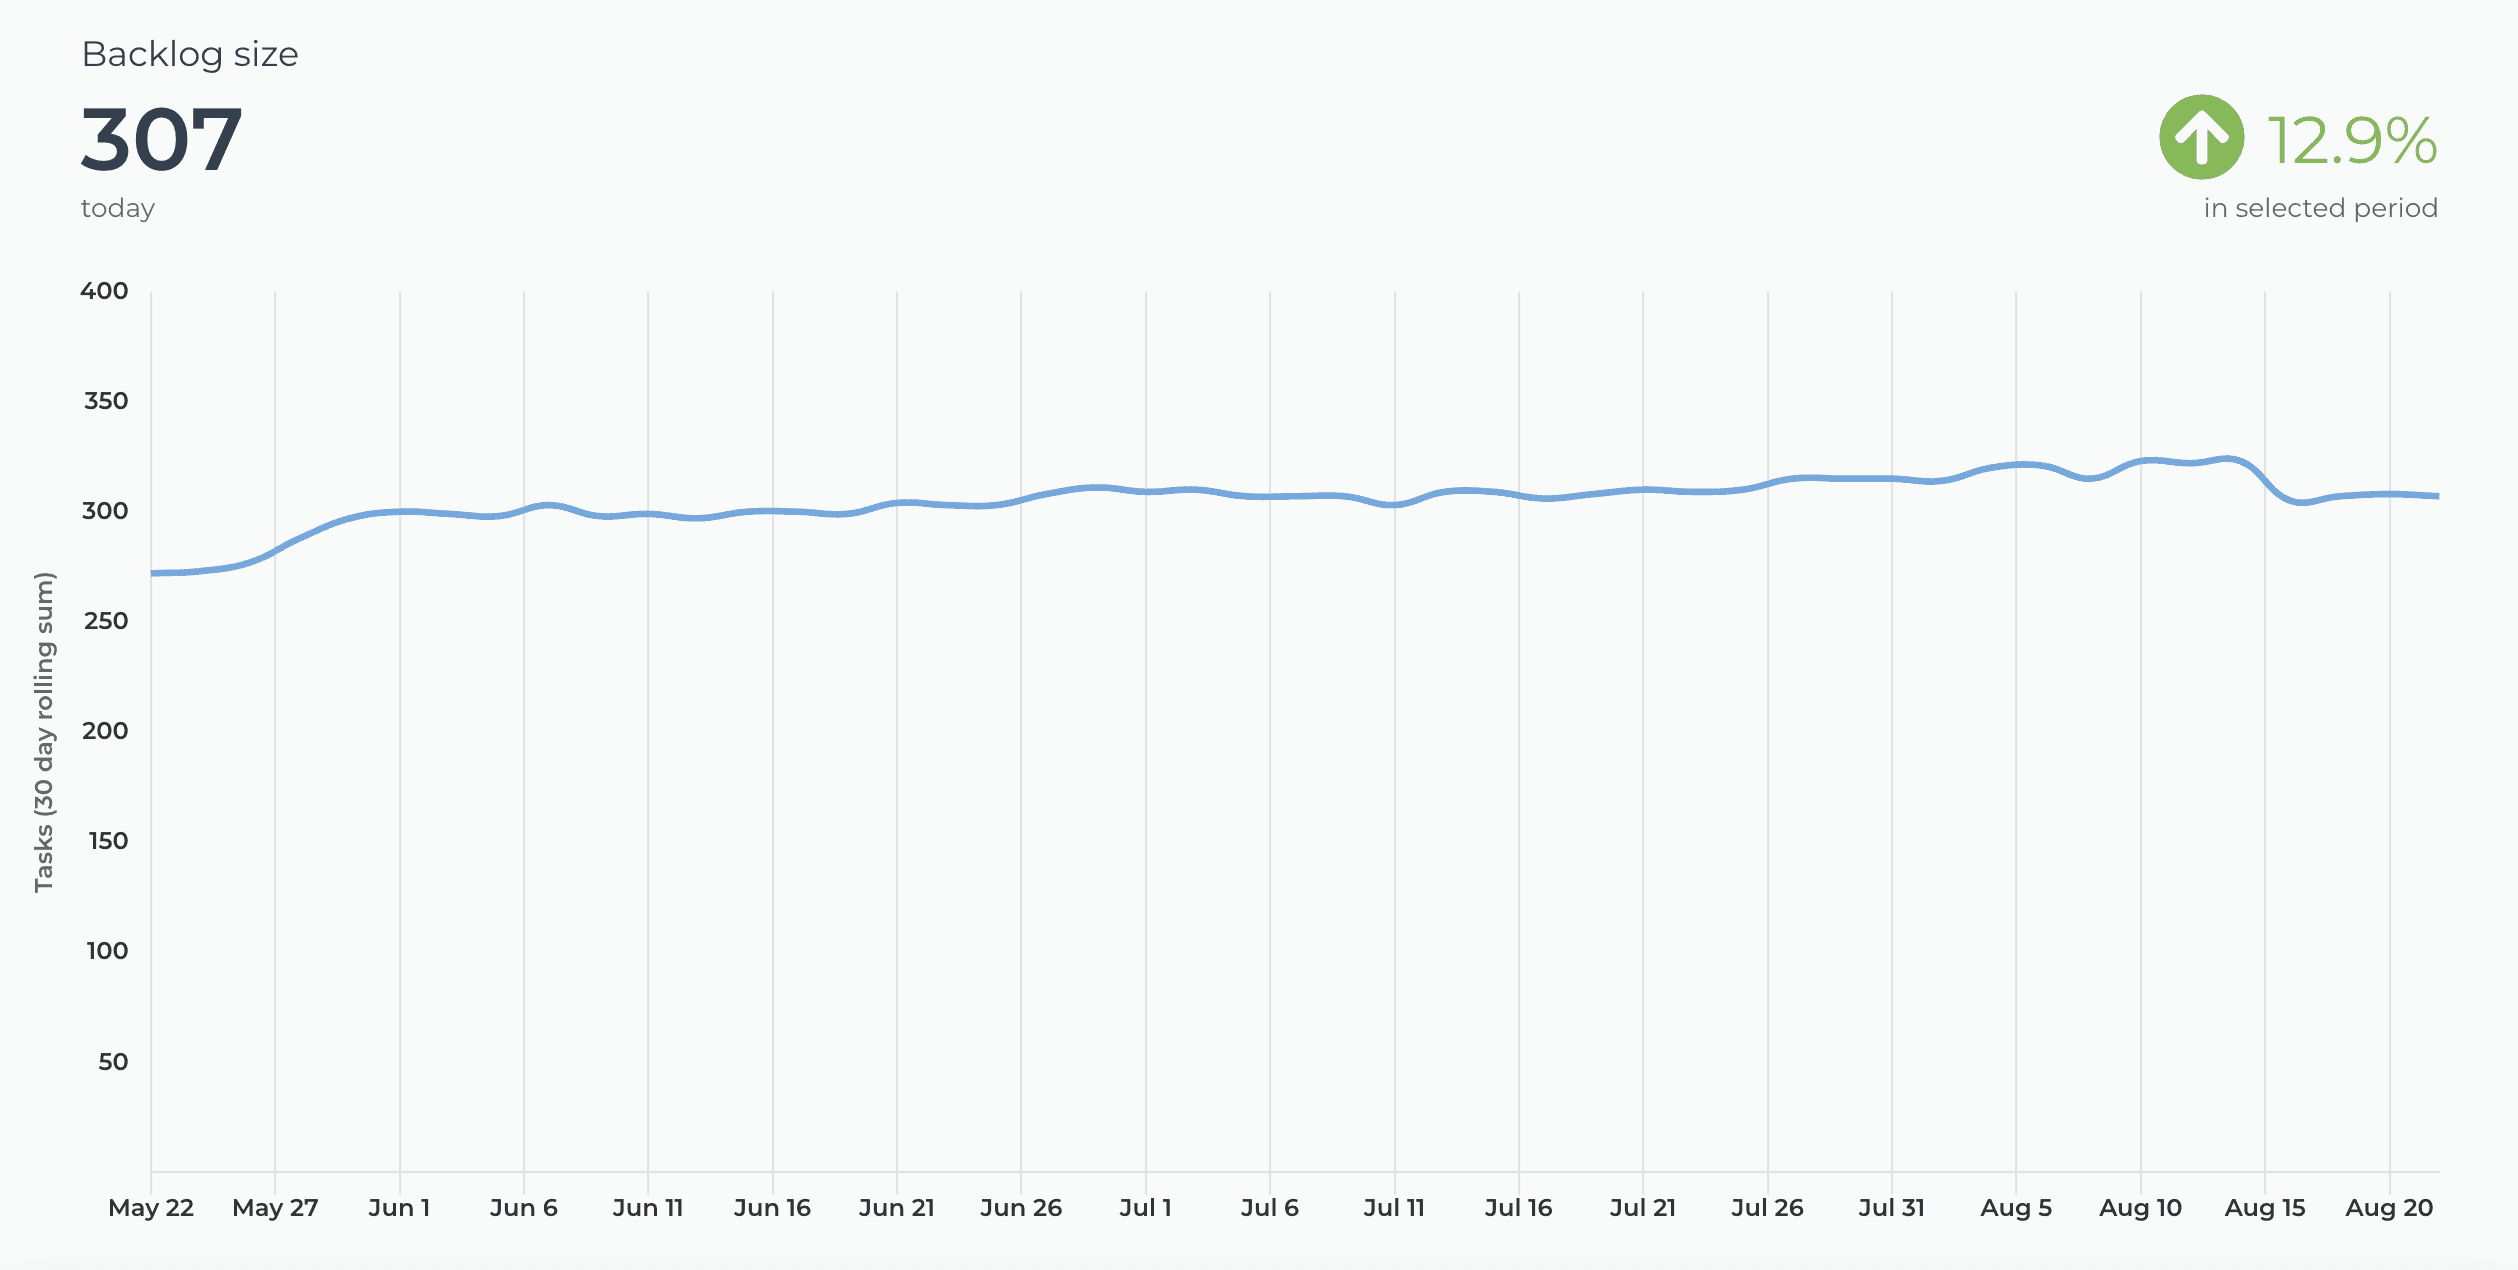
Obtenga información práctica de monday.com con informes automatizados y gráficos personalizables.
Apreciado por líderes de la industria


"Really good looking views and easy setup. Ideal for providing open visibility for the progress across the company."
🏆🏆🏆
Winner of the Best Trello Power-Up, and an Honorary Mention in the Jira Apps Category at the Atlassian Codegeist


Learn how to automate your Trello reporting
Browse our recent blog posts and product updates


kit completo
De cero a valor en minutos con plantillas probadas
De cero a valor en minutos con plantillas probadas


FAQ
Preguntas comunes
Do you have a free version?
Yes and no. We have a set of free Power-Ups that you can freely install to your boards. We also have a paid product, Analytics & reports, which you can try for free.
Yes and no. We have a set of free Power-Ups that you can freely install to your boards. We also have a paid product, Analytics & reports, which you can try for free.
Do I need a paid version of Trello in order to use Screenful?
Screenful has its own pricing plan, separate from Trello. You don't need a paid version of Trello in order to use Screenful.
Screenful has its own pricing plan, separate from Trello. You don't need a paid version of Trello in order to use Screenful.
What’s the difference between Screenful Power-Up and the Screenful SaaS service?
Both have the same features, except that with the Power-up, you can embed Screenful within your Trello UI. Regardless of whether you have installed the Power-Up or not, you can always use Screenful just like any standalone web app by logging in at https://screenful.com/login/.
Both have the same features, except that with the Power-up, you can embed Screenful within your Trello UI. Regardless of whether you have installed the Power-Up or not, you can always use Screenful just like any standalone web app by logging in at https://screenful.com/login/.
What about your free Power-Ups, do I need to use them?
You don’t have to use our free Power-Ups but if you do, the data created in the Power-Ups will be available in your charts, reports, and dashboards.
You don’t have to use our free Power-Ups but if you do, the data created in the Power-Ups will be available in your charts, reports, and dashboards.
Can I create charts based on due dates in cards?
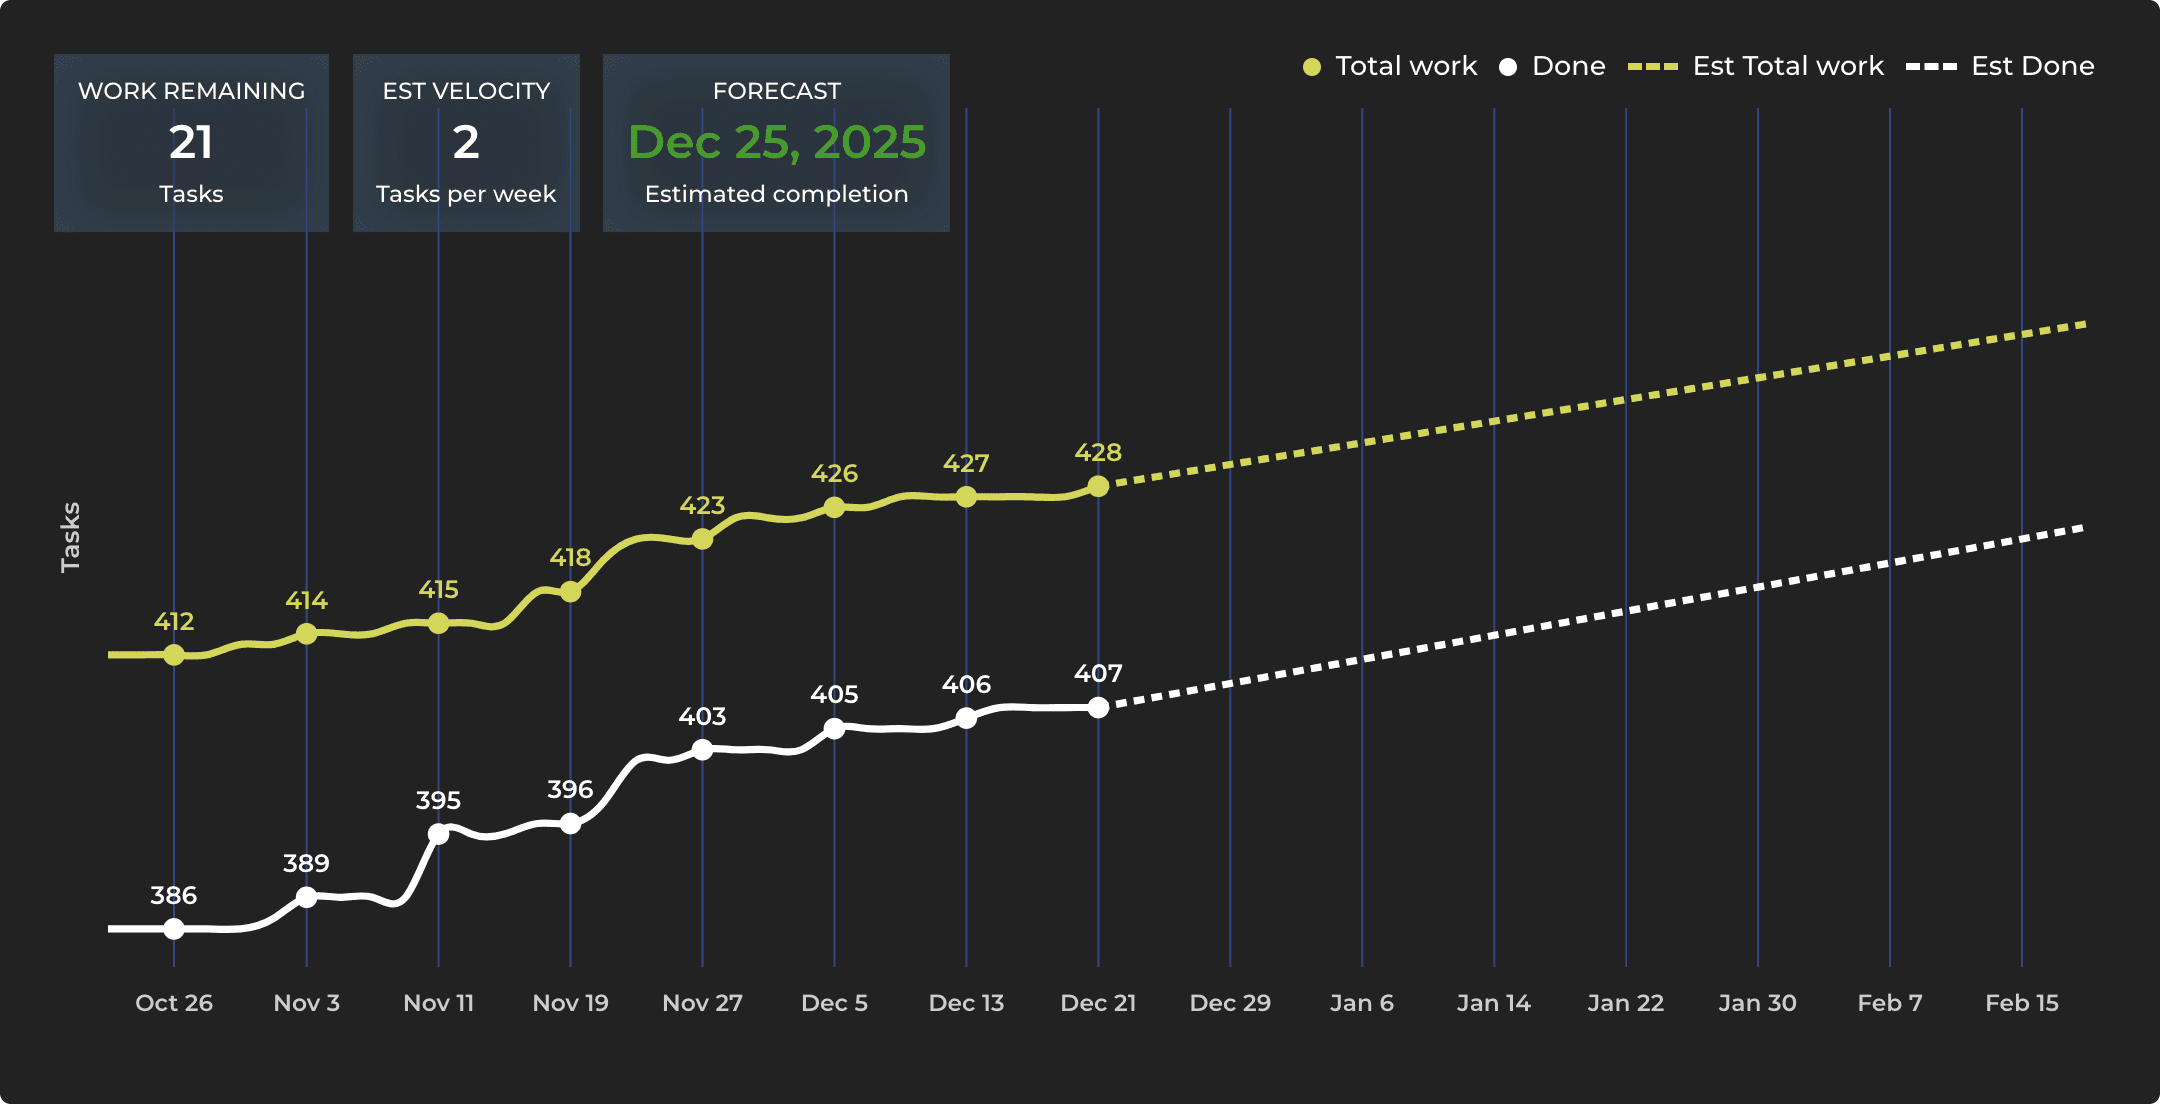
Yes, you can filter charts based on due dates or by status such as overdue. You can also track the amount of work planned for the future using the Workload chart. Learn more about setting up the workload chart for Trello.
Yes, you can filter charts based on due dates or by status such as overdue. You can also track the amount of work planned for the future using the Workload chart. Learn more about setting up the workload chart for Trello.
Do you support work estimates such as story points?
Yes. You can use a custom field or the free Card Size Power-Up for setting weights for cards. Lean more about how to set estimates in your tasks in Trello.
Yes. You can use a custom field or the free Card Size Power-Up for setting weights for cards. Lean more about how to set estimates in your tasks in Trello.
What if I archive a card?
Archived cards are treated differently depending on whether they are completed or not. Completed cards are still considered completed even if they are archived. Cards that are archived before they are completed are considered removed. Archiving a card doesn't affect the metrics collected before it was archived.
Archived cards are treated differently depending on whether they are completed or not. Completed cards are still considered completed even if they are archived. Cards that are archived before they are completed are considered removed. Archiving a card doesn't affect the metrics collected before it was archived.
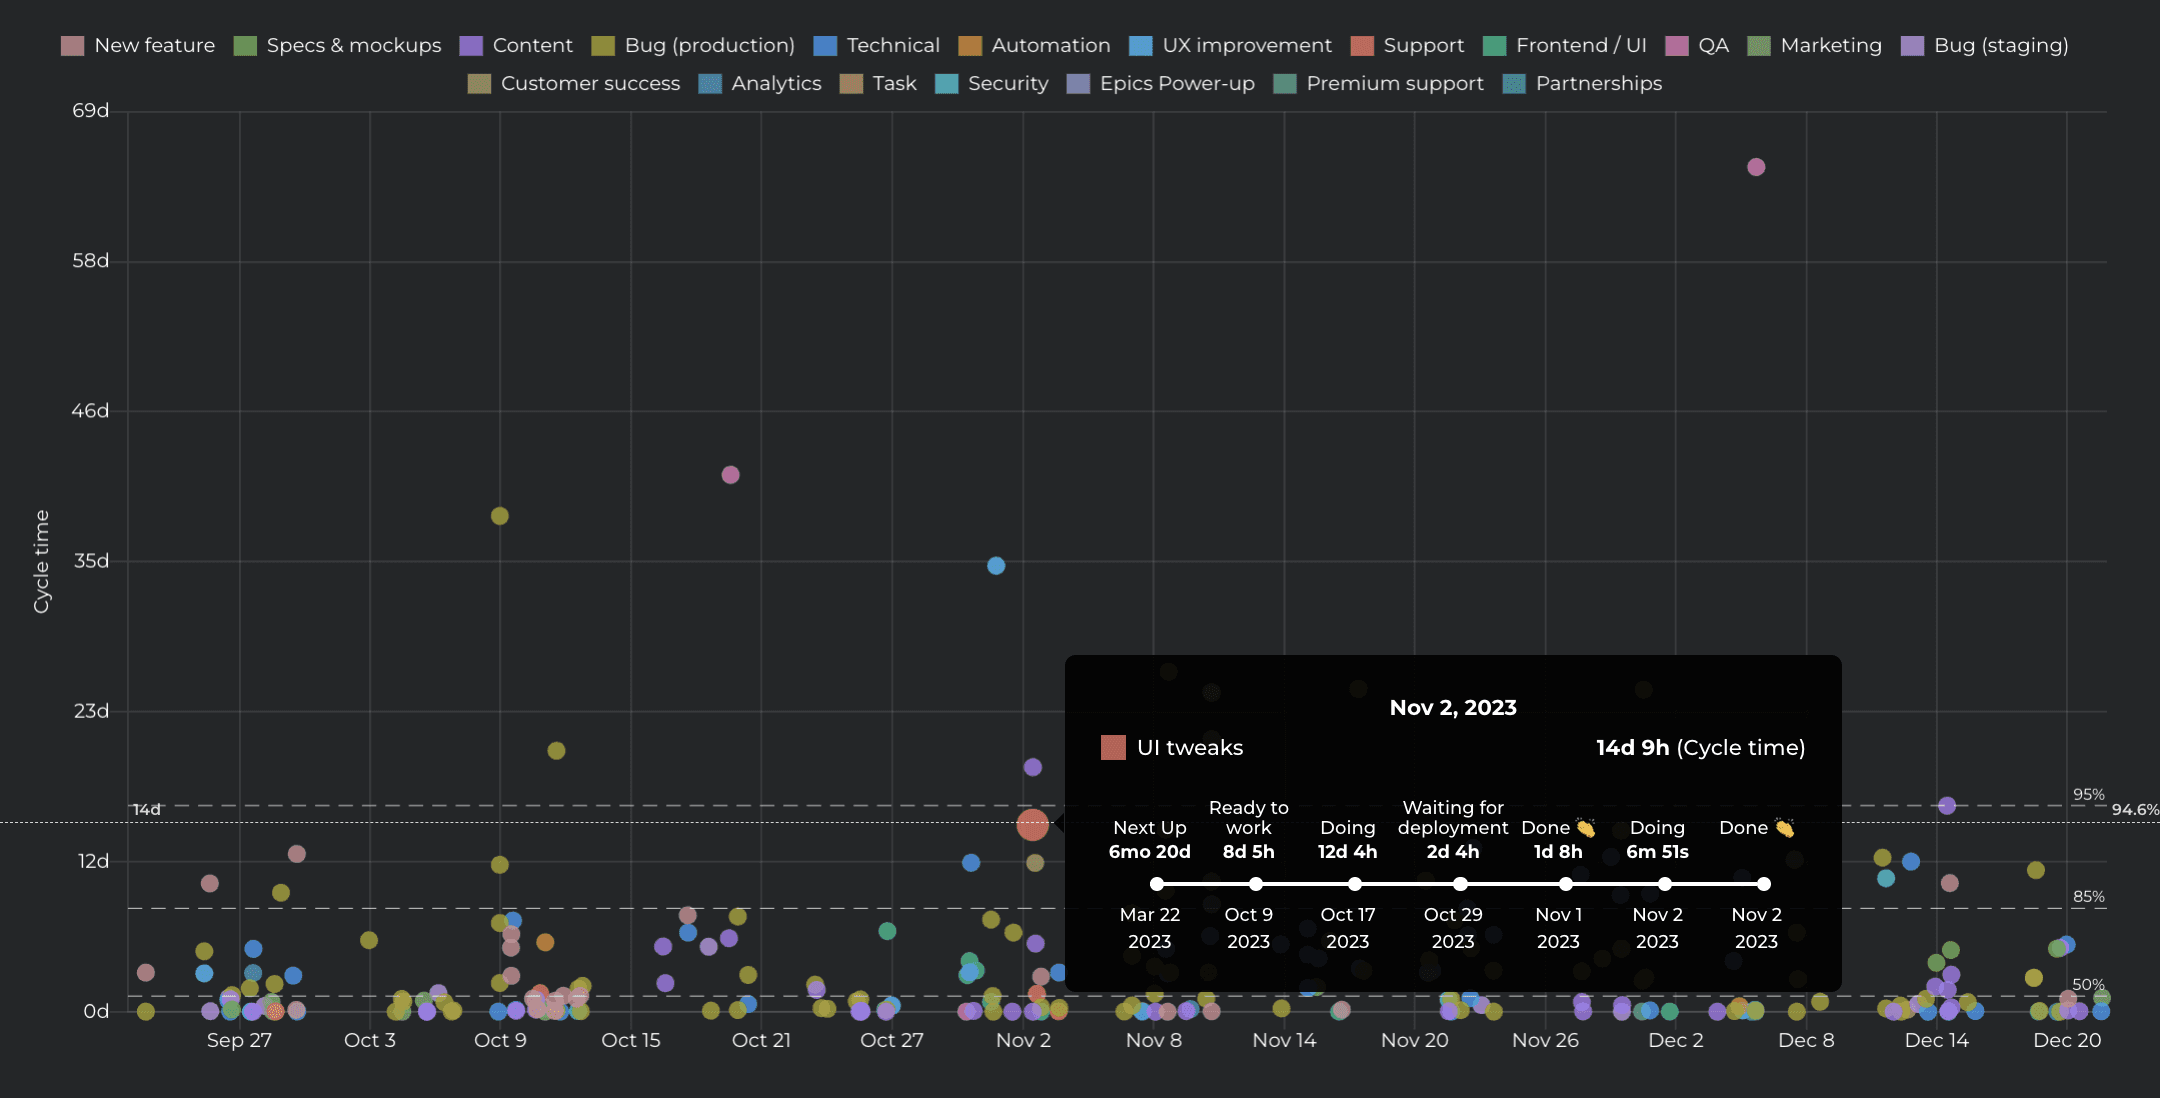
How are the lead and cycle times calculated in Trello?
The timings are based on your workflow settings. You can learn more from the Lead Time FAQ.
The timings are based on your workflow settings. You can learn more from the Lead Time FAQ.
How do the Card size metrics work?
The card size metrics are defined as below:
Total -> Total amount of card size in the cards
Created -> Total amount of card size in the cards created within the selected period
Completed -> Total amount of card size in the cards completed within the selected period
Spent -> Total amount of card size spent in the cards completed within the selected period
Average -> Average card size in the cards
In progress -> Total amount of card size in the cards currently in progress
Remaining -> Total amount of card size remaining
I have created automation to move cards from one board to another. Will that mess up my stats?
If a card is moved from one board A to board B, you will lose the data about the card movements in board A since the Trello API won’t return it anymore. The solution is to copy the card instead of moving it.
If a card is moved from one board A to board B, you will lose the data about the card movements in board A since the Trello API won’t return it anymore. The solution is to copy the card instead of moving it.
Solución de problemas
I have created a Butler automation to move completed cards from one Trello board to another. Will that mess up my stats?
If a card is moved from board A to board B, you will lose the card history from the board A since the Trello API won't return it anymore. Instead of moving to another board, you can create an automation to archive the card.
Once archived, the card is no longer visible on the board but is still included in Trello's search feature, and can be returned to the board at any time if needed.
Another option is to add a delay of at least two hours before moving an item. That leaves enough time for Screenful to register that the card was completed (sync runs once per hour).
Why I can’t see my Trello board when trying to create a new chart or dashboard?
You have to import the board as a data source first. If you don't see the board in the list of boards to import, you'll have to join that Trello board first to see it in the list. Once the board is imported, you can add it as a data source to charts.
You have to import the board as a data source first. If you don't see the board in the list of boards to import, you'll have to join that Trello board first to see it in the list. Once the board is imported, you can add it as a data source to charts.
Why are my charts not showing all the tasks I’ve assigned to my epics?
The most likely reason is that the chart does not have all the data sources included. If the tasks in your epics are scattered across multiple boards, all those boards must be added as data sources to the chart.
You should also review your workflow mapping to ensure all the required lists are mapped.