Add custom charts to a dashboard
Add custom charts to a dashboard
To add a custom chart to a dashboard, select Add ► Create custom chart from the main menu.

A modal is opened showing your existing charts. Those are the charts that you have created under the Charts tab. You can either pick an existing chart or create a new chart by selecting Add new chart.
If you decide to create a new chart from scratch, the chart editor opens allowing you to configure the chart.
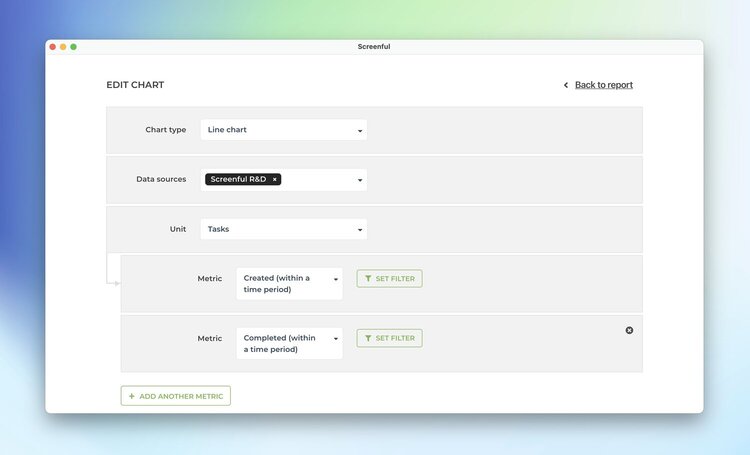
Select the chart type such as line chart, dual axis line chart, scatter plot, stacked bar chart, or multi-bar chart.
Pick other properties for the chart such as unit and a date range. Once you click Create chart, the new chart is placed as the last screen in your dashboard.

To add a custom chart to a dashboard, select Add ► Create custom chart from the main menu.
A modal is opened showing your existing charts. Those are the charts that you have created under the Charts tab. You can either pick an existing chart or create a new chart by selecting Add new chart.
If you decide to create a new chart from scratch, the chart editor opens allowing you to configure the chart.
Select the chart type such as line chart, dual axis line chart, scatter plot, stacked bar chart, or multi-bar chart.
Pick other properties for the chart such as unit and a date range. Once you click Create chart, the new chart is placed as the last screen in your dashboard.