Set filter to adjust the charts
Set filter to adjust the charts
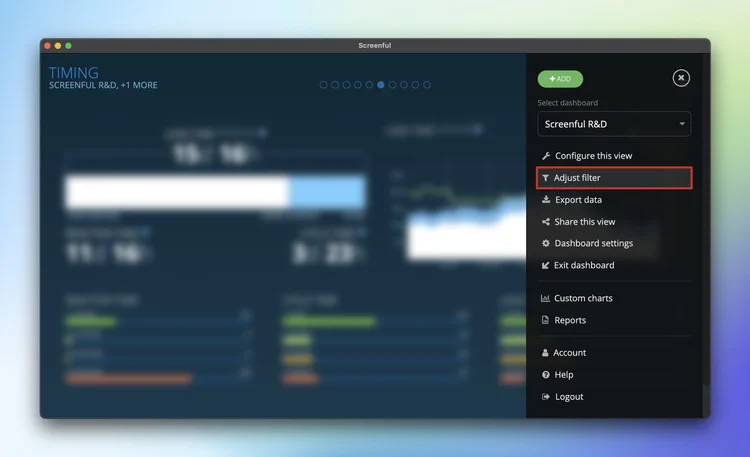
You can use the filter feature to adjust the content shown in the charts. Start by selecting Adjust filter from the main menu.
You can filter the chart by any fixed property of a task such as task type, assignee, workflow state, label, or by any of your drop down custom fields. Notice that the available options depend on the type of chart that you're filtering so that each chart come with filtering options relevant to that specific chart.

Once you've made your selections, click Apply to you only to see the filtered chart. You'll notice that a small filter icon has appeared to the top left corner. Moving your mouse pointer over that icon reveals the set filter.

To remove the filter, go back to filtering window and click Reset to default.
You can share a filter with other users by clicking Apply to all users. That makes the filtered view as the default setting for this chart for all users.
Filters are always specific to the screen so that a filter applied to one screen does not affect other screens in your dashboard.
You can use the filter feature to adjust the content shown in the charts. Start by selecting Adjust filter from the main menu.
You can filter the chart by any fixed property of a task such as task type, assignee, workflow state, label, or by any of your drop down custom fields. Notice that the available options depend on the type of chart that you're filtering so that each chart come with filtering options relevant to that specific chart.
Once you've made your selections, click Apply to you only to see the filtered chart. You'll notice that a small filter icon has appeared to the top left corner. Moving your mouse pointer over that icon reveals the set filter.
To remove the filter, go back to filtering window and click Reset to default.
You can share a filter with other users by clicking Apply to all users. That makes the filtered view as the default setting for this chart for all users.
Filters are always specific to the screen so that a filter applied to one screen does not affect other screens in your dashboard.