You can use the Line chart for tracking planned work based on set due dates with the work completed using data from monday.com, Jira, GitHub, Linear, or any of tools we support with our analytics. It allows you to see whether you are ahead or behind the plan.

Create a project plan
Here's an example project board with tasks assigned to team members. It contains the tasks planned for the project with their due dates.

While the example board above is from monday.com, you can have this data in any of the tools we support. You can structure your board any way you want as long as the key information is present:
Task name
Work estimate (optional)
Due date
Your due date field doesn't have to be called 'Due date' since you can use any of your custom date or timeline fields for that purpose. The only thing that matters is that your work items have a planned completion date that you can select for your chart.
Create a line chart for the planned work
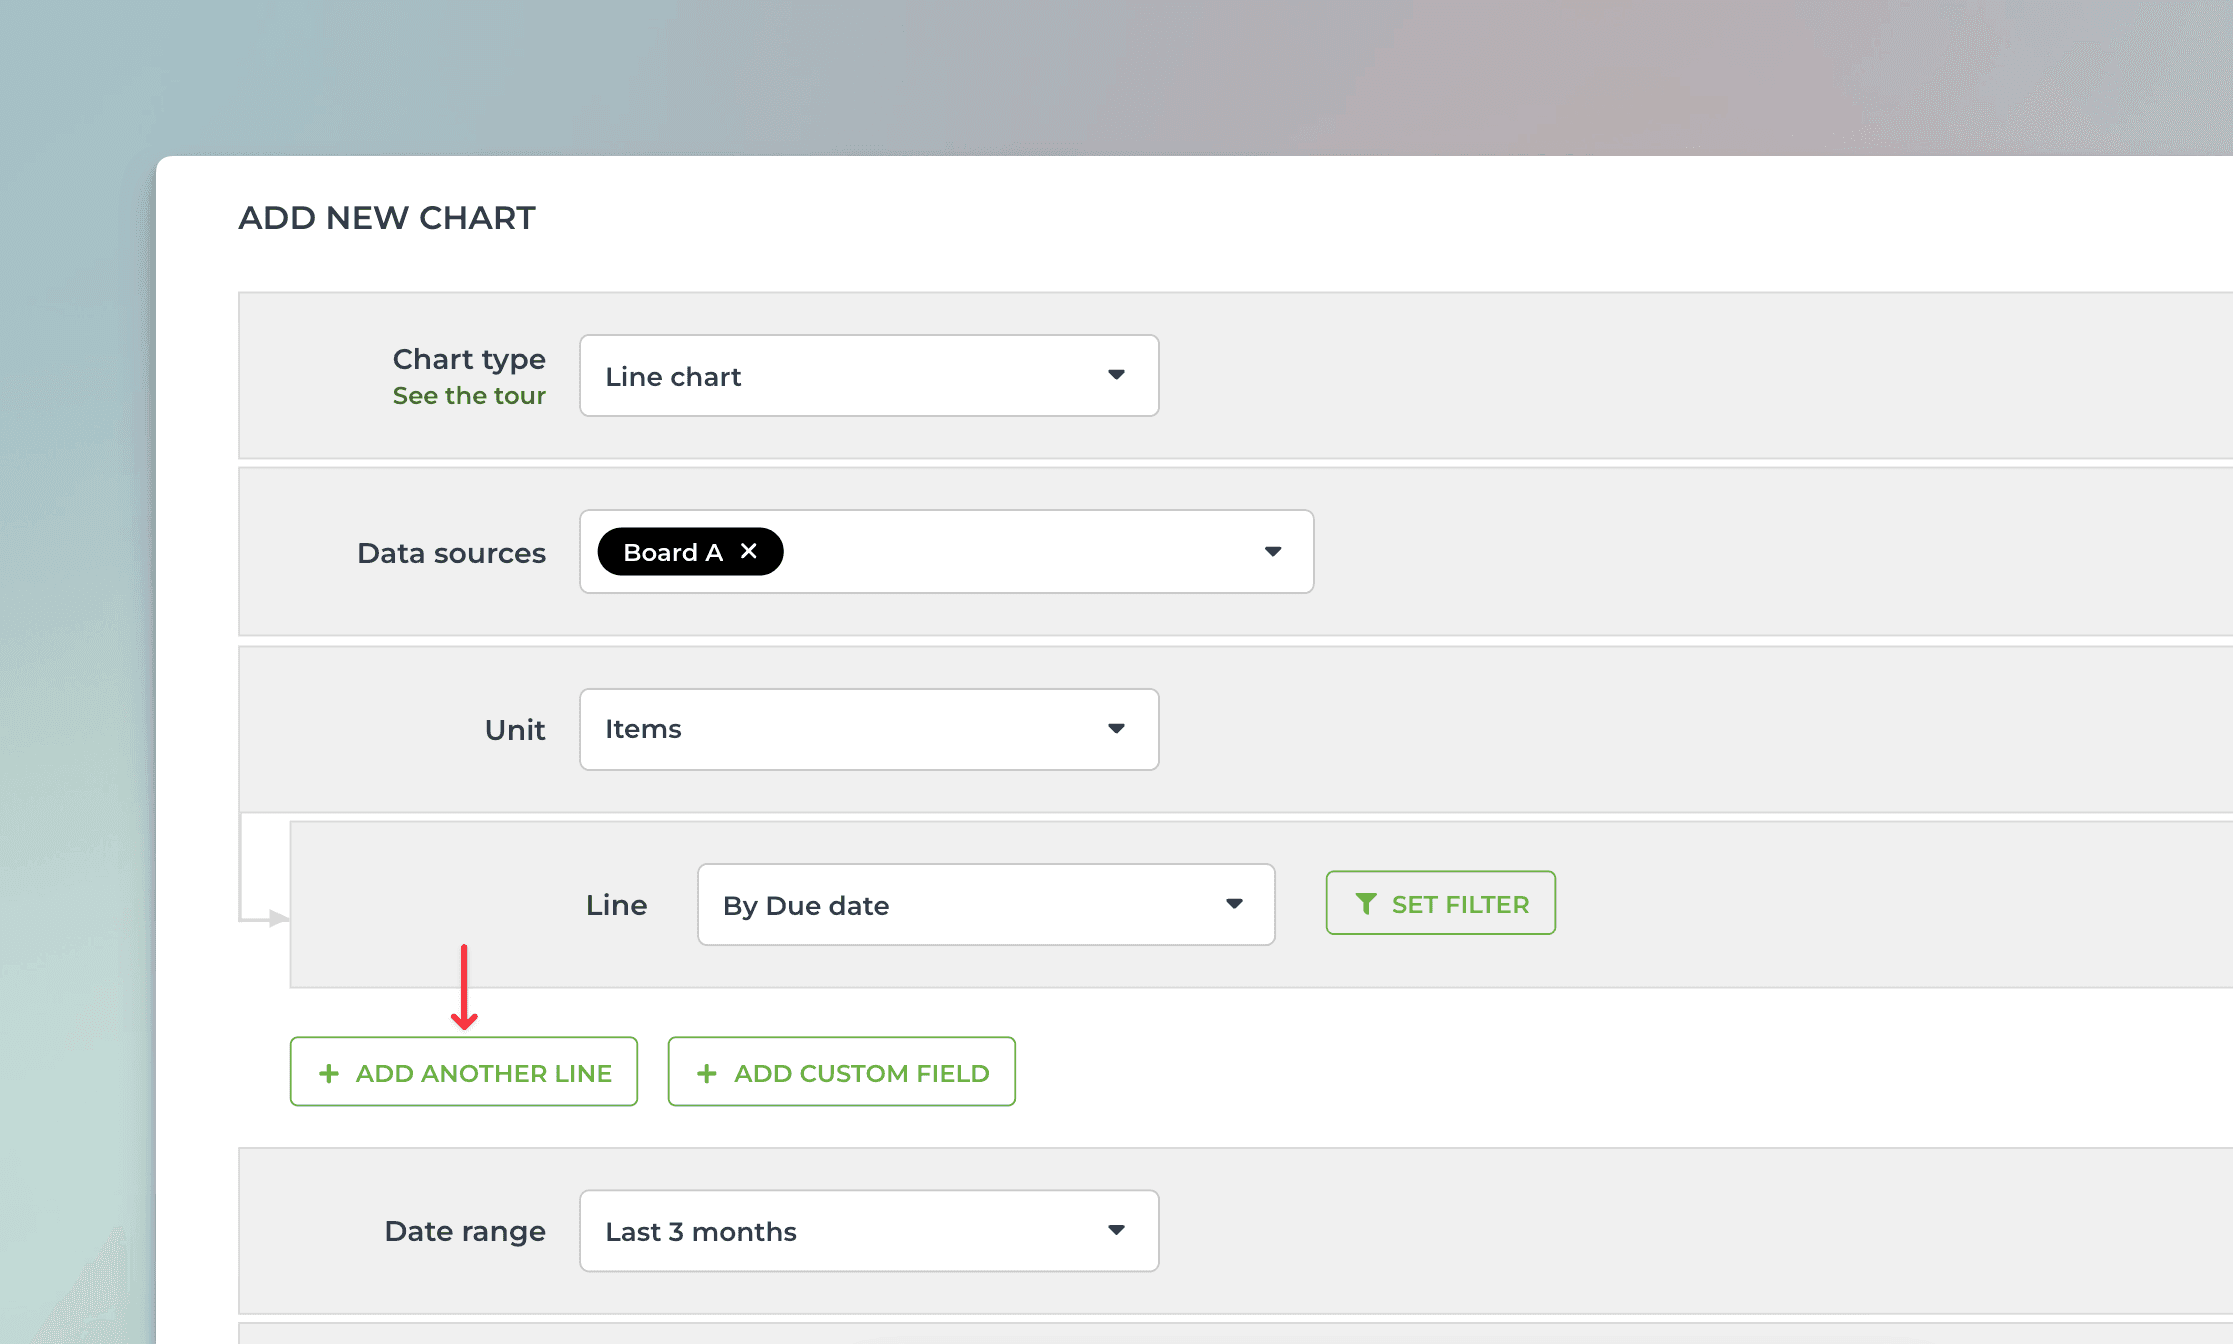
Once you have imported the board as a data source in Screenful, navigate to the Charts tab and click 'Add new chart'. Select Line chart as the chart type. Since we are interested in plotting our chart based on due dates, select By Due date from the menu.

Clicking Preview shows the chart with one line representing the amount of work planned during the lifecycle of the project:

If you have work estimates set for the tasks, you can pick your estimate field from the unit menu:

Once selected, the chart will show estimates instead of item counts.
Add another line for completed work
To add the comparison line, click Add another line:
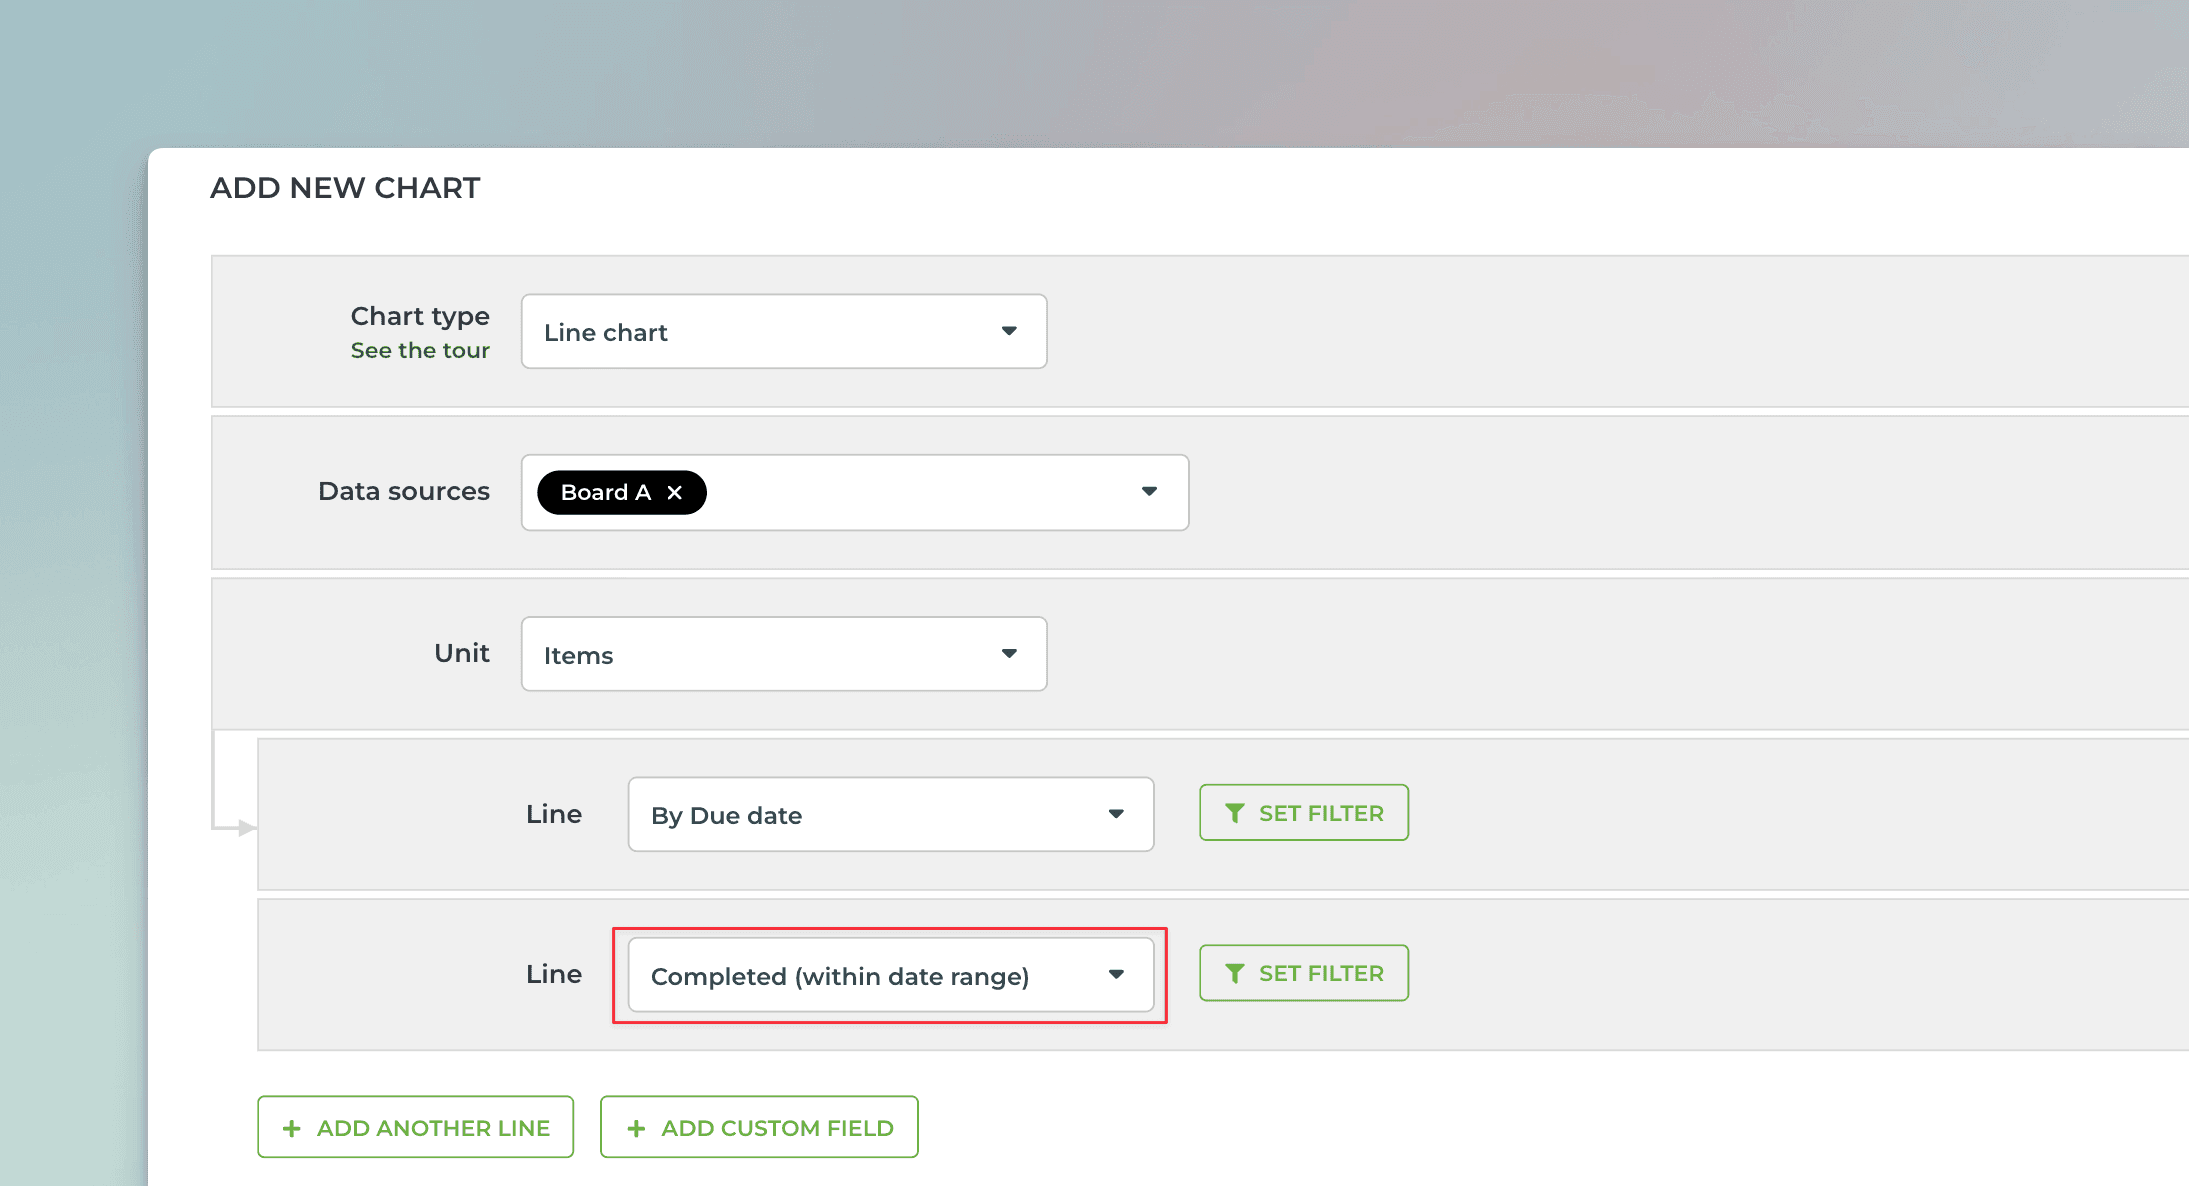
The second line is used for plotting the completed work. Select Completed (within date range) from the menu:
Now, the chart shows two lines: one representing the planned completion according to the set due dates for the tasks, and the second line showing the actual completion of the work.
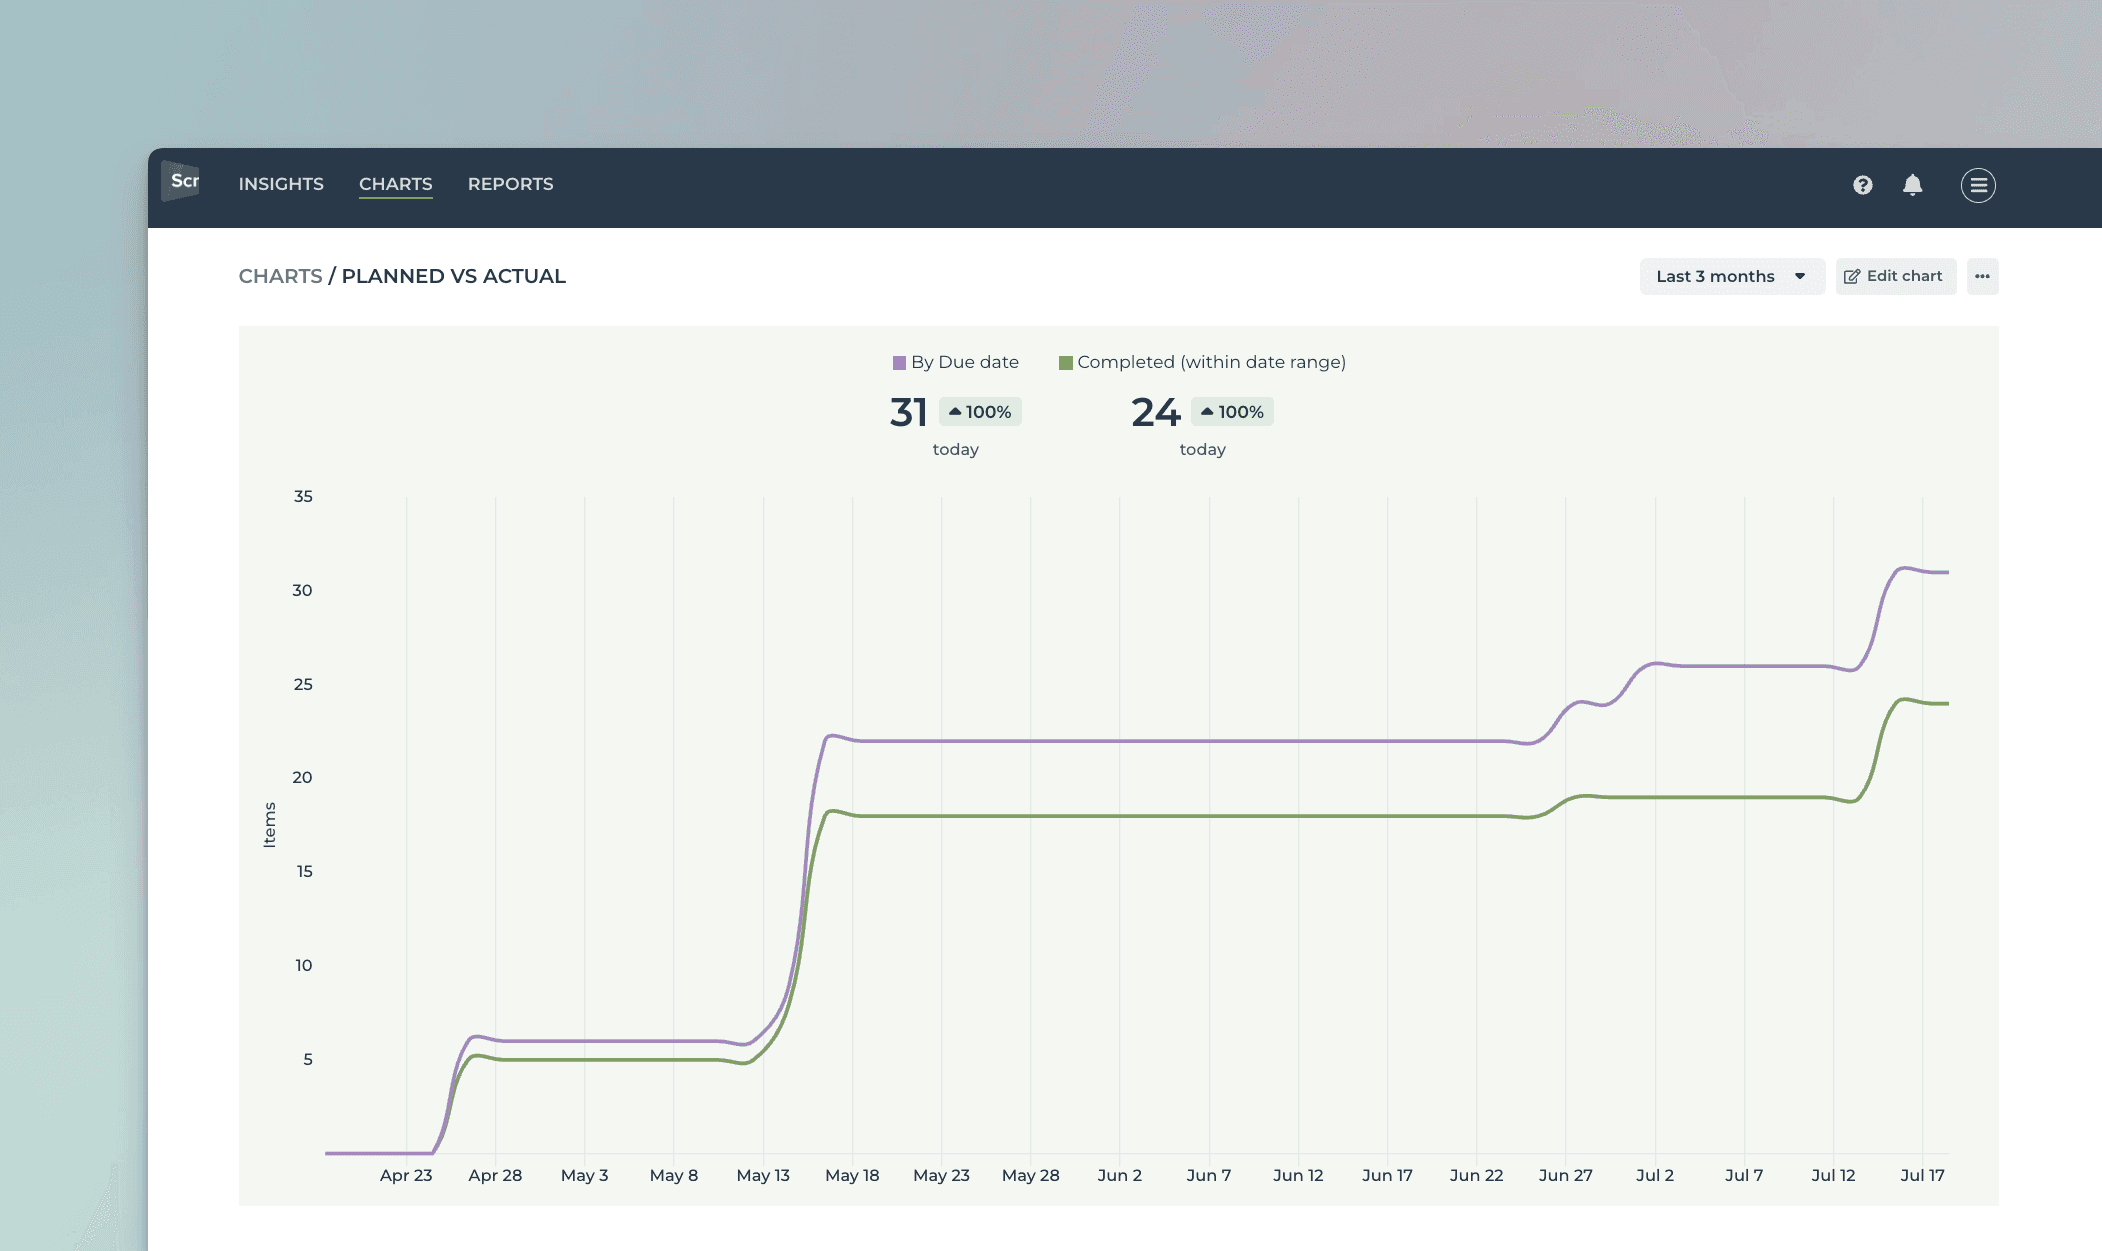
The chart shows that the team is slightly behind schedule, having completed 24 tasks, whereas the original project plan anticipated 31 tasks to be completed by this date.
Book a free onboarding call
Need help with setting up your charts and reports? Don't find a metric you are looking for? Book a call with our expert. We'd love to help you supercharge your reporting!


