You can track timings for the work that is currently in progress. Get started quickly by creating a chart from a template. Learn also how to filter by time in progress or time in a workflow state.
Create timings chart from a template
You can use the Task list chart to display the timings for individual items.
To create a custom chart with Screenful, go to the Charts tab and click Add new chart in the top right corner. A modal is opened with a set of chart templates. You can create a new chart from scratch or pick one of the predefined charts.
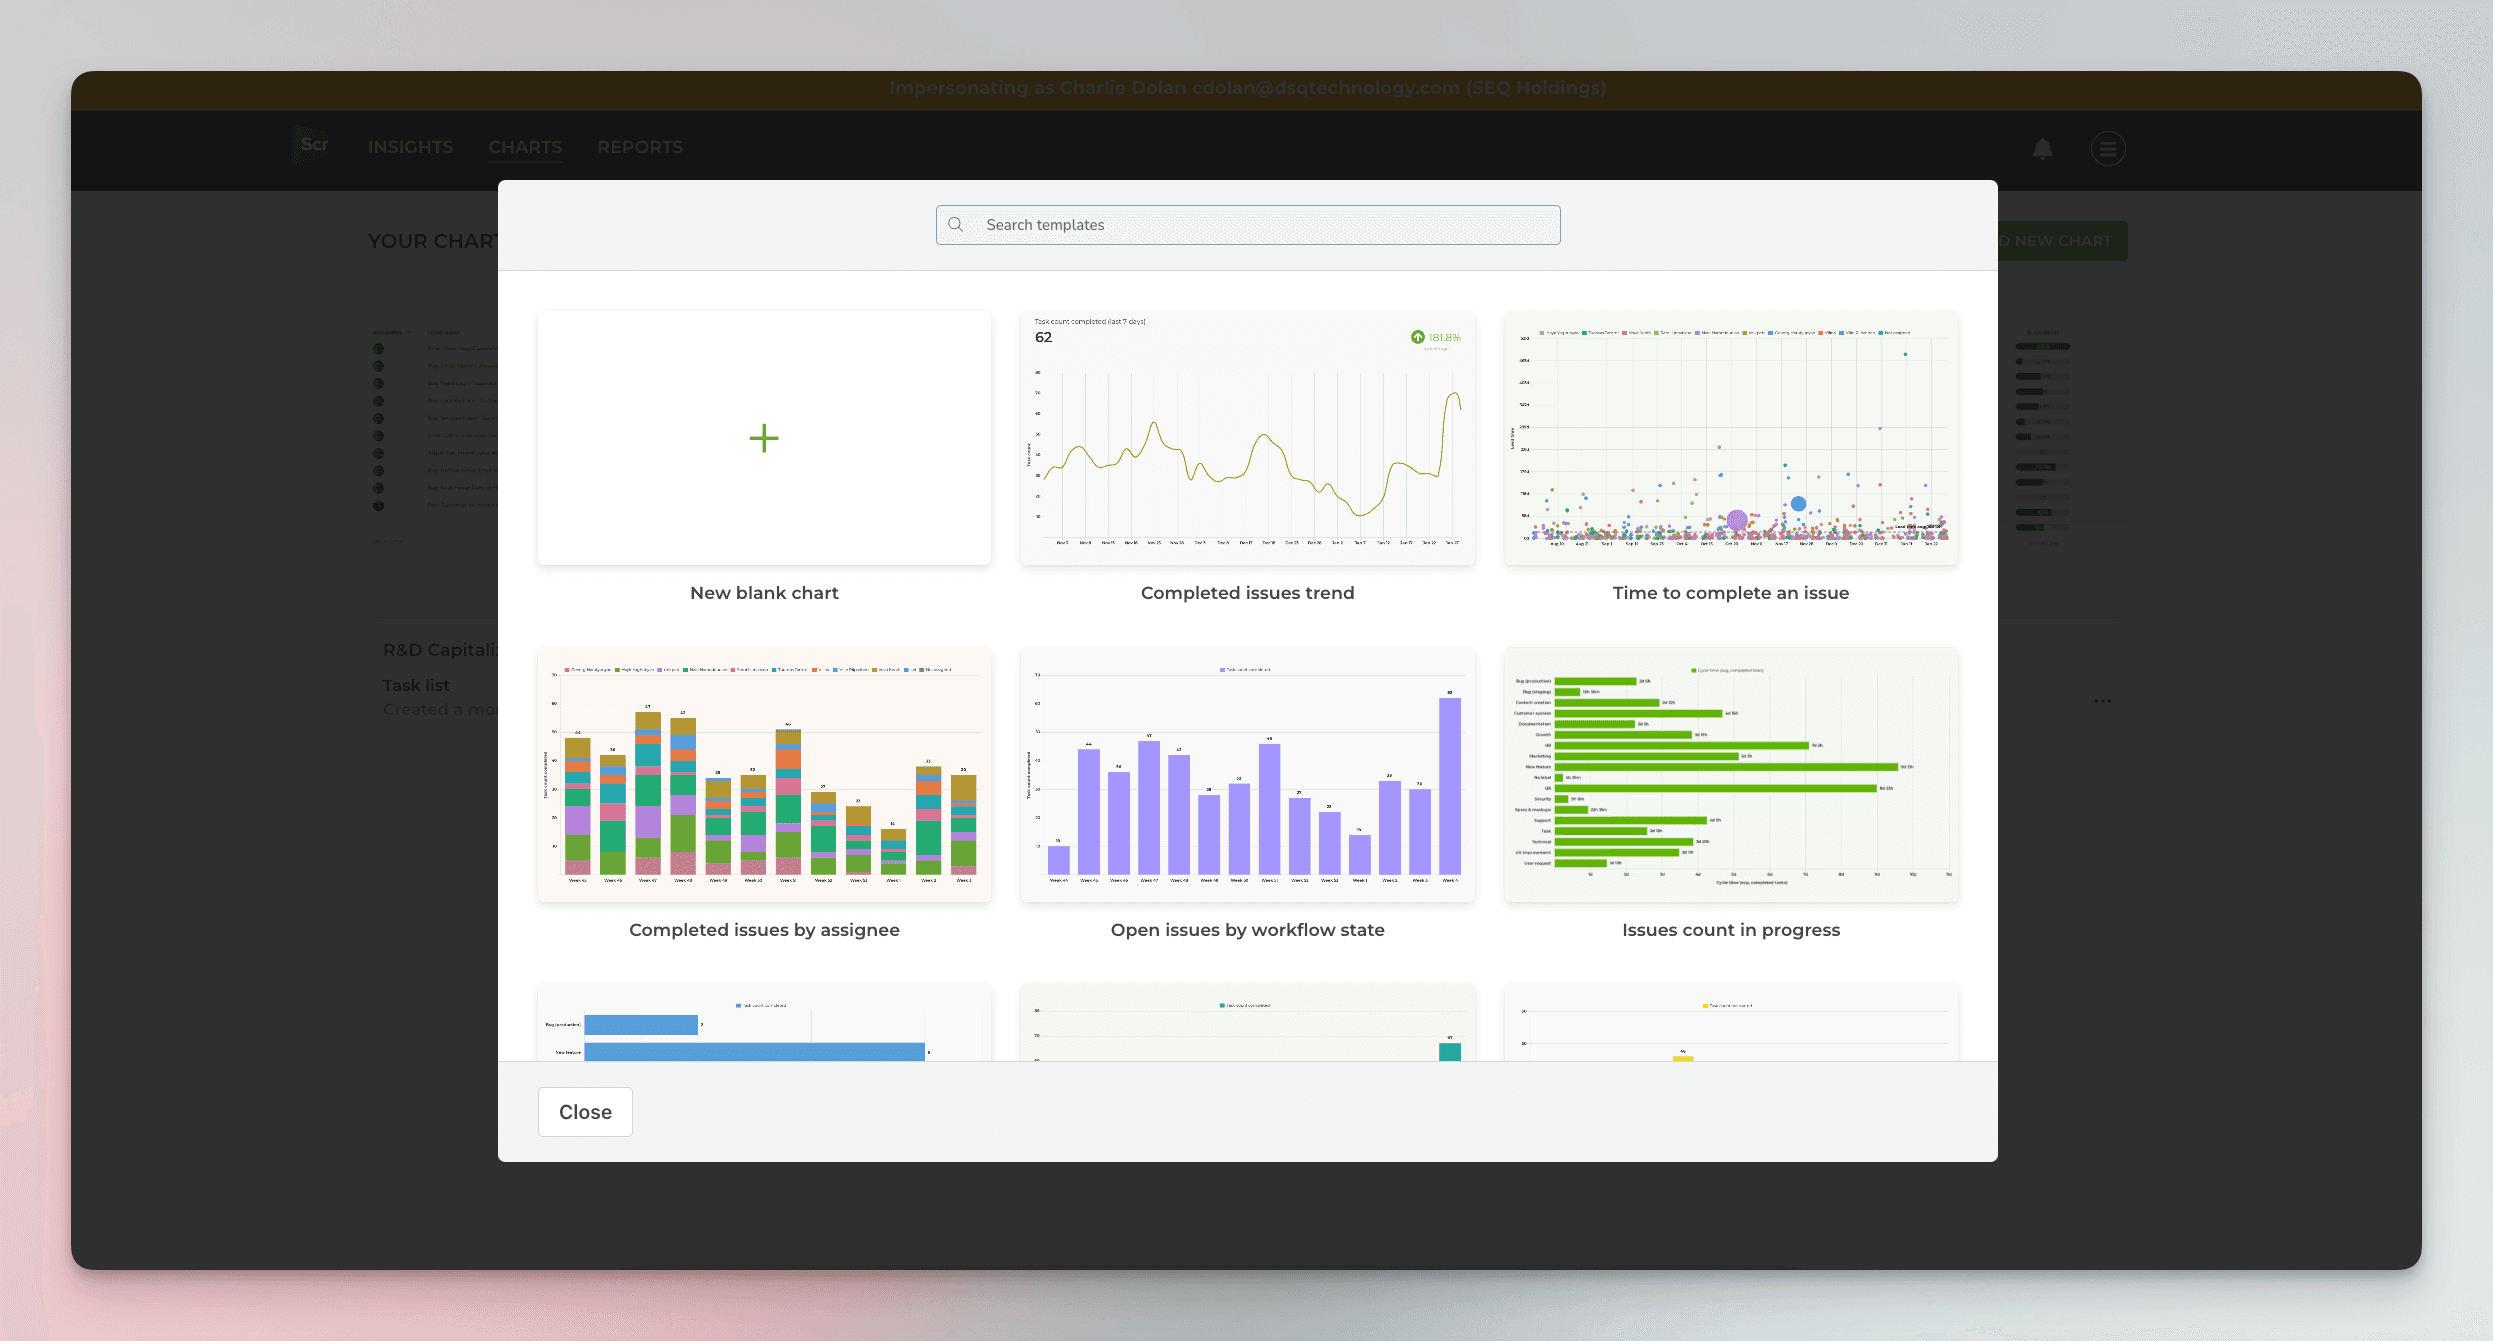
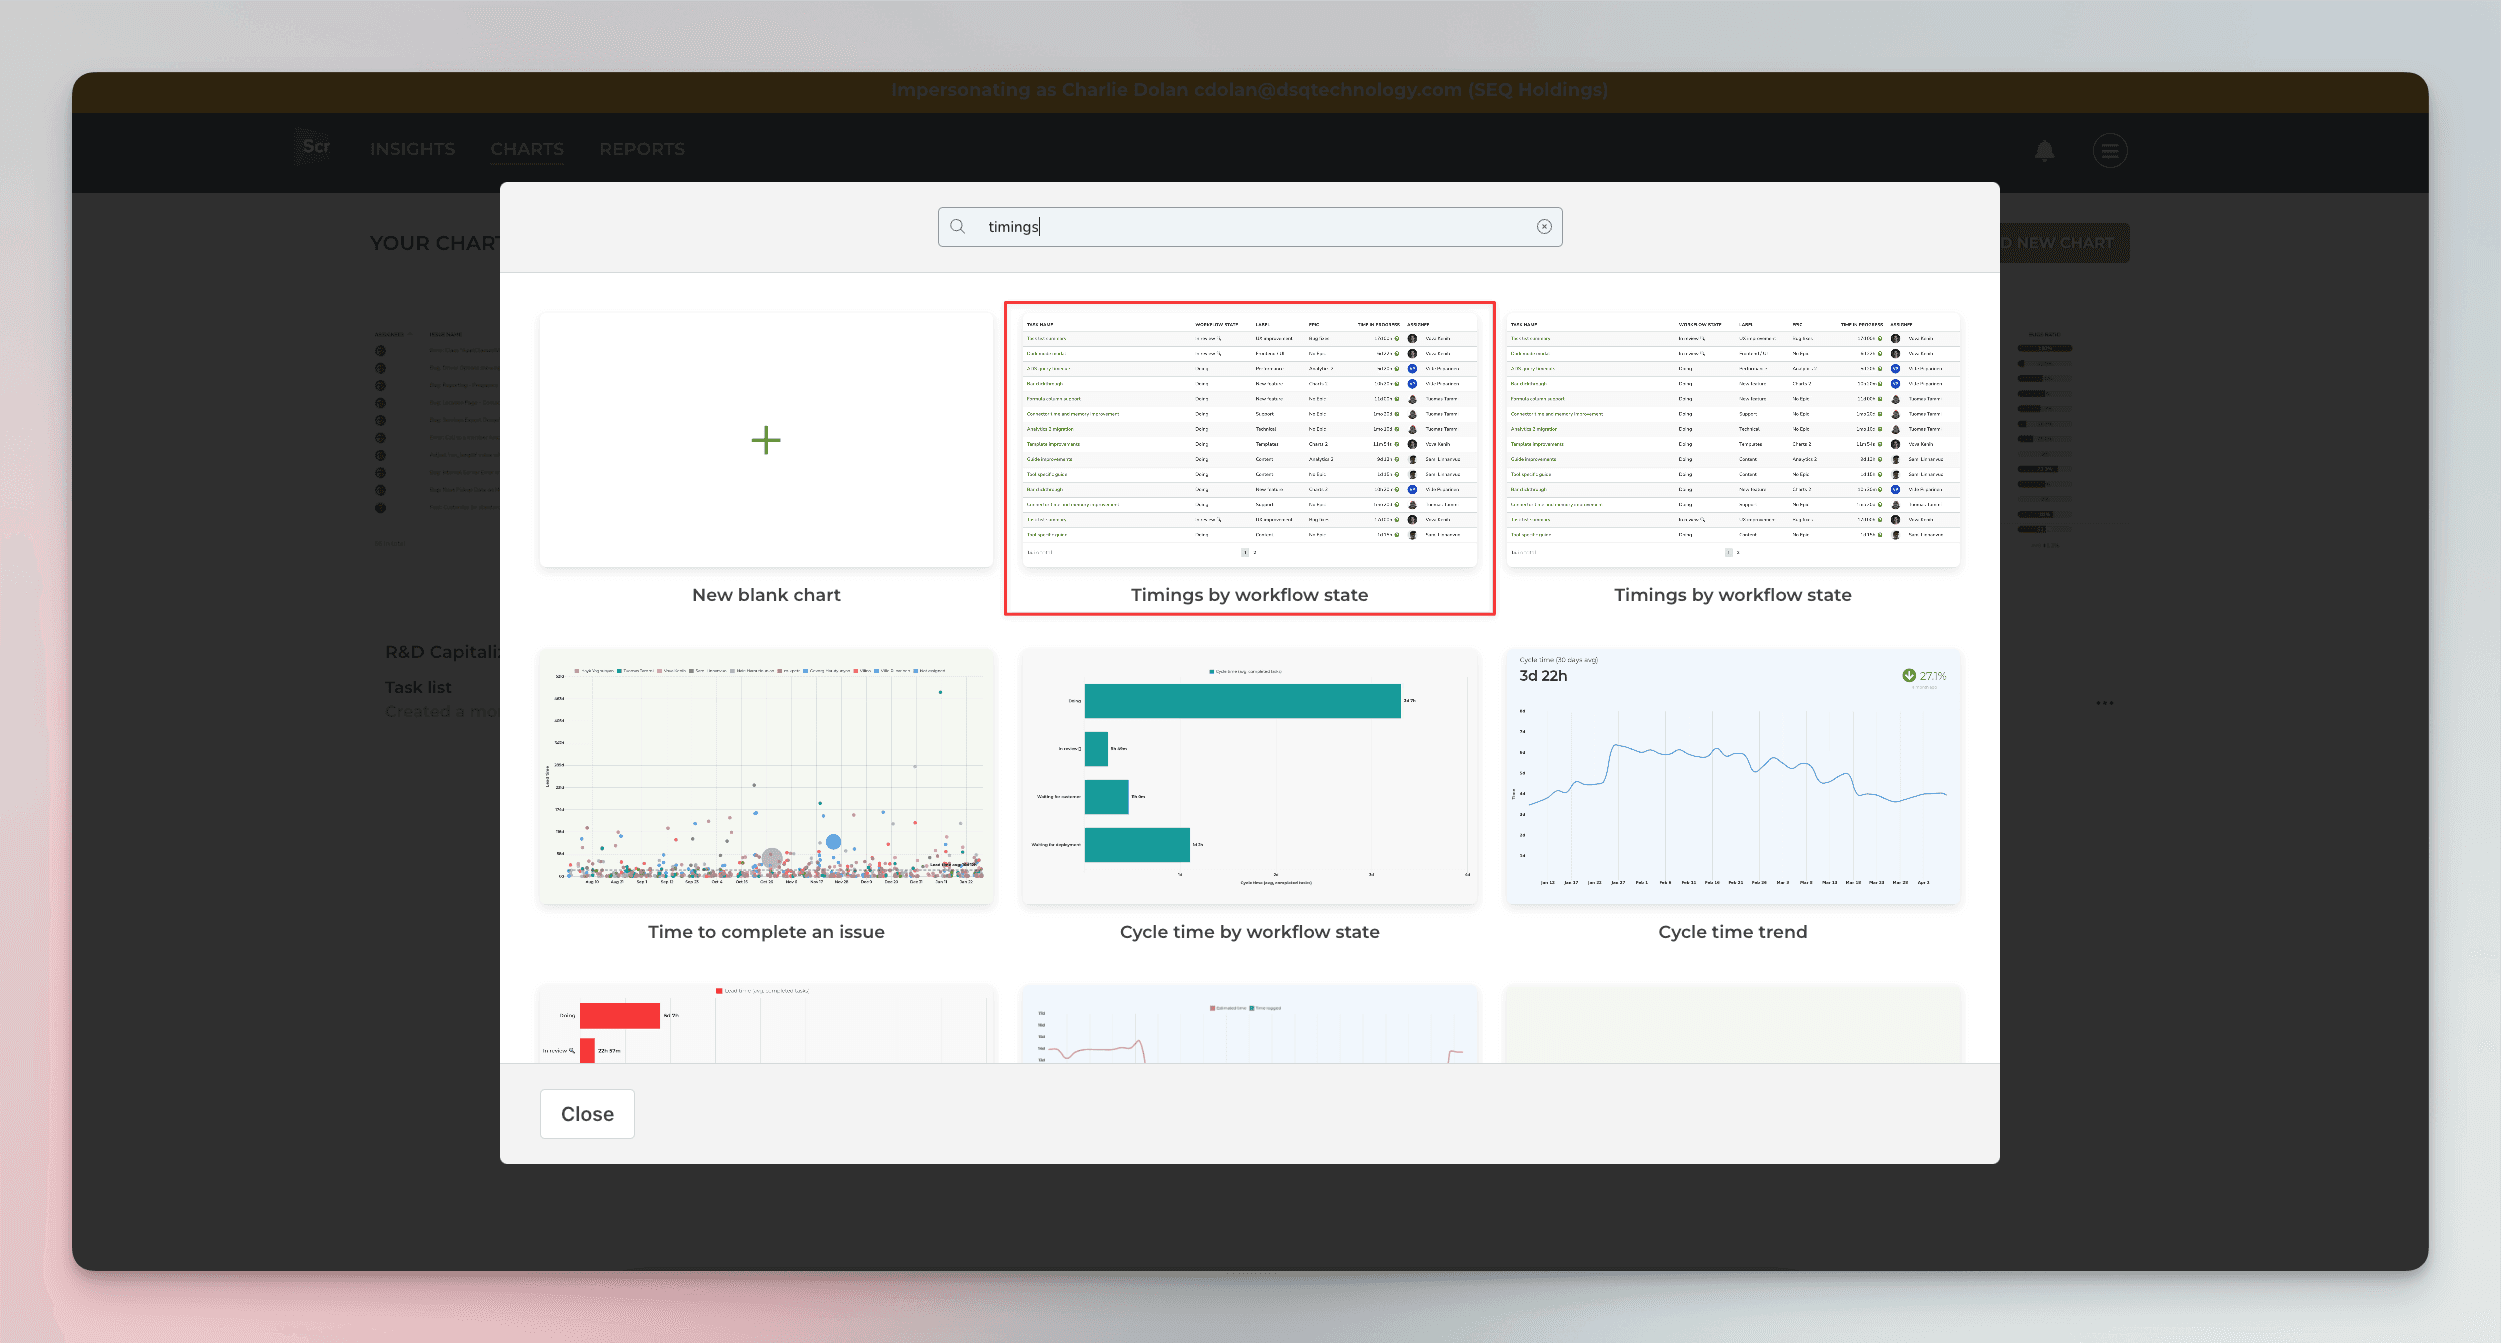
Filter the template list using the top search box. Searching "timings" shows the charts related to the timing metrics. Click the first template called Timings for work in progress:
The resulting chart shows the current items in progress and how long they've been in progress so far:
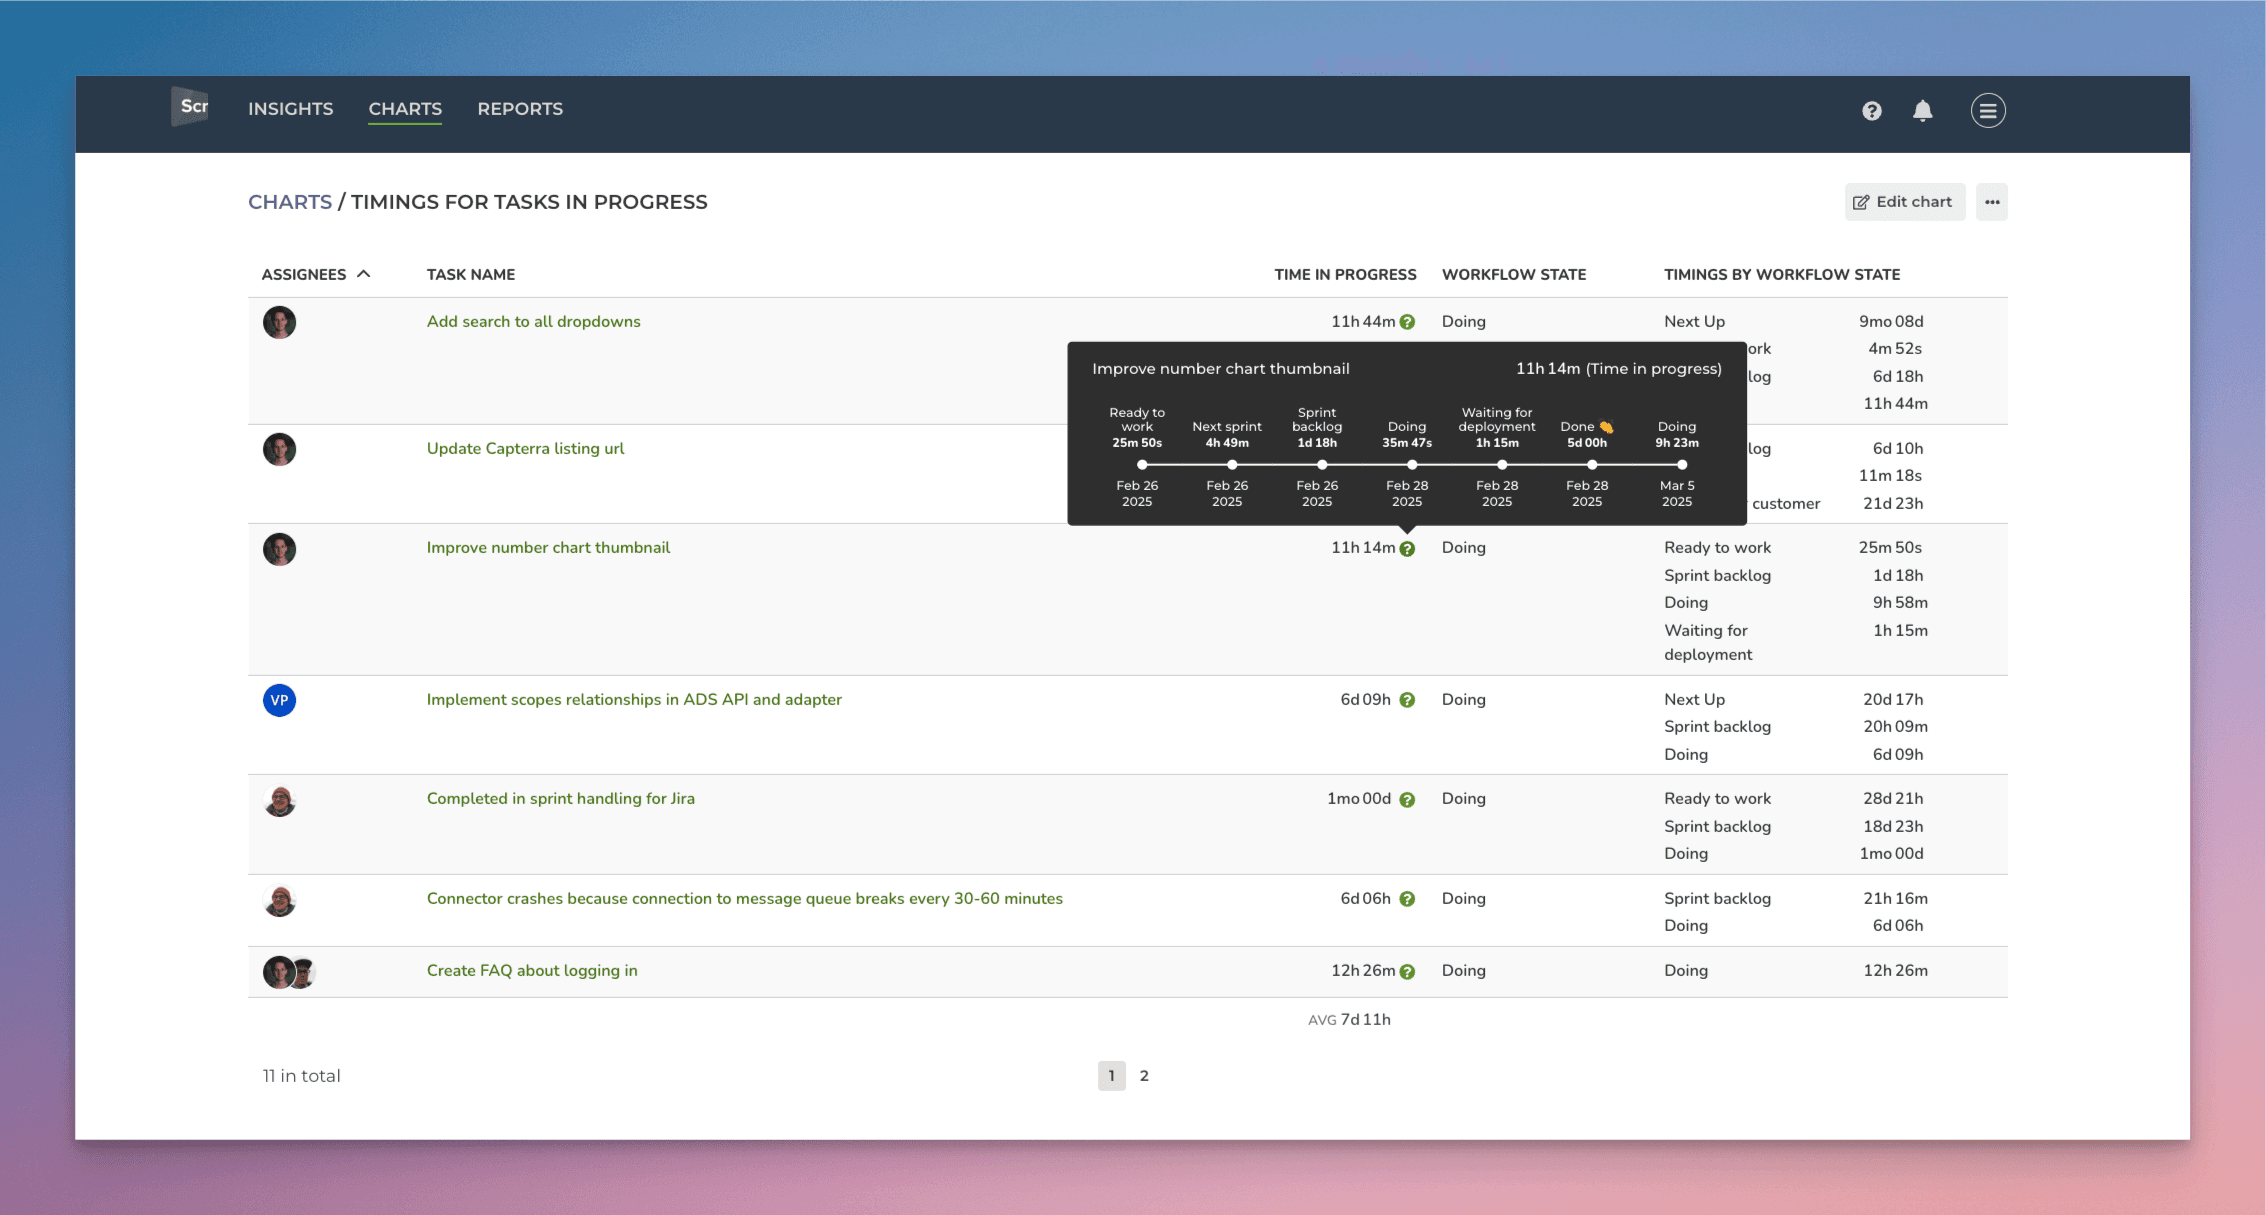
The Time in progress column shows how long ago a task was started. The summary at the bottom shows the average time in progress across all items currently in progress.

When you hover the mouse over the question mark, you see the historical movements between workflow states:
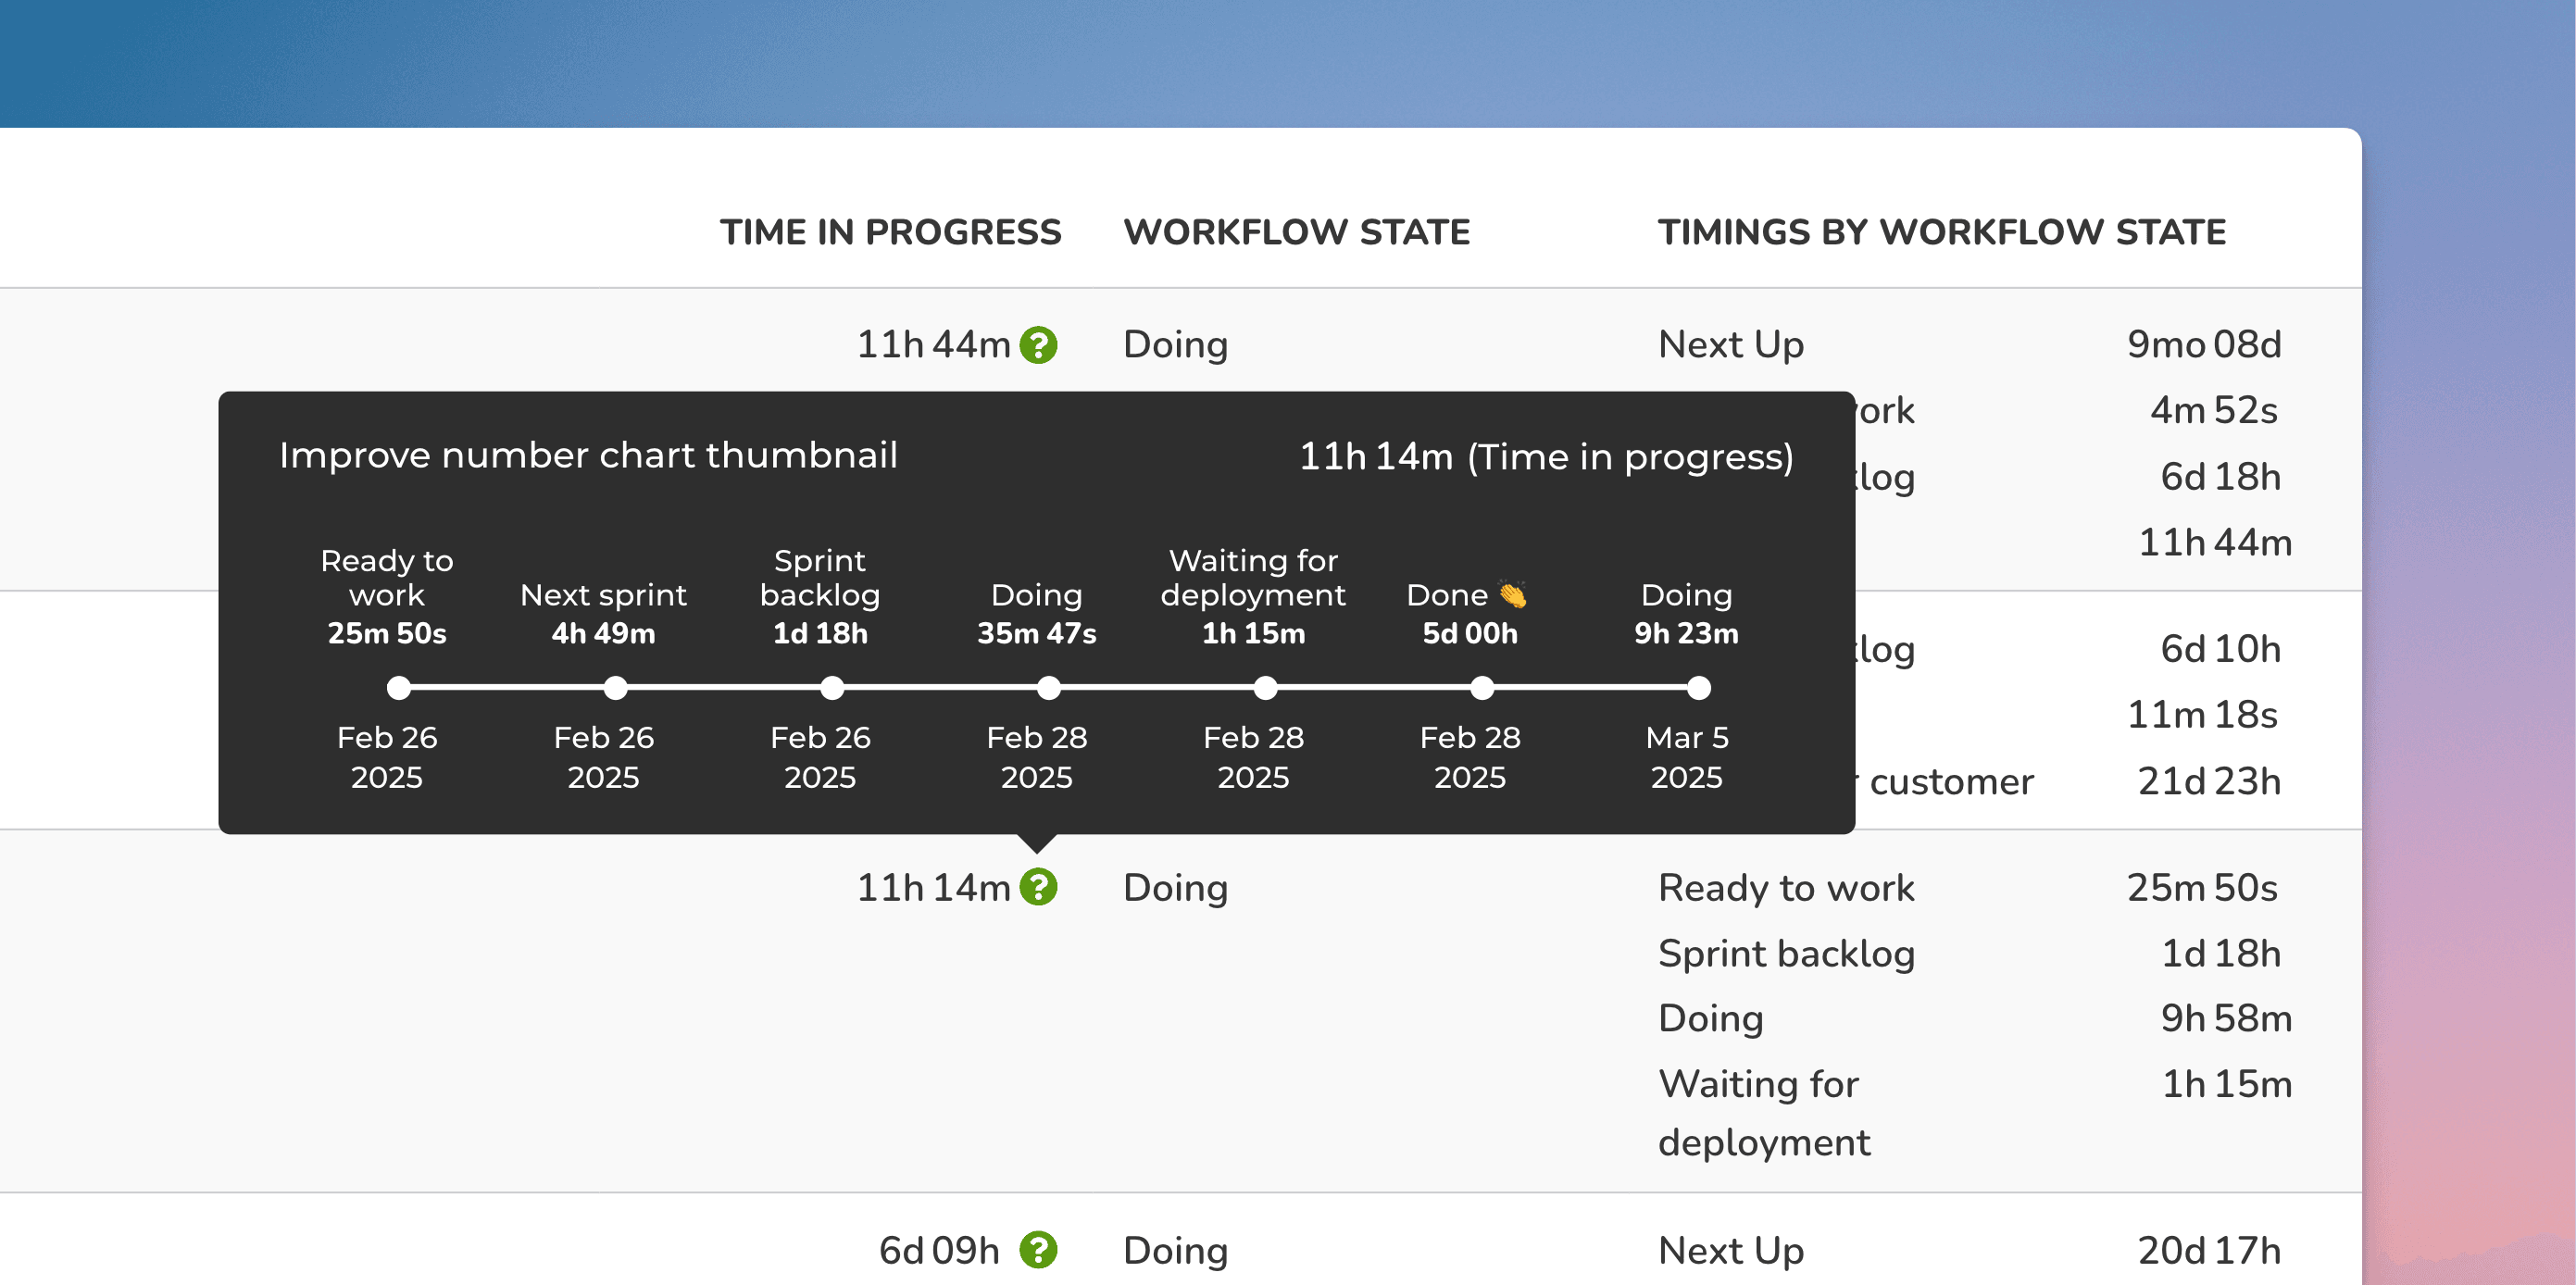
On the modal, you see all the movements between the columns in your board and how long the task stayed in that state. This view shows all the moves between the states, including the bounces backward in your workflow.
The rightmost column shows the totals per workflow state:
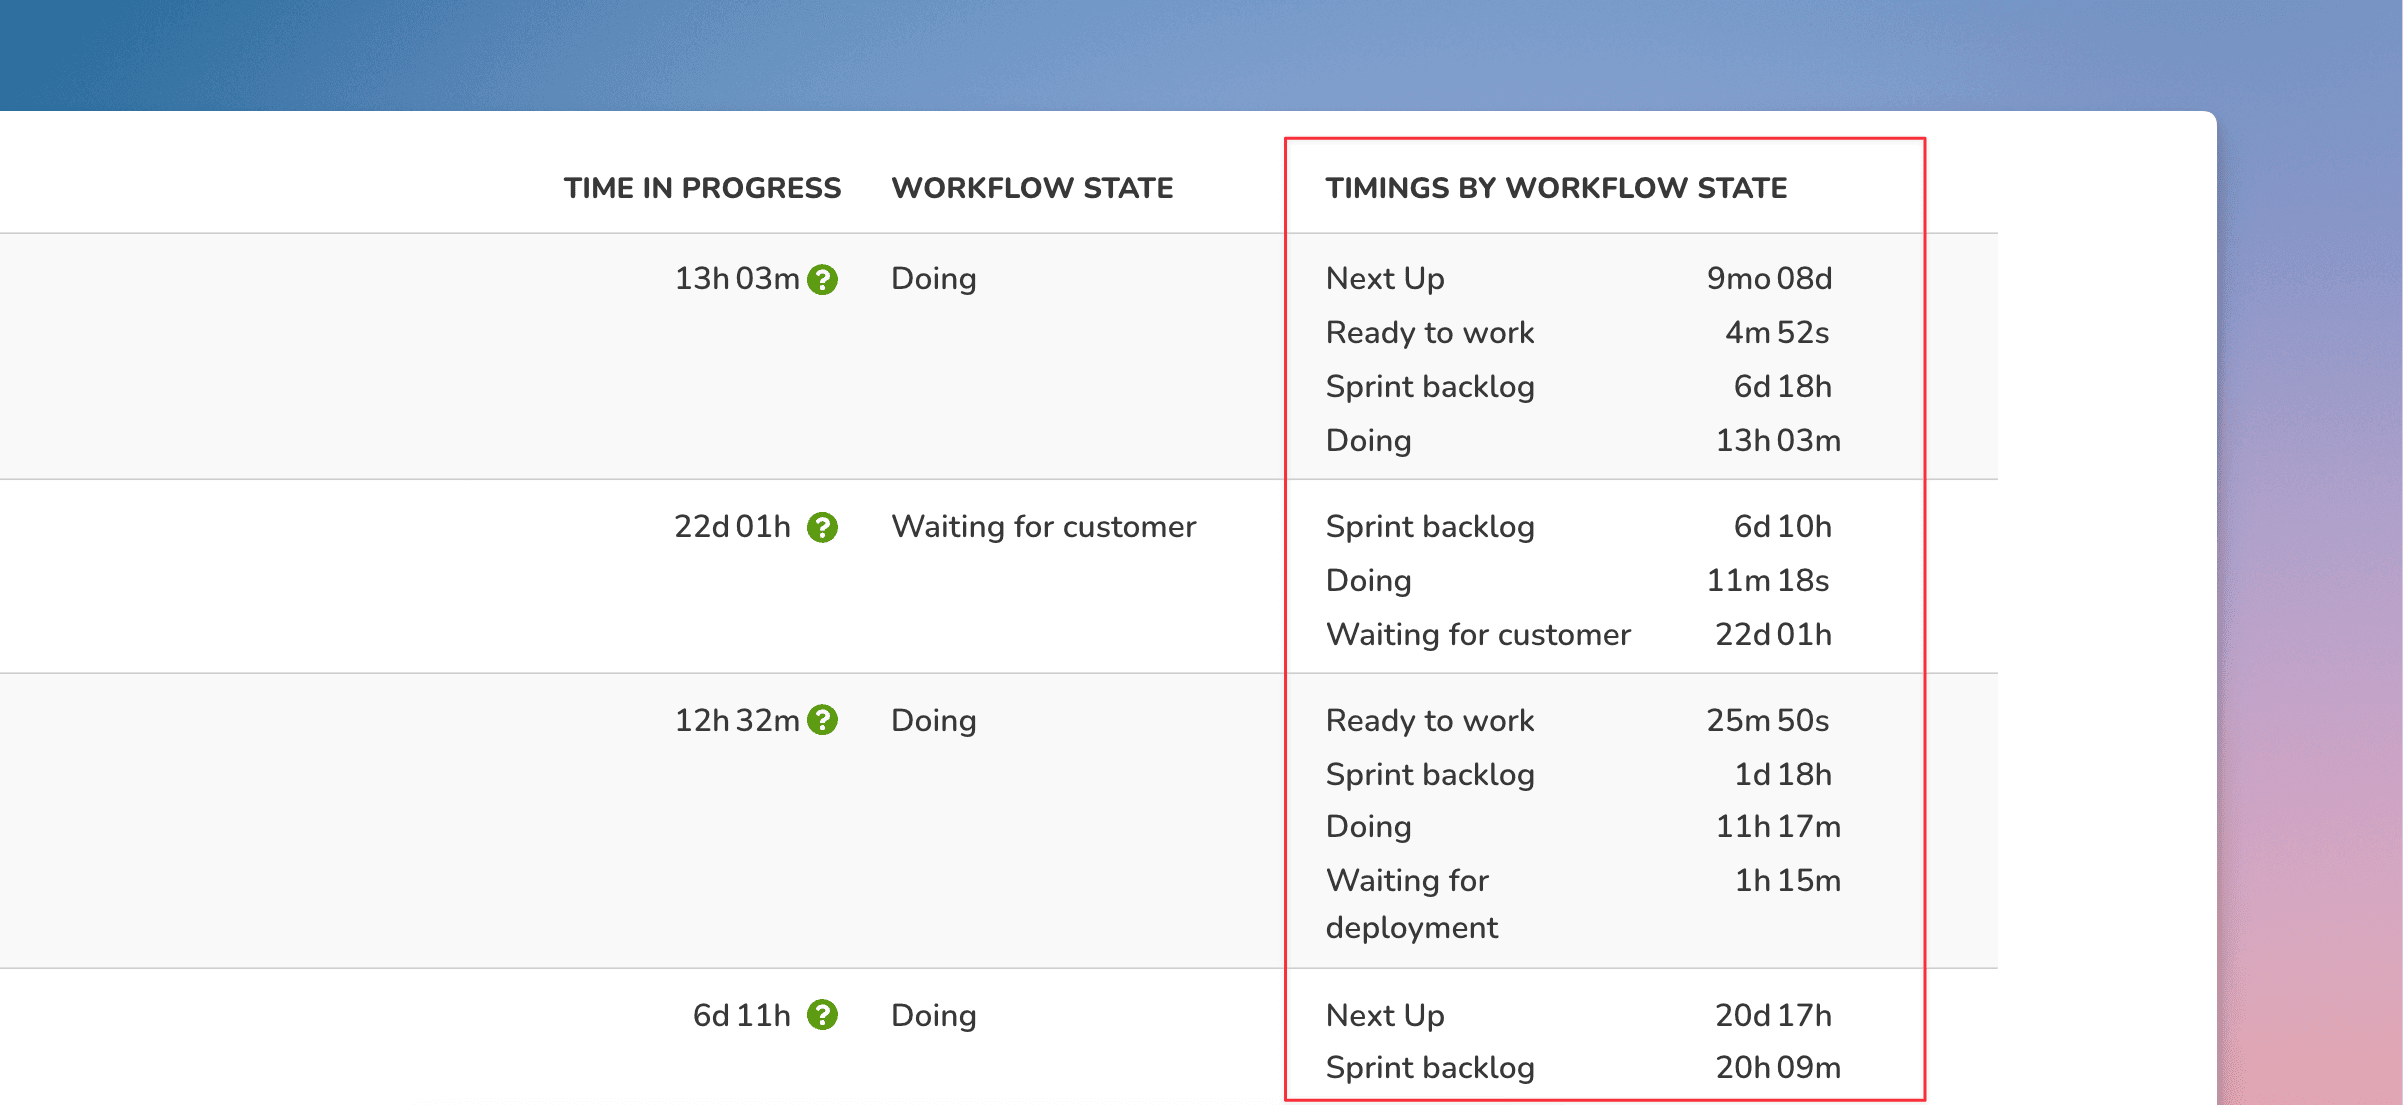
The Timings by workflow state column shows the total time the issue has spent on different states so far.
Track time in current workflow state
You can see the time spent on the current workflow state by selecting Time in workflow state as a column in a Task list:
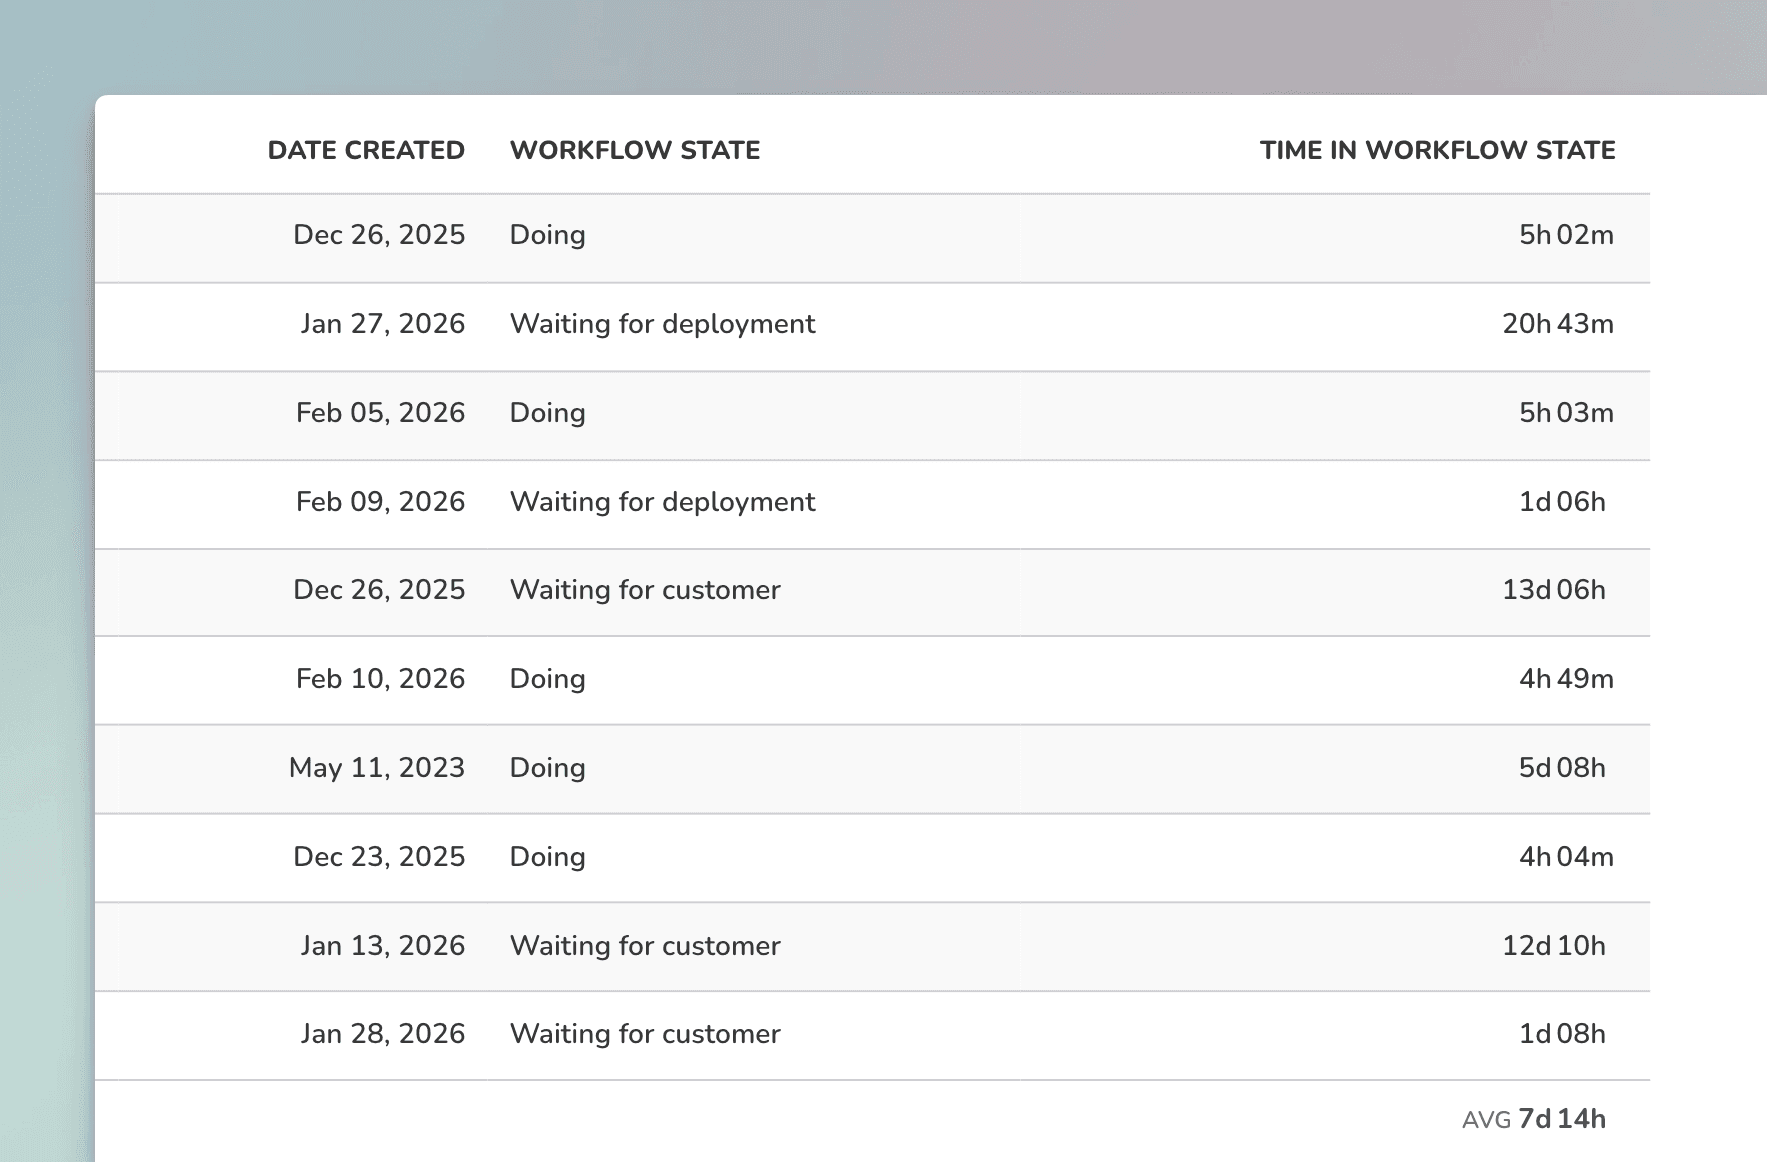
The summary at the bottom shows the average time in the workflow state for the selected items (work in progress in this example).
Filter by timings
You can filter by timings such as total time in progress (cycle time) or time in a workflow state.
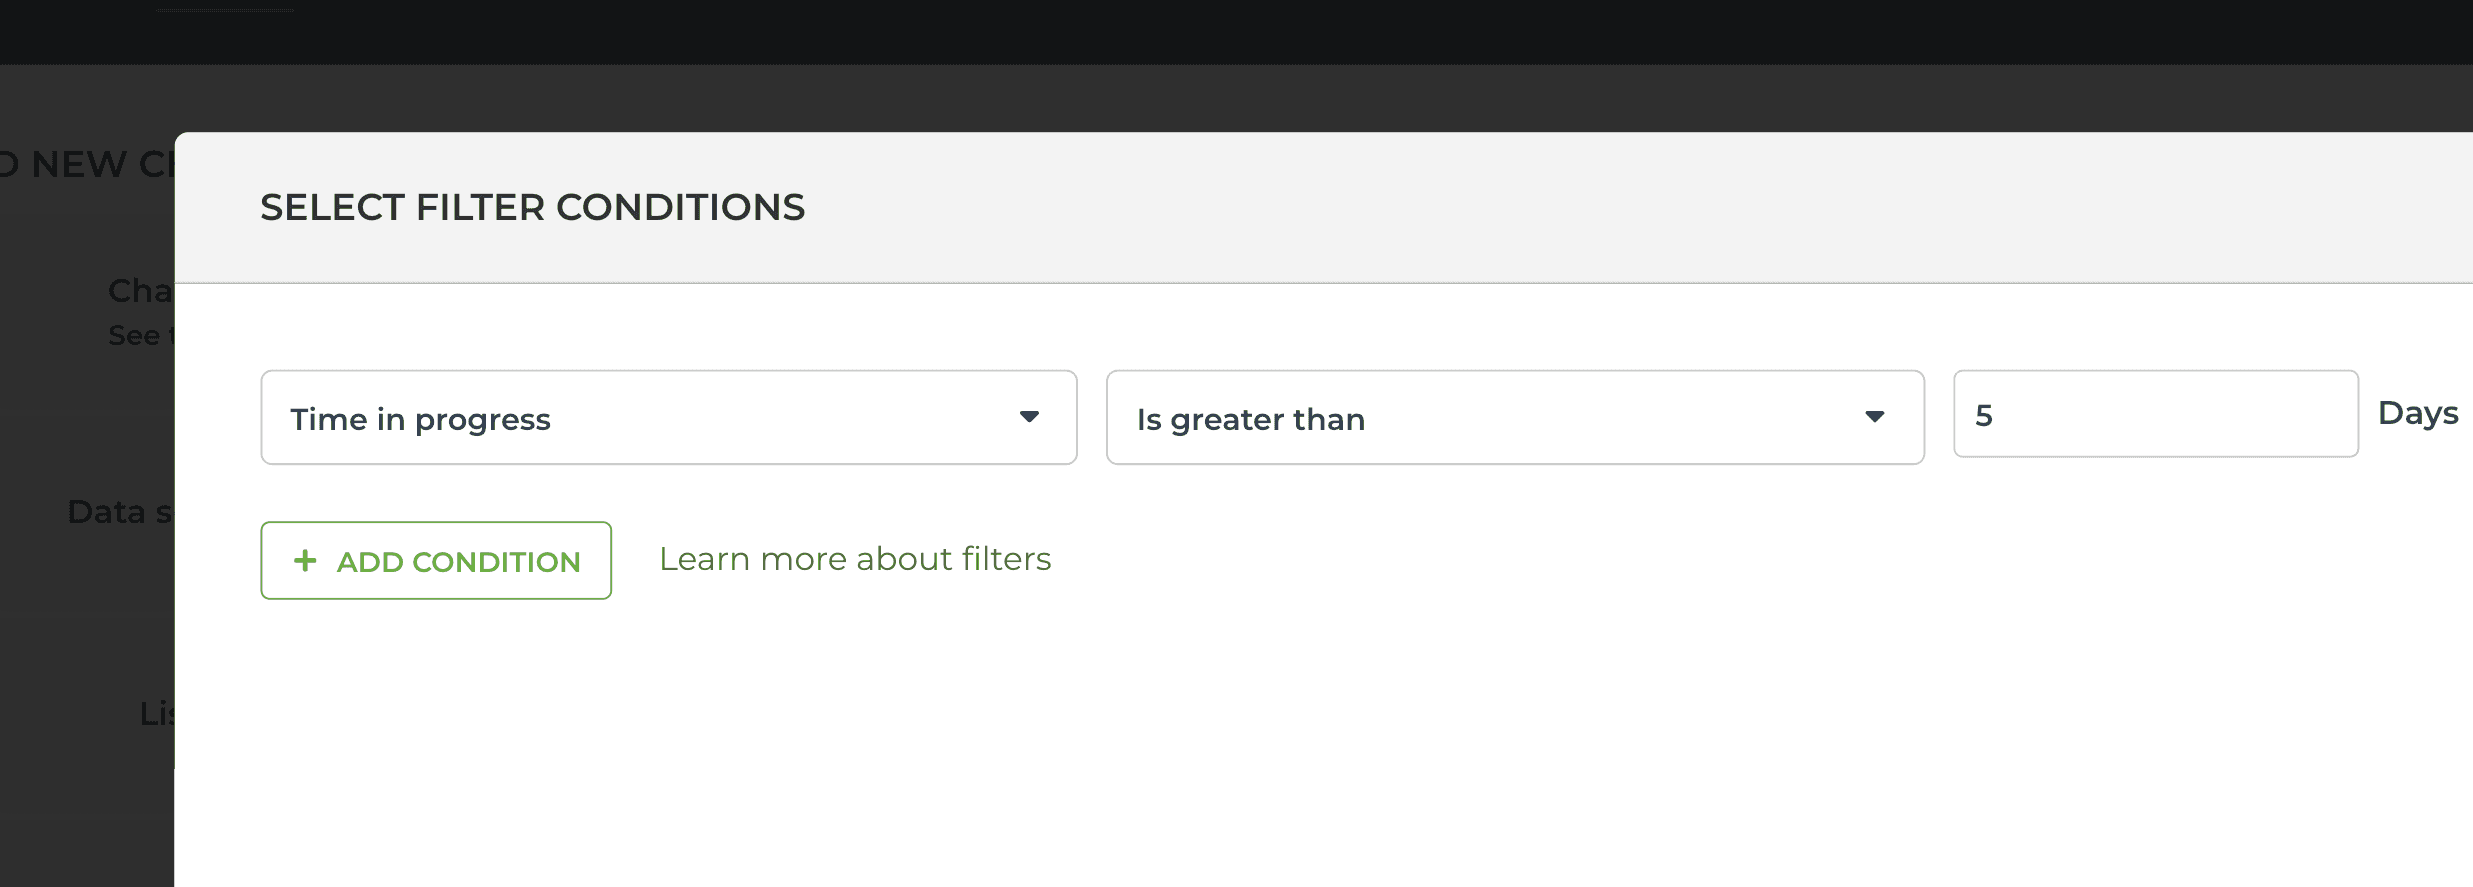
To find items that have been in progress for longer than a certain number of days, select Time in progress from the filter menu:
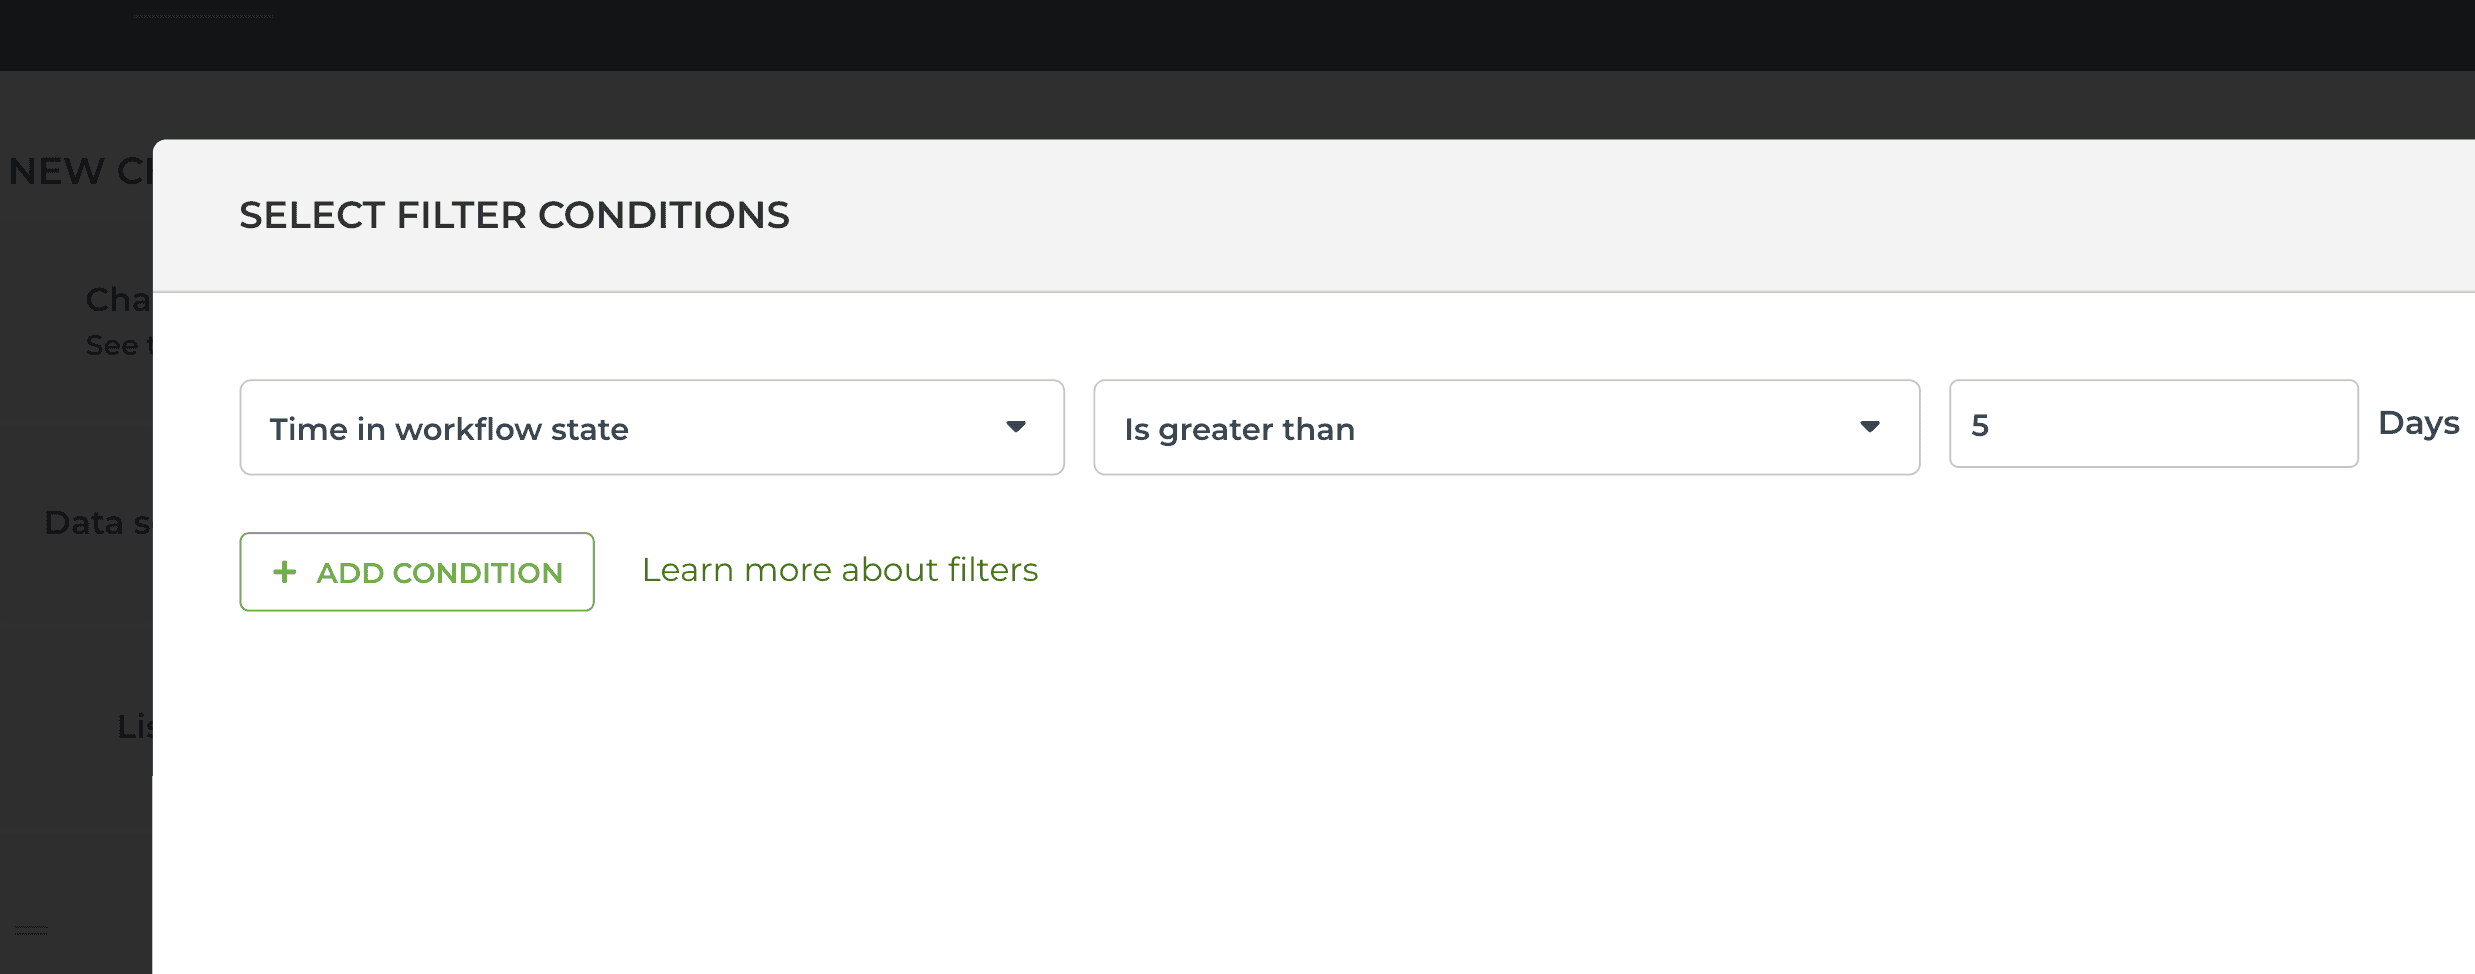
To find items that have been in their current workflow state for longer than a certain number of days, select Time in workflow state:
These filters are available in all chart types. Learn more about the timing filters.