How to add new data sources to existing dashboards?
How to add new data sources to existing dashboards?
If your tasks are scattered across several boards or projects, you may want to combine the data from multiple sources into a single chart.
If your tasks are scattered across several boards or projects, you may want to combine the data from multiple sources into a single chart.
If your tasks are scattered across several boards or projects, you may want to combine the data from multiple sources into a single chart.
Adding new data sources
You can add a new board or project to your dashboard by clicking on Add ▶ Add new data source under the main menu. If the source is not already added, click add new data source
You’ll be prompted to authorise your tool. Once you’re through the authorisation process, you get to choose which screens in your dashboard should get this new data source.
Click Save and return to dashboard to complete the process.
The newly added source is now visible. You can see that a new source has been added by looking at the upper left corner of your screen.
When you add a new data source to an existing dashboard, a new dashboard is created for that data source, and it is added as a source to the current dashboard. The new dashboard becomes available in the Dashboards menu.
New dashboards start with three months of data
When you create a new dashboard, your charts can show data up to three months in the past. As the time passes, more data will accumulate up to the limit set by your plan.
When new dashboard is created, or when you manually refresh data on an existing dashboard by clicking sync now from the main menu, a spinner icon appears at the top right corner of your dashboard:
When you hover the mouse over the spinner icons, a modal opens showing the status of the data loading process.
The icon disappears once all data sources are loaded and you charts are updated with fresh data.
Removing data sources
You can unselect a board or project that you have previously added. Make sure you are currently on the screen where the source has been selected, then go to Configure this view ▶ Sources and unselect the one(s) you want to exclude. Click Save to complete the process.
In case you want to completely remove the data source, including the dashboard that was created for that data source, just navigate to that dashboard via the Dashboards menu, and click “Remove dashboard” in the Dashboard Settings tab.
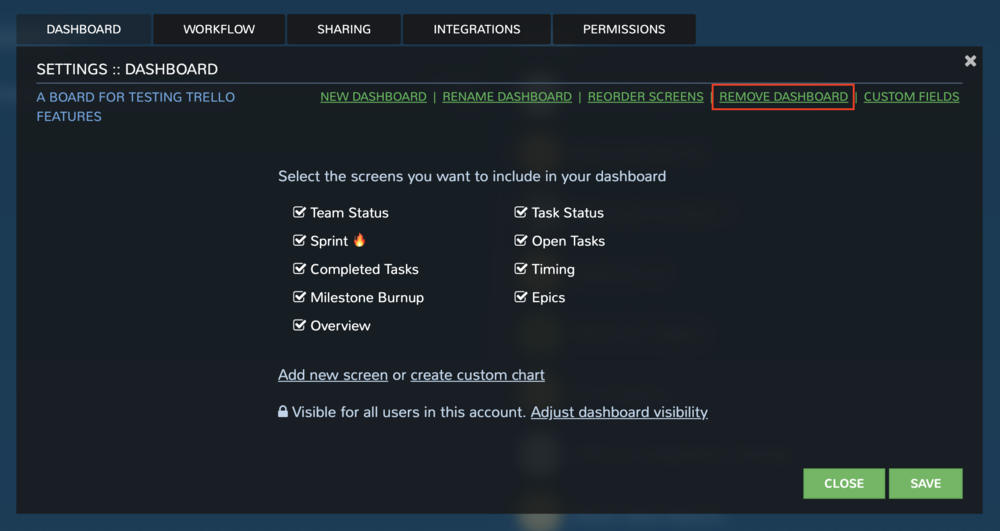
Notice that once a dashboard is removed, all its data is deleted and it cannot be recovered. You can always create a new dashboard for that same source with three months of history loaded at the time of creation.
Removing data sources
You can unselect a board or project that you have previously added. Make sure you are currently on the screen where the source has been selected, then go to Configure this view ▶ Sources and unselect the one(s) you want to exclude. Click Save to complete the process.
In case you want to completely remove the data source, including the dashboard that was created for that data source, just navigate to that dashboard via the Dashboards menu, and click “Remove dashboard” in the Dashboard Settings tab.
Notice that once a dashboard is removed, all its data is deleted and it cannot be recovered. You can always create a new dashboard for that same source with three months of history loaded at the time of creation.