Pie chart
The Pie chart can be used for showing part-to-whole relationship in your data. The slices in the pie represent percentages of the total.

Use pie chart to show the percentages of the whole
The Pie chart can be used for showing part-to-whole relationship in your data. The slices in the pie represent percentages of the total. The center of the chart displays the sum of values.

Use advanced filters to select the items for the chart
You can filter by any property, such as task type (bug, user story, new feature), assignee, label, or epic.
You can set comparison filters by any of your number fields or date fields, or filter by keywords with an exact or partial match.
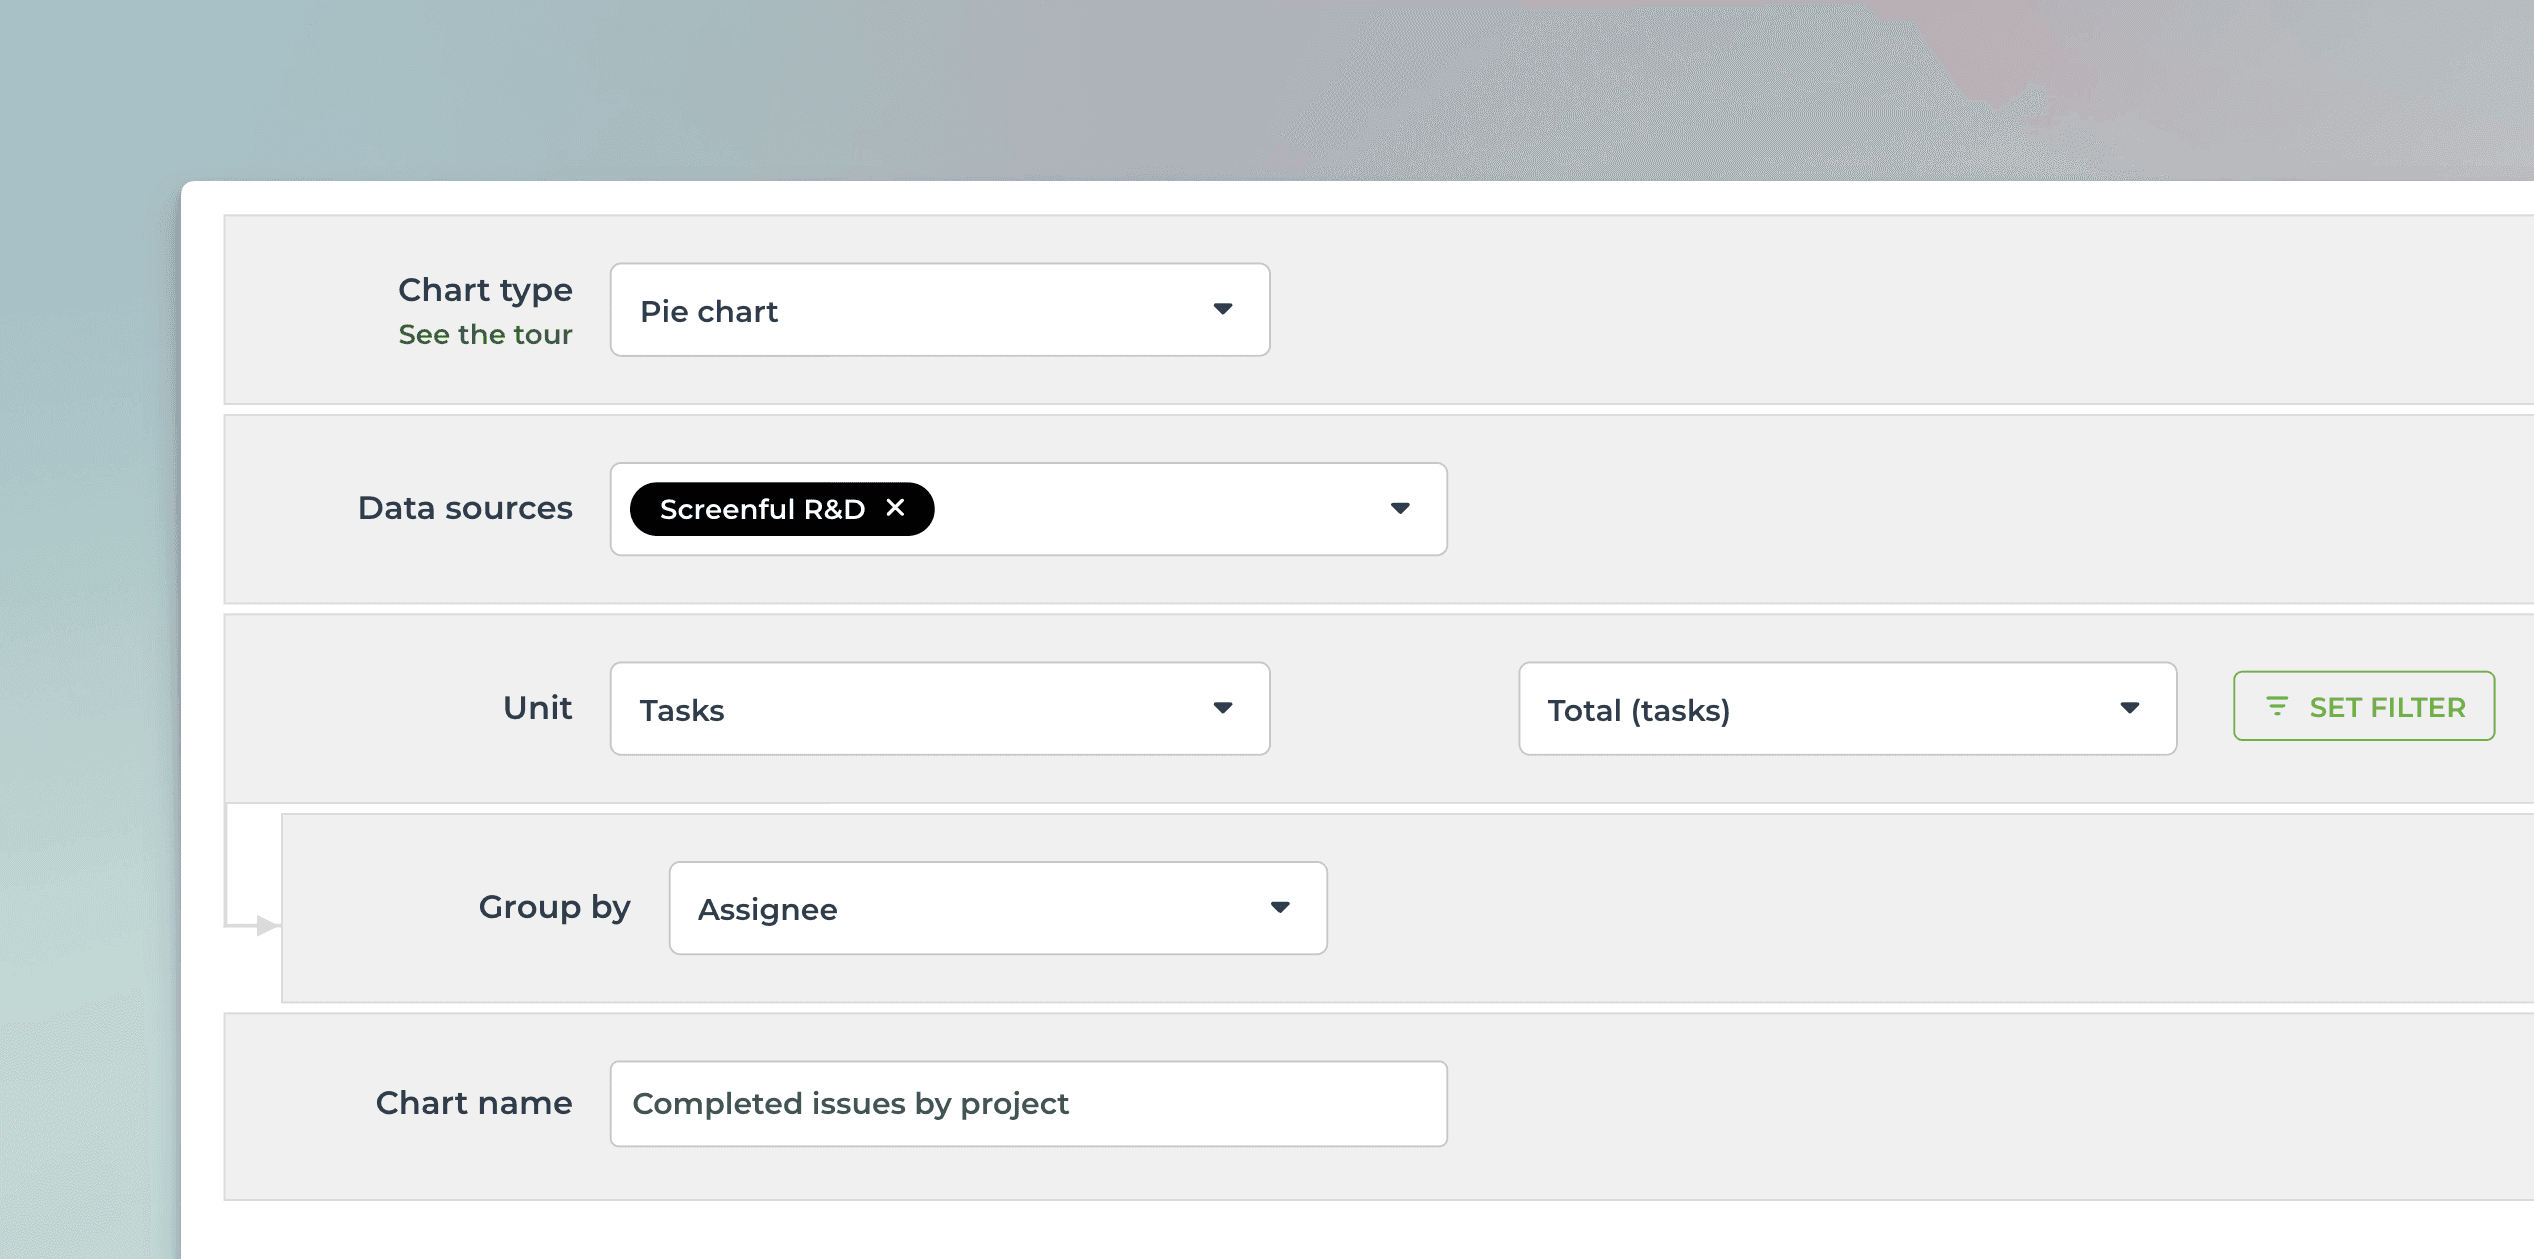
Create from template and customize
You can create this chart with just a few clicks using a template. Customize it to your liking with the chart editor.
Use data from any of your custom fields
Rename labels to your liking
Set the format of the numbers (currency, number format)
Select light mode or dark mode


