
Introducing Analytics & Reports for ClickUp
Feb 4, 2026
We are happy to inform you that we now support ClickUp in our analytics. You can import ClickUp data sources and use them in your Screenful charts and reports. Learn more at screenful.com/clickup.
Contents:
Create custom charts using data from ClickUp
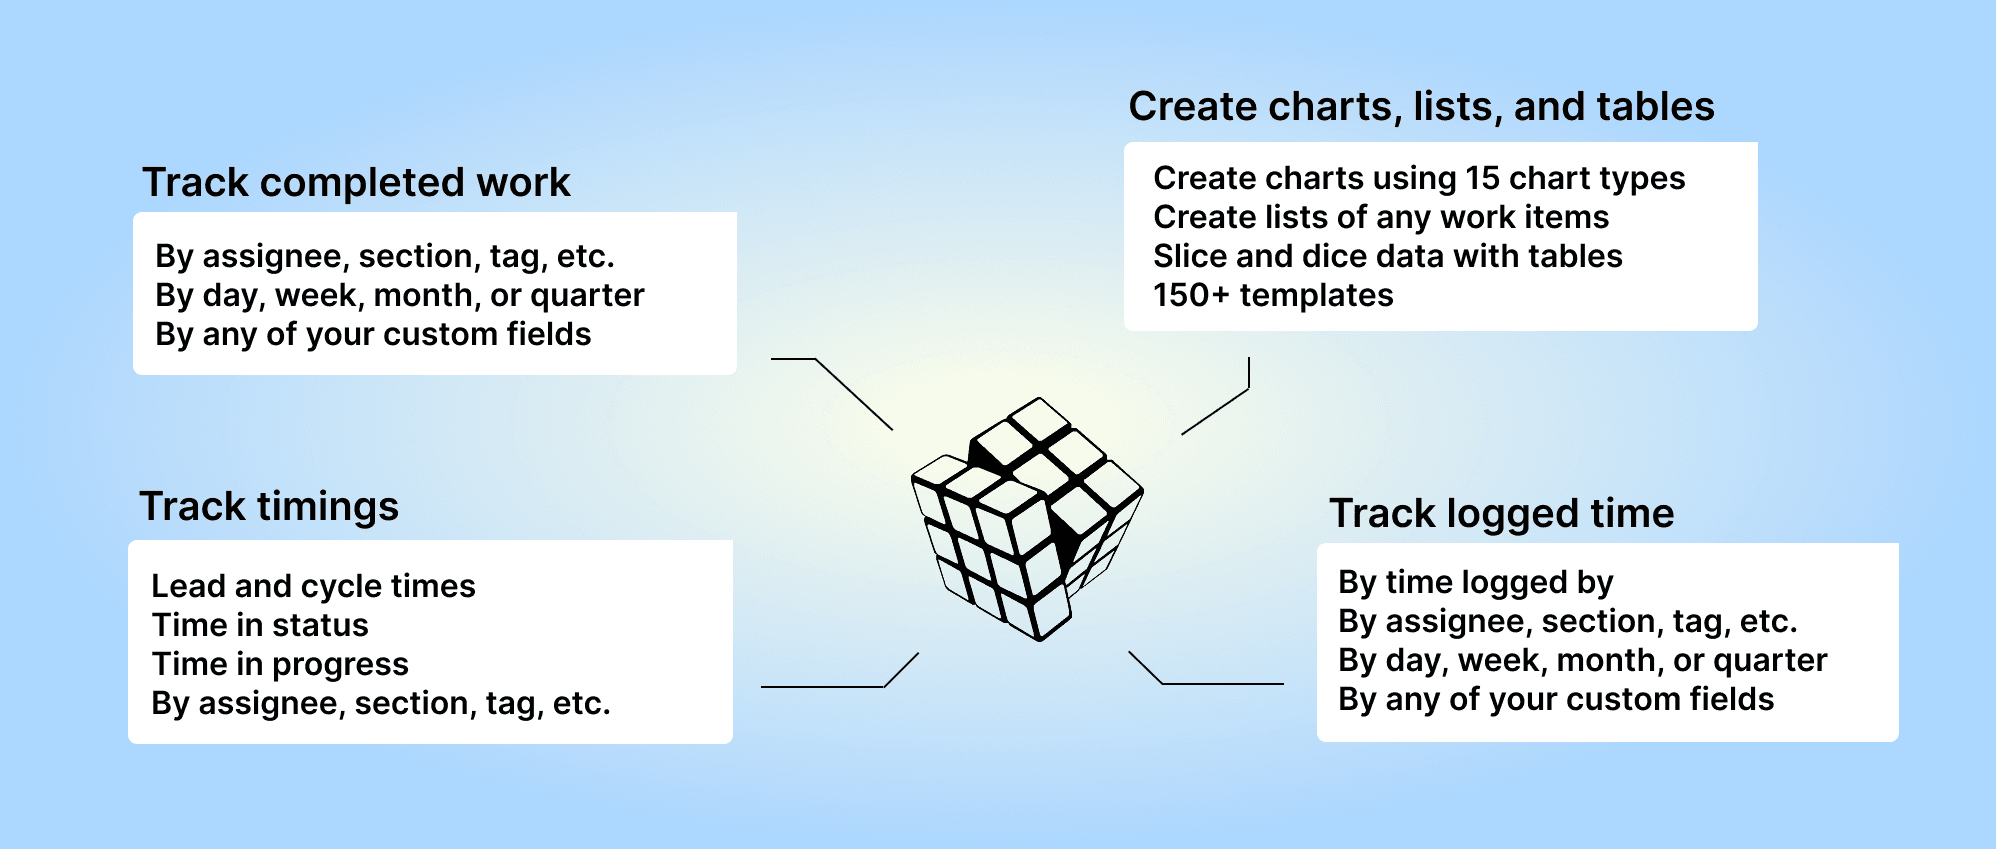
Slice and dice your data with 15 chart types. Create advanced charts and track metrics by any of your custom fields. Learn more about the 15 chart types
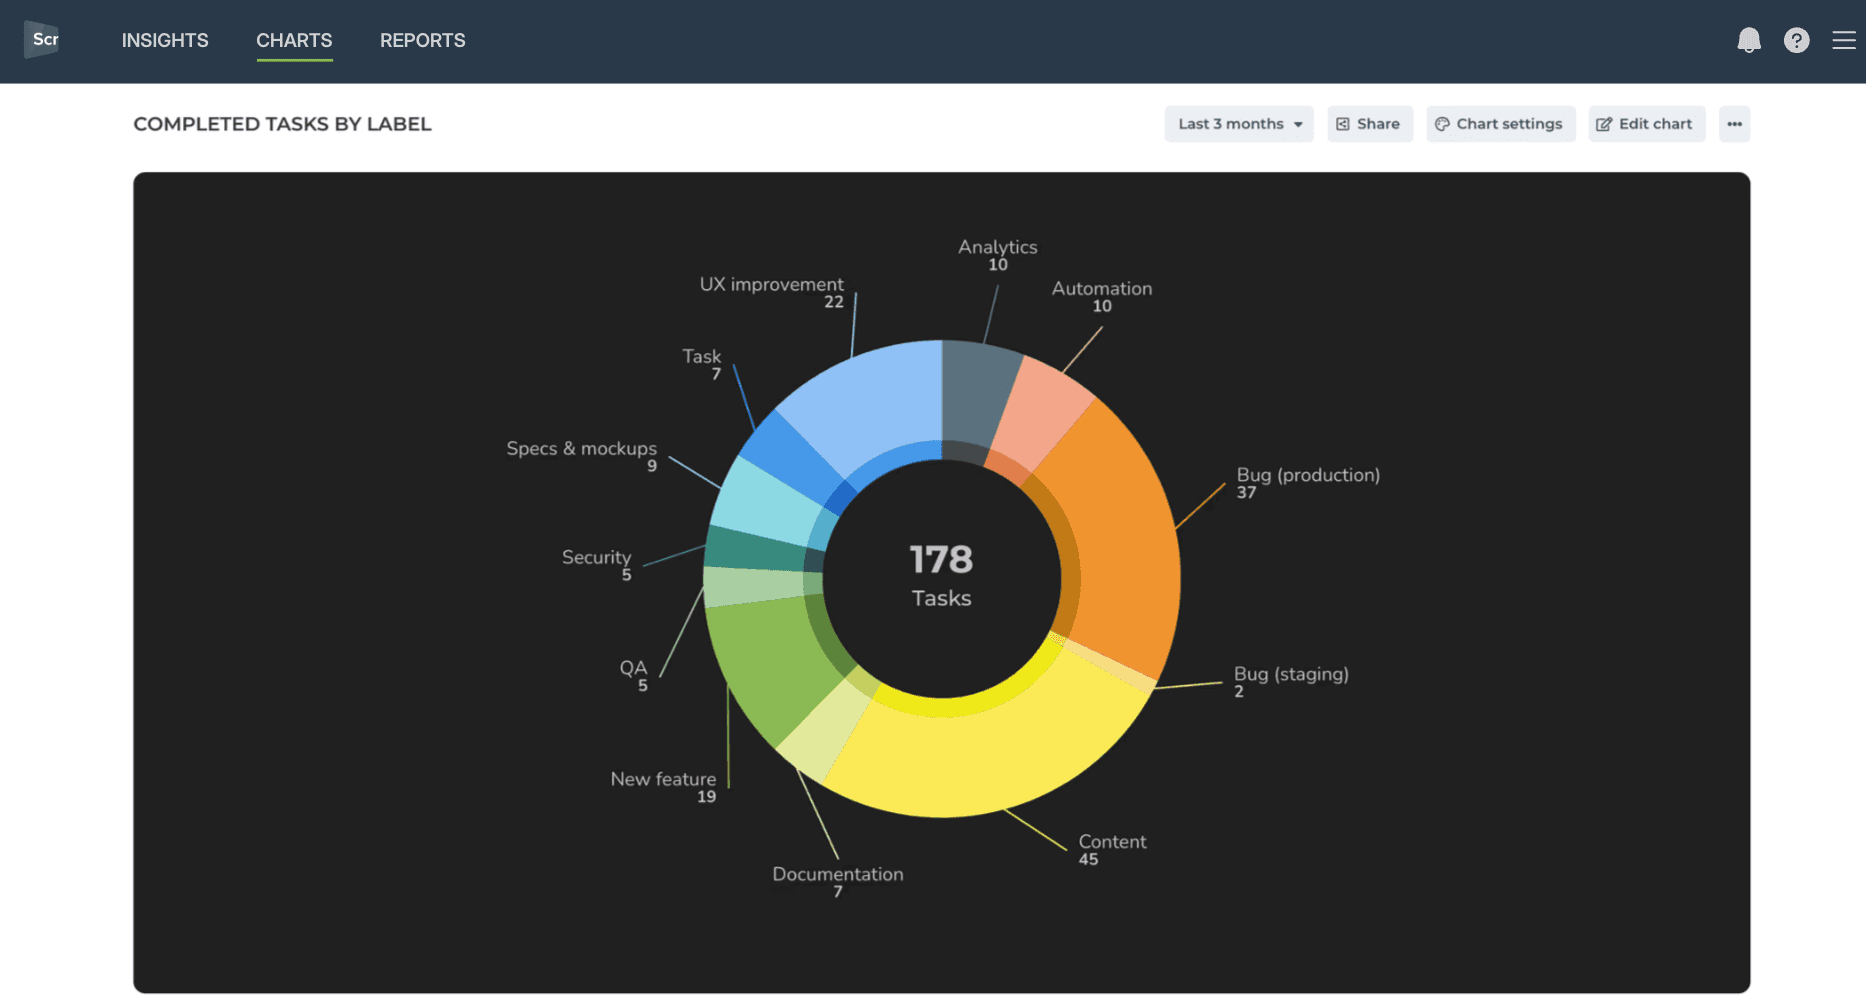
You can create charts with the chart editor, or select from 100+ chart templates that cover all aspects of your task management:
Team velocity
Custom fields
Time tracking
Estimated revenue
etc.
You can also track Advanced metrics not available in ClickUp's native reporting. All metrics mentioned in this guide are available in all Screenful pricing tiers.
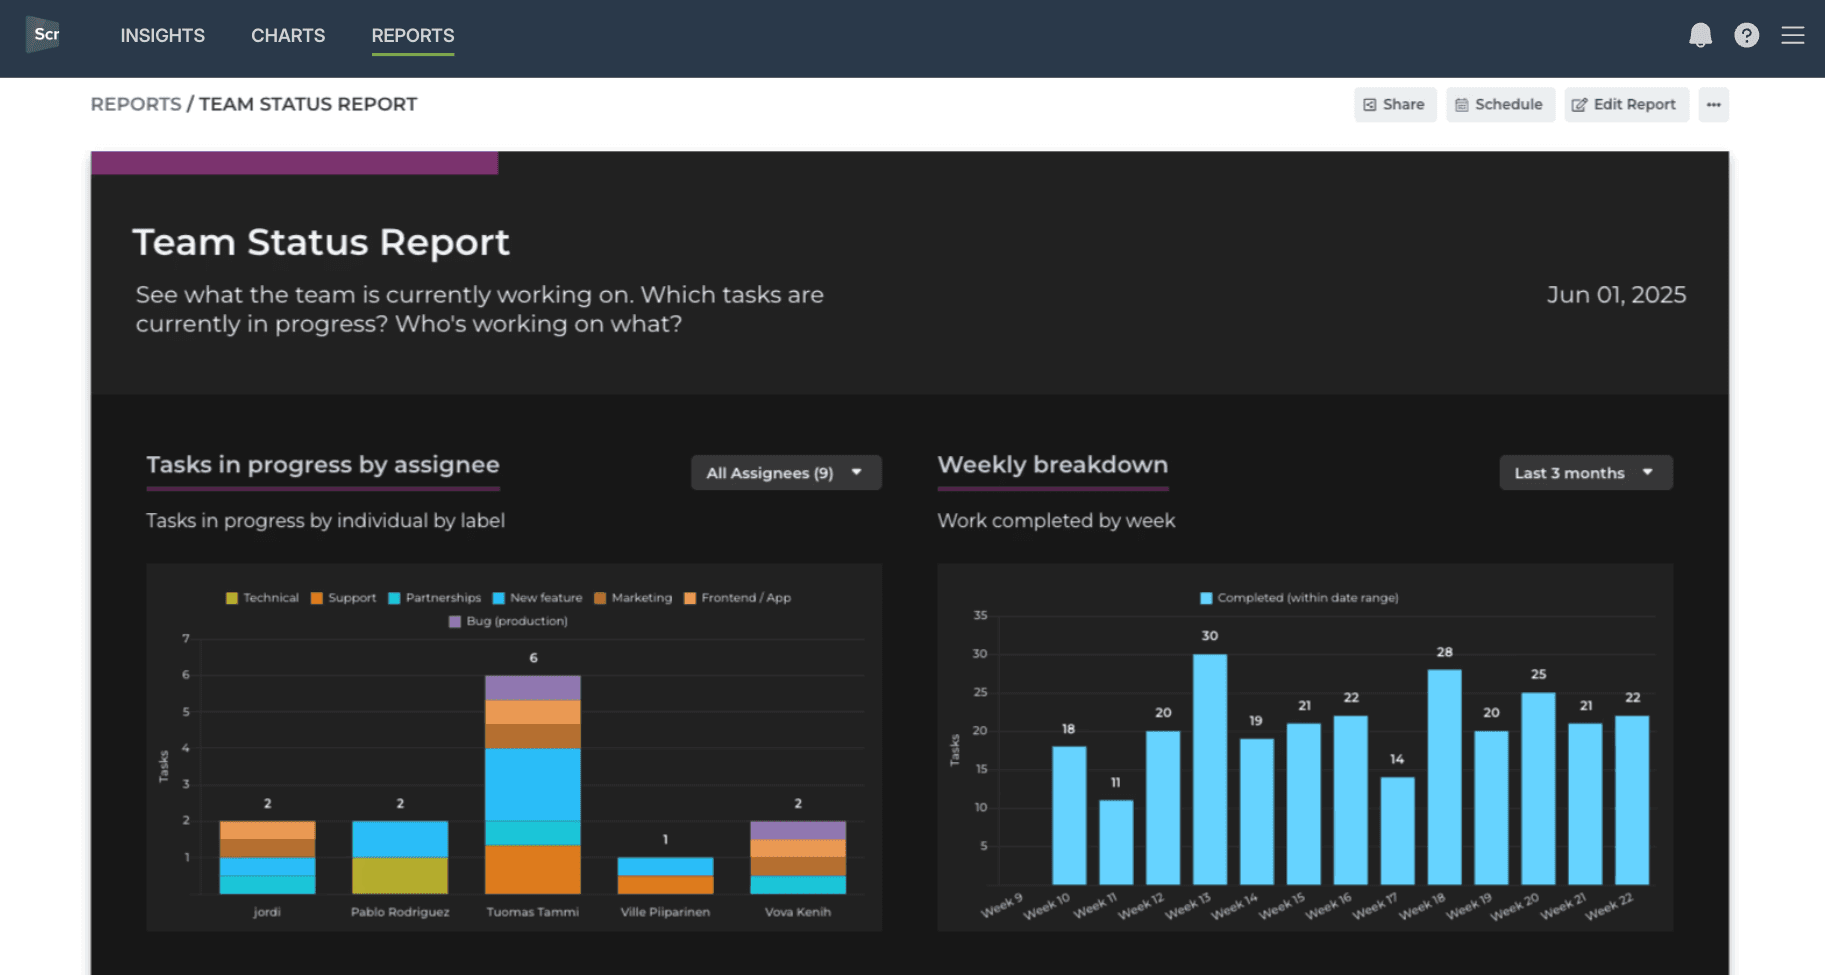
Schedule automated reports
Combine charts into reports. Share with a link or schedule reports to be sent via email or Slack.
Schedule reports to selected recipients:
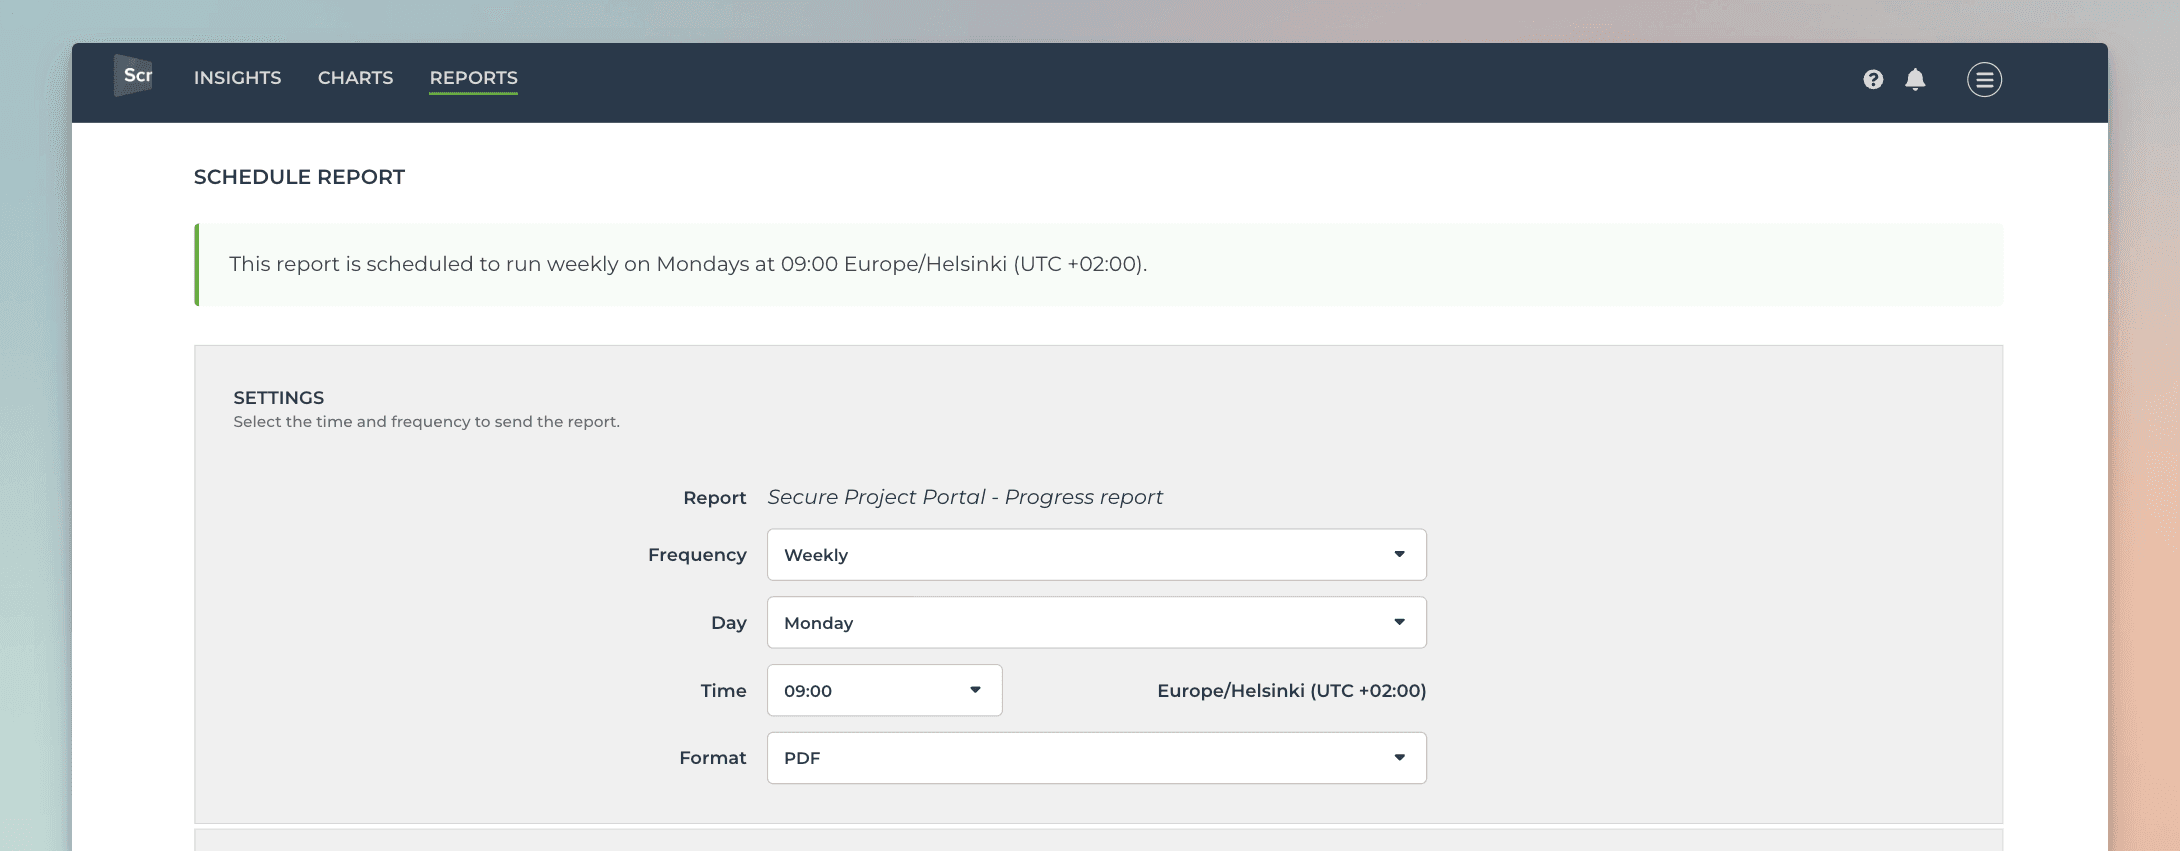
Once the schedule is saved, the report will be emailed to the selected recipients according to the set schedule. The message contains a link to the live report online, and the PDF export as an attachment.
Meet the AI assistant
The AI assistant can be launched from the charts modal by clicking the Ask AI button on the top right corner:
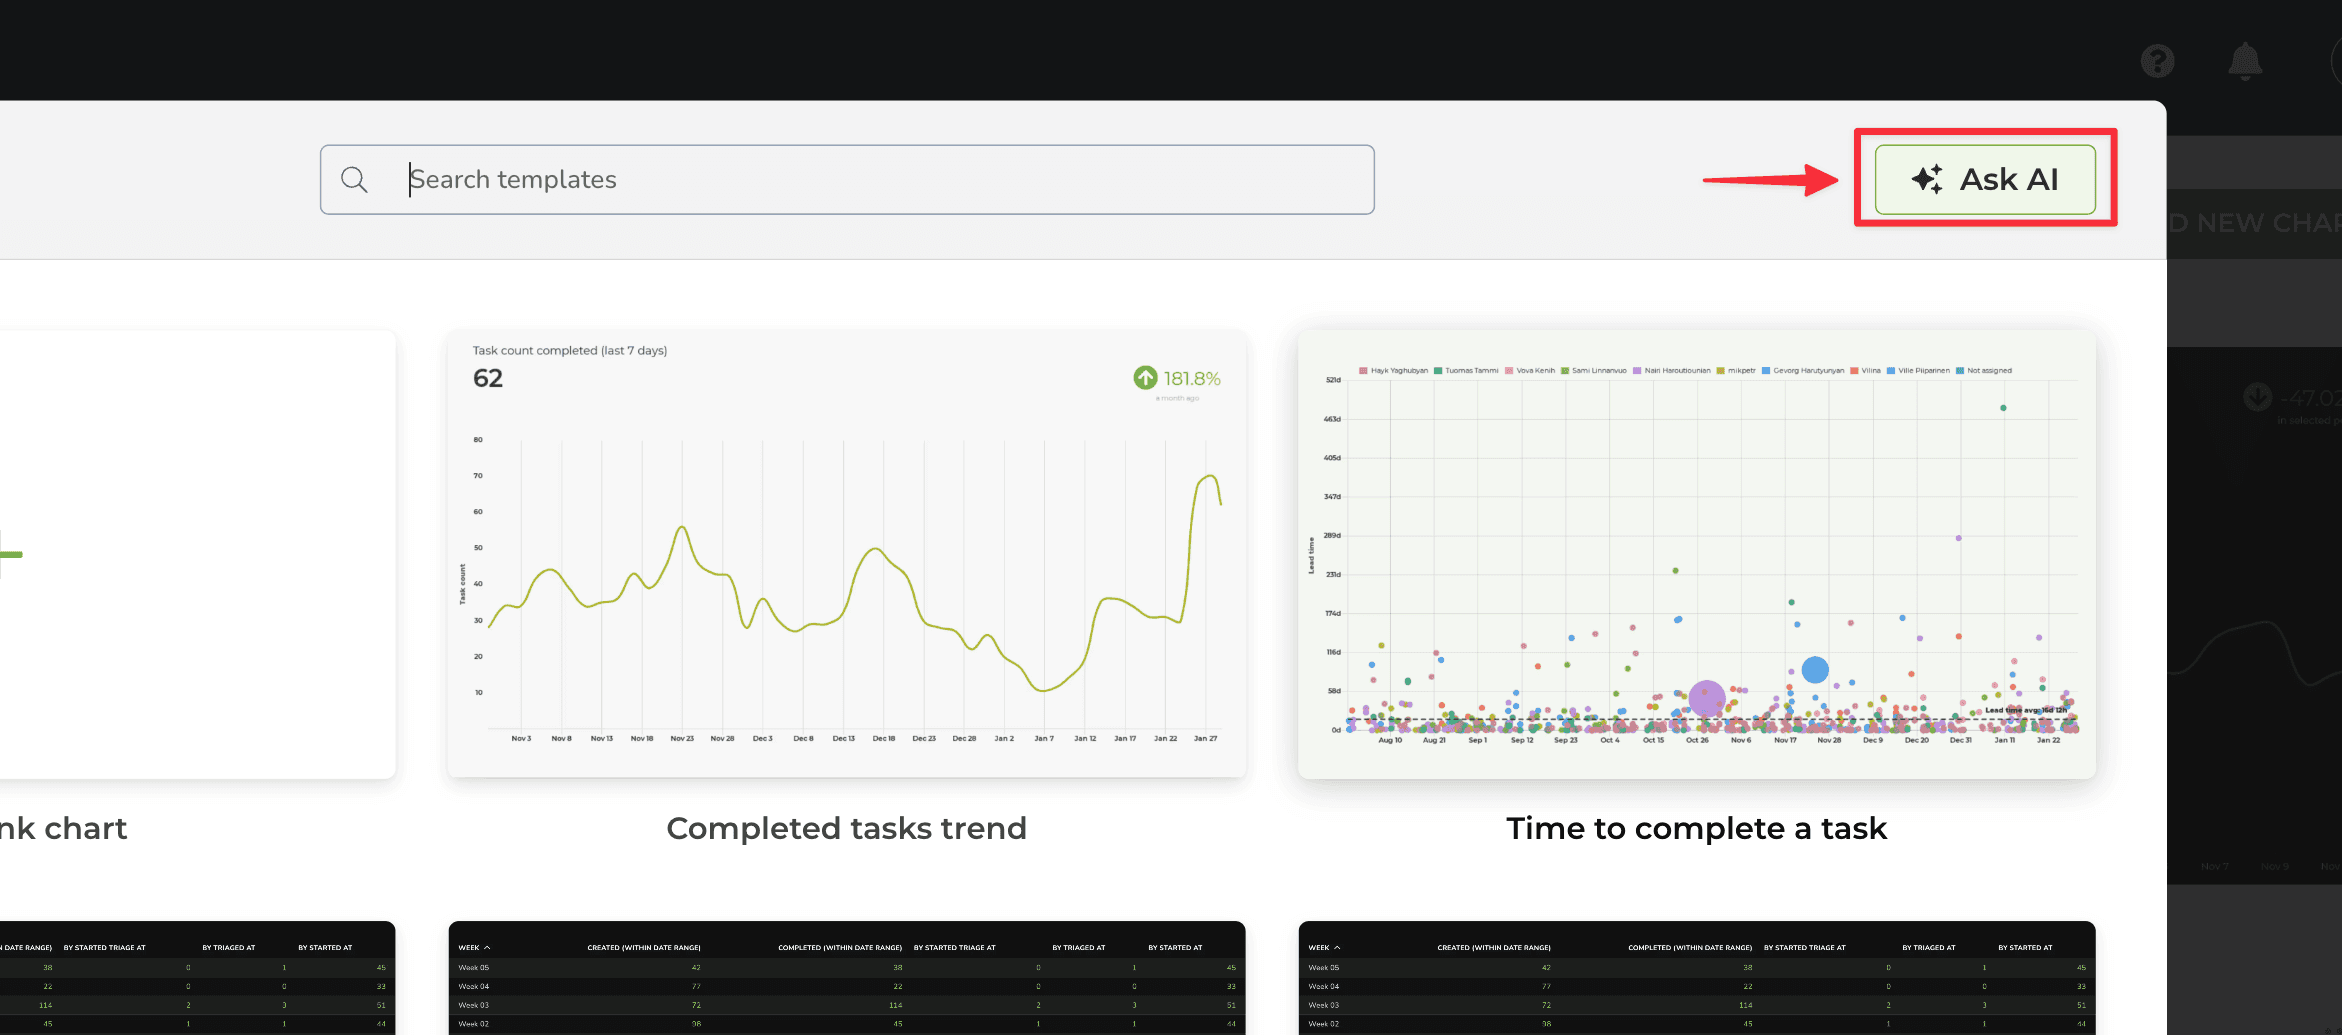
A chat view opens, and you can start chatting with the assistant. You can create a chart by describing it in natural language (any language). You can ask questions like
"Show me task completed this month grouped by label"
"Compare weekly sales numbers in the last 3 months"
"How long does it take for our team to complete a task on average?"
The assistant adjusts the chart according to your request. You can always undo the latest change and try again with a different prompt.
At any time, you can open the chart for editing by clicking Edit below the chart. With the editor, you can change the unit, select metric, set filters, and grouping, and adjust the date range.
Clicking Save below the chart saves it, and you can find it in the Charts tab.
Integrating Screenful with ClickUp
To create a data source using data from ClickUp, select Add new data source from the main menu. Then select ClickUp from the available options:
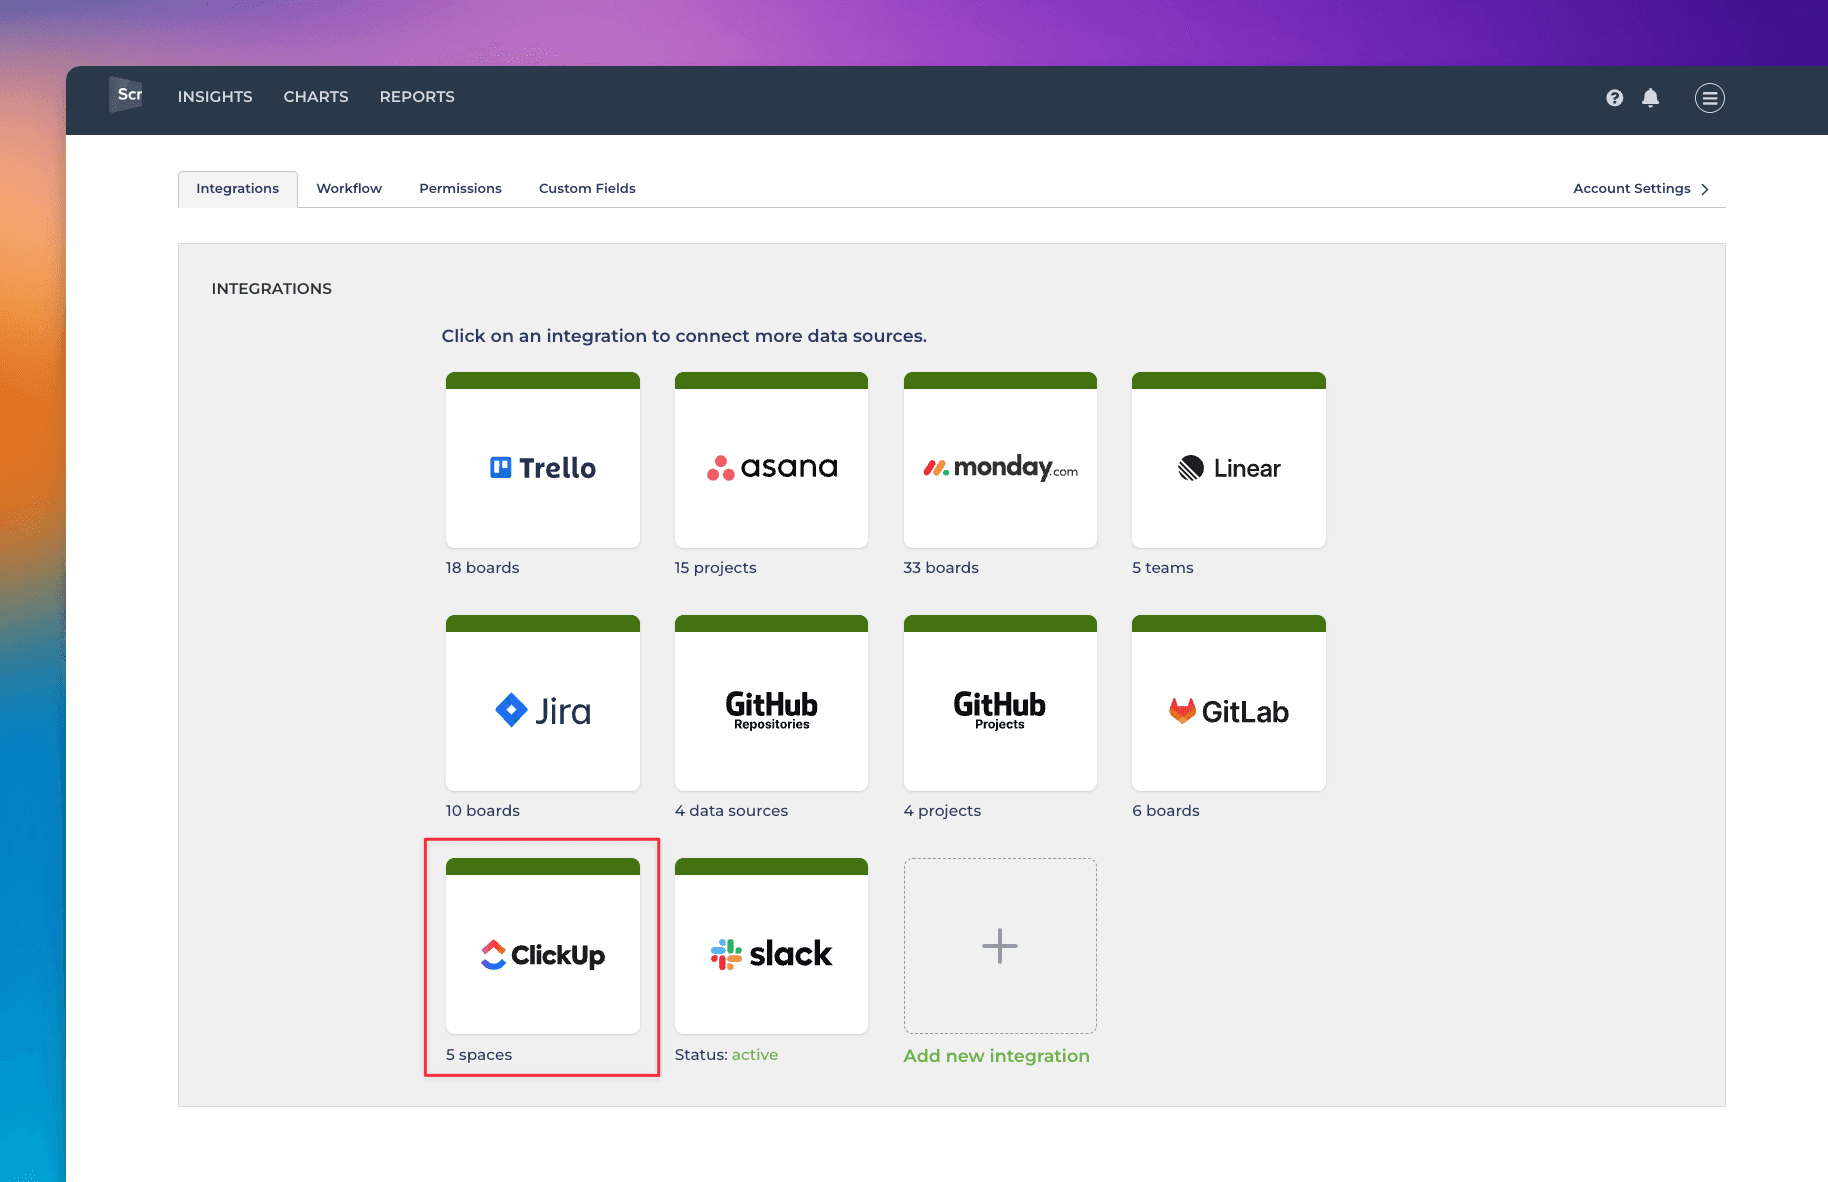
Once you have authorized access to the ClickUp API, you’ll be shown a list of spaces in your account.
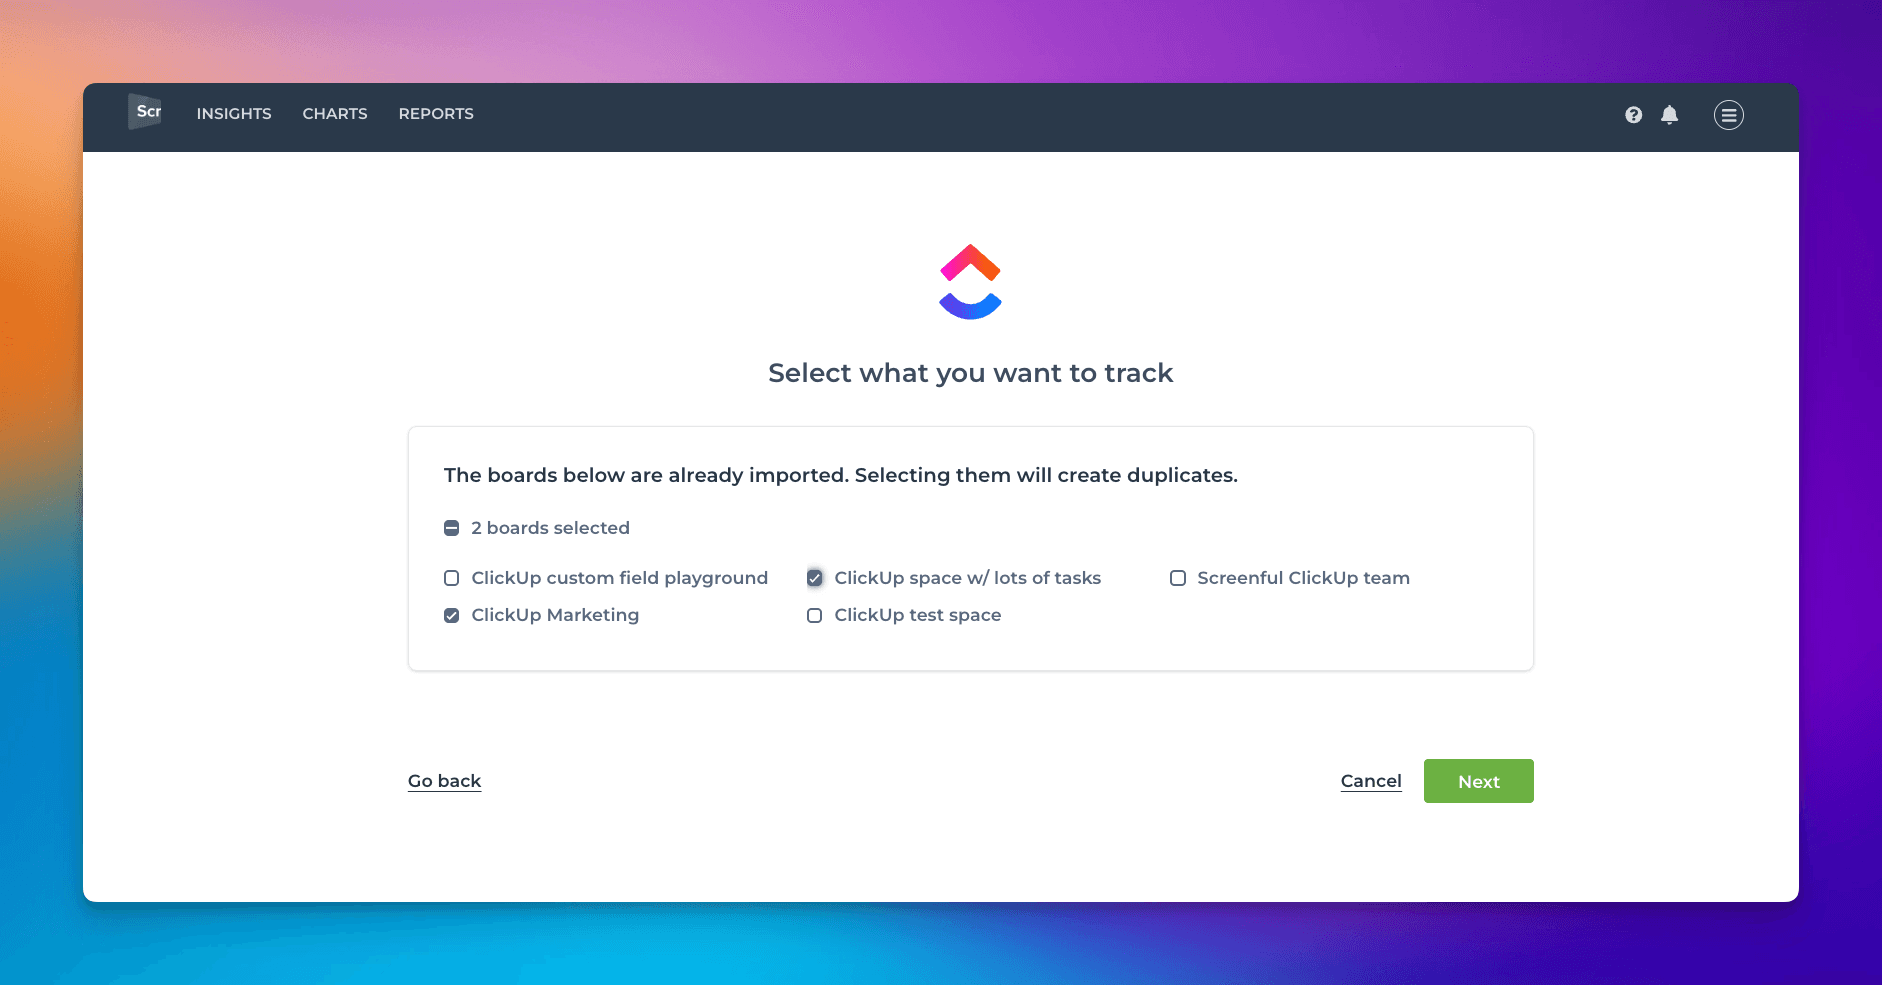
You can import one or more spaces from the list. You can add more data sources later. Learn more about managing data sources.
About Screenful
Screenful provides multidimensional analytics of the data in ClickUp. You can slice & dice your data with 15 different chart types, and click through to drill into details.
Let us know if you have questions or feedback by contacting hello@screenful.com. To stay on the loop, read our blog, or follow us on LinkedIn.
