You can import data from the tools that we support, such as Jira, Trello, Linear, monday.com, and GitHub (see all integrations). Once imported, you can use them as data sources in the charts. At any time, you can import more data sources under the Integrations page.
This guide shows you how to import and manage data sources.
Importing a data source
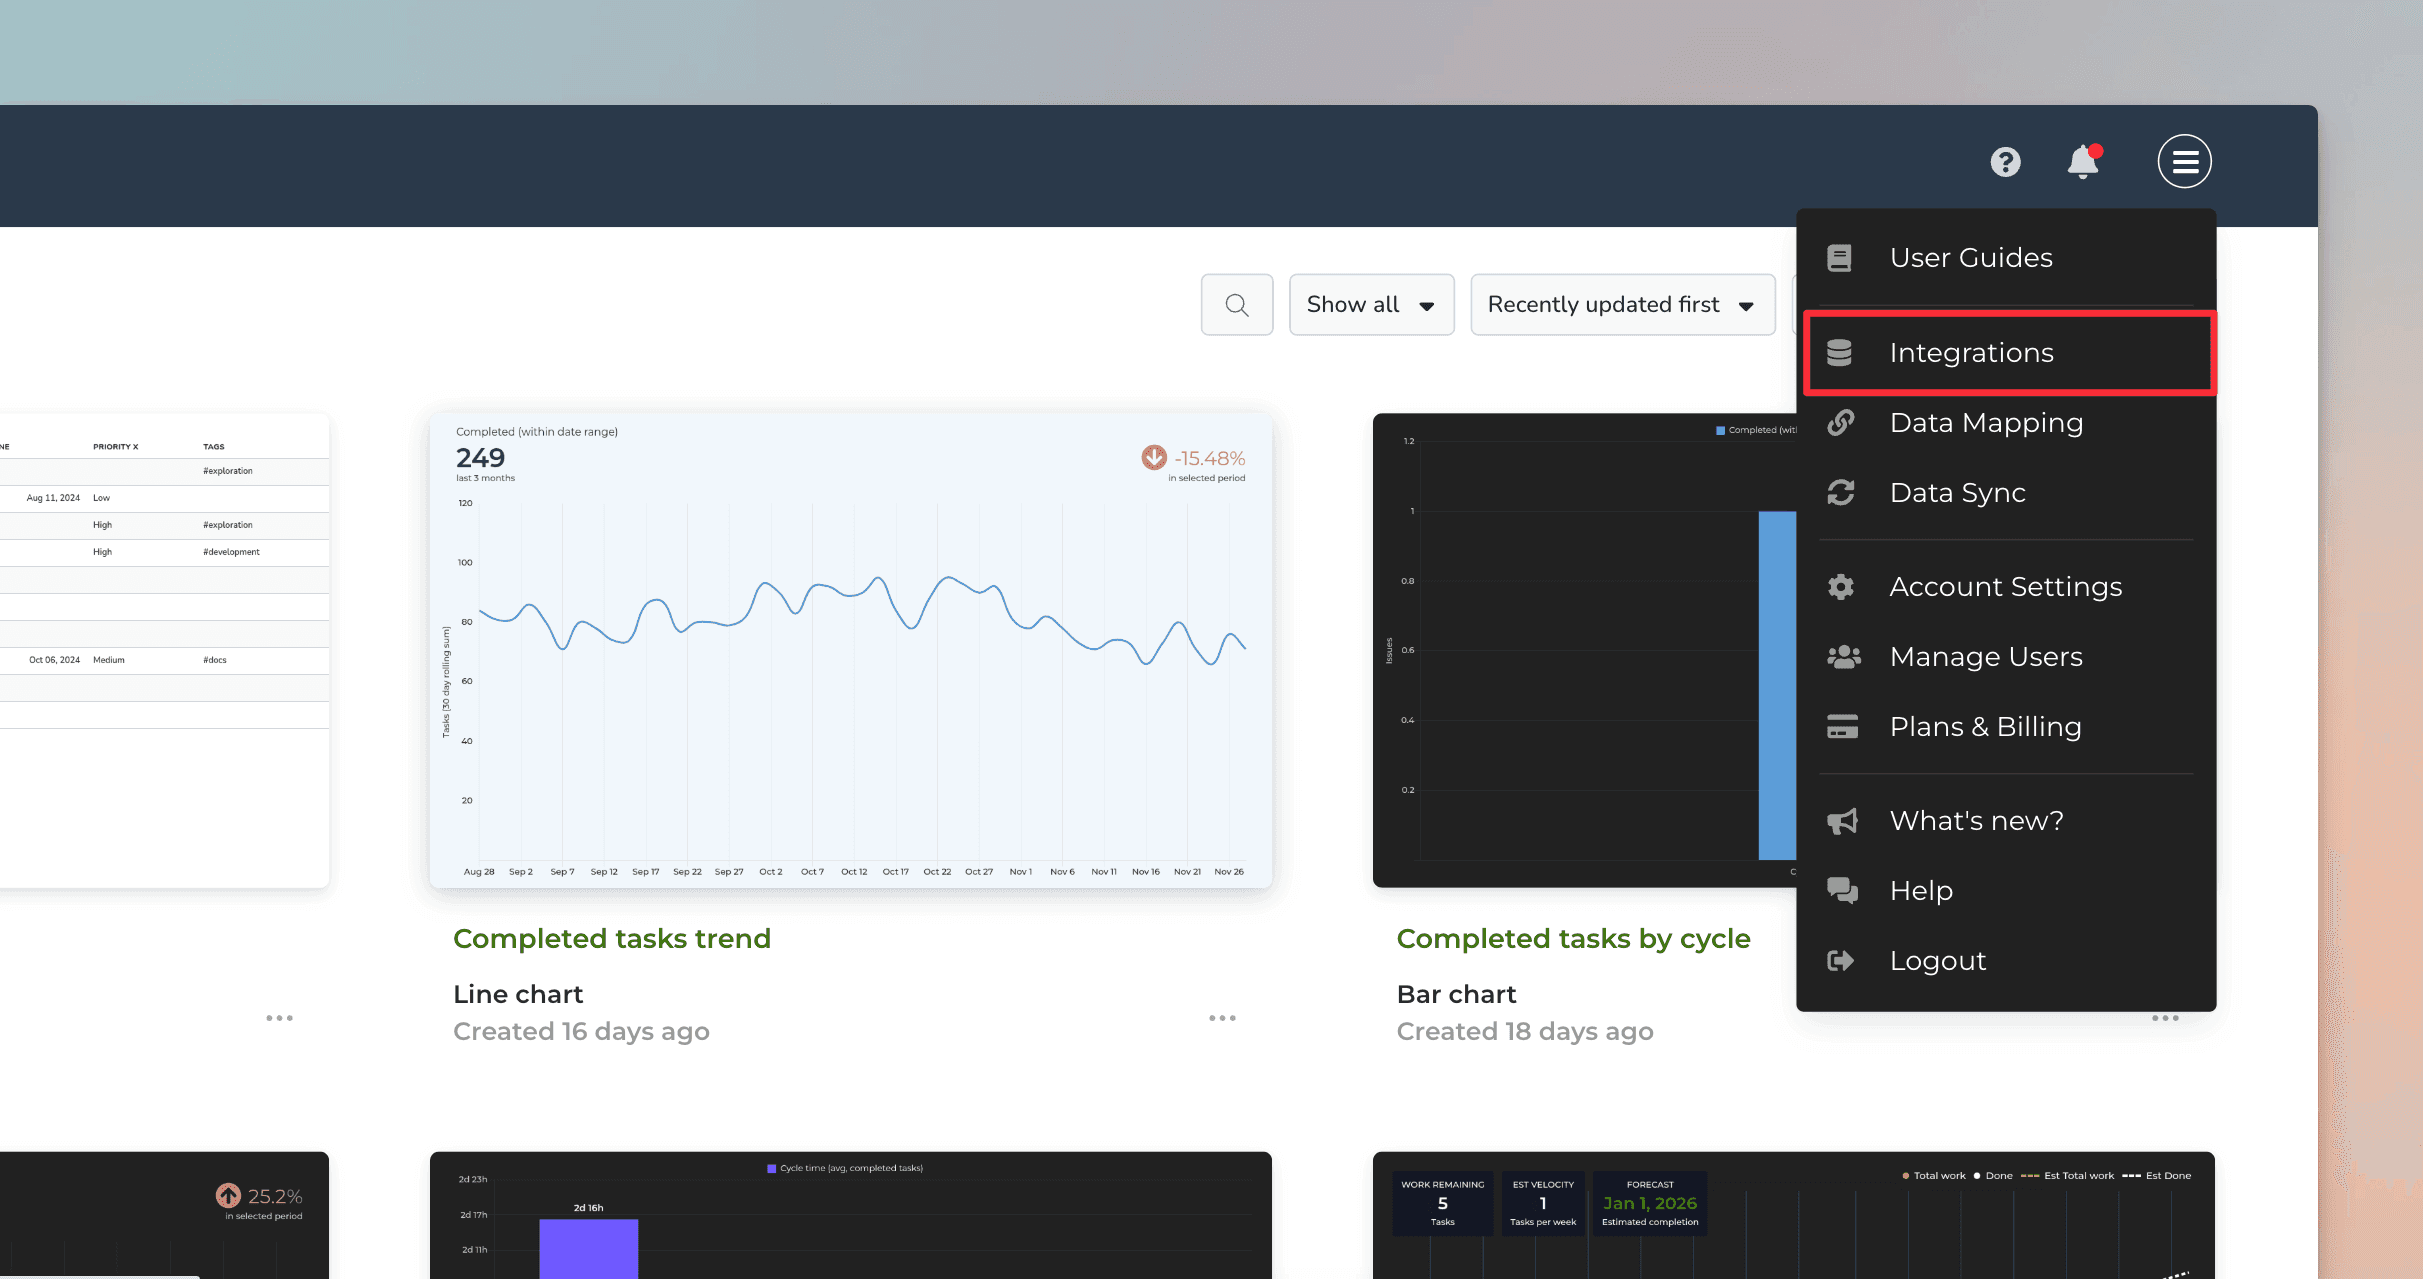
To import a new data source, select Integrations from the main menu on the top right corner:
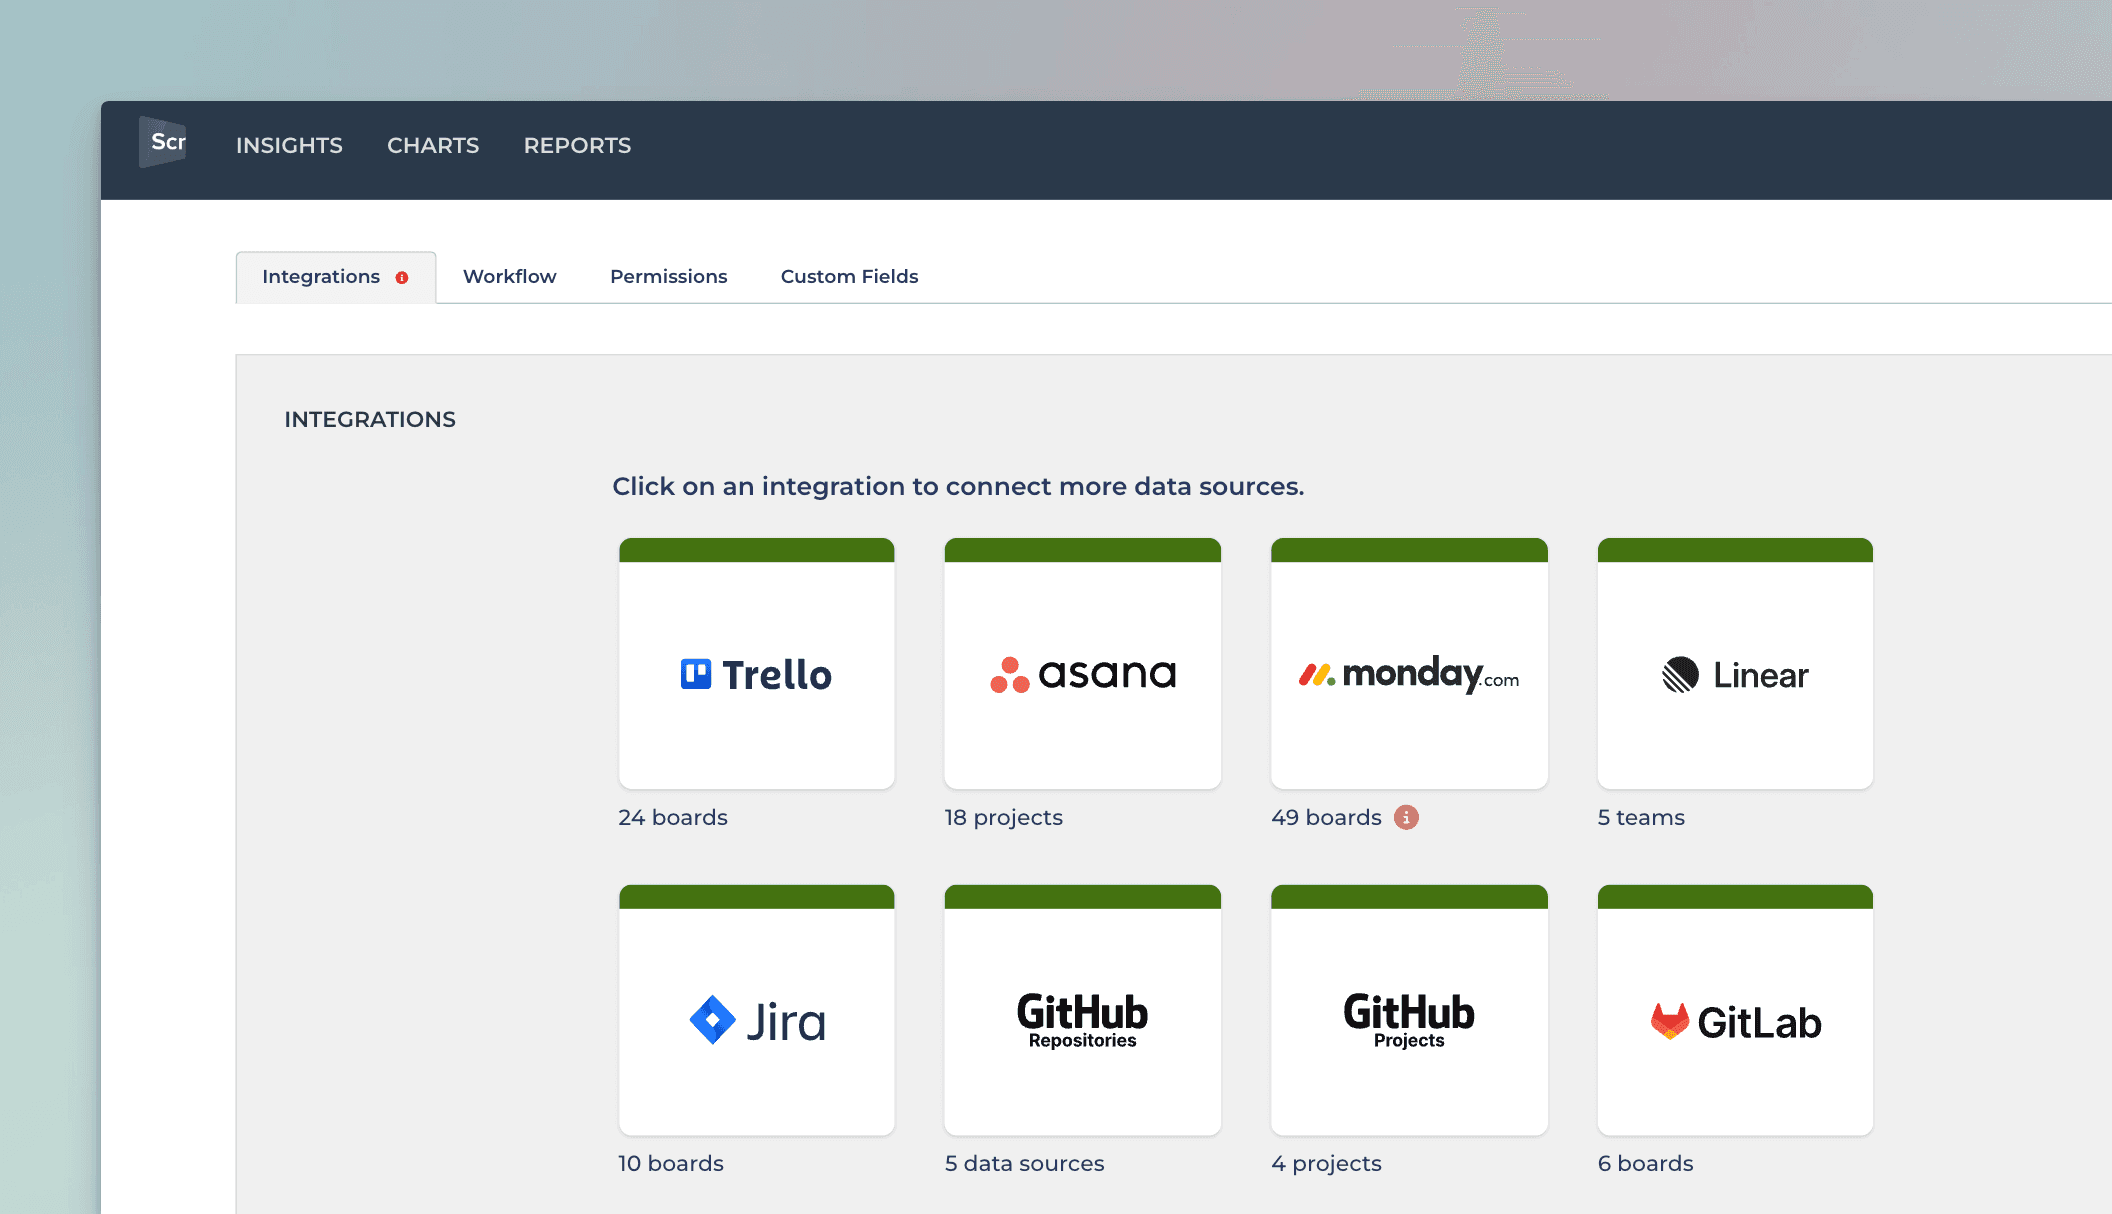
You'll be shown a list of available integrations. Pick the tool you want to import data from:
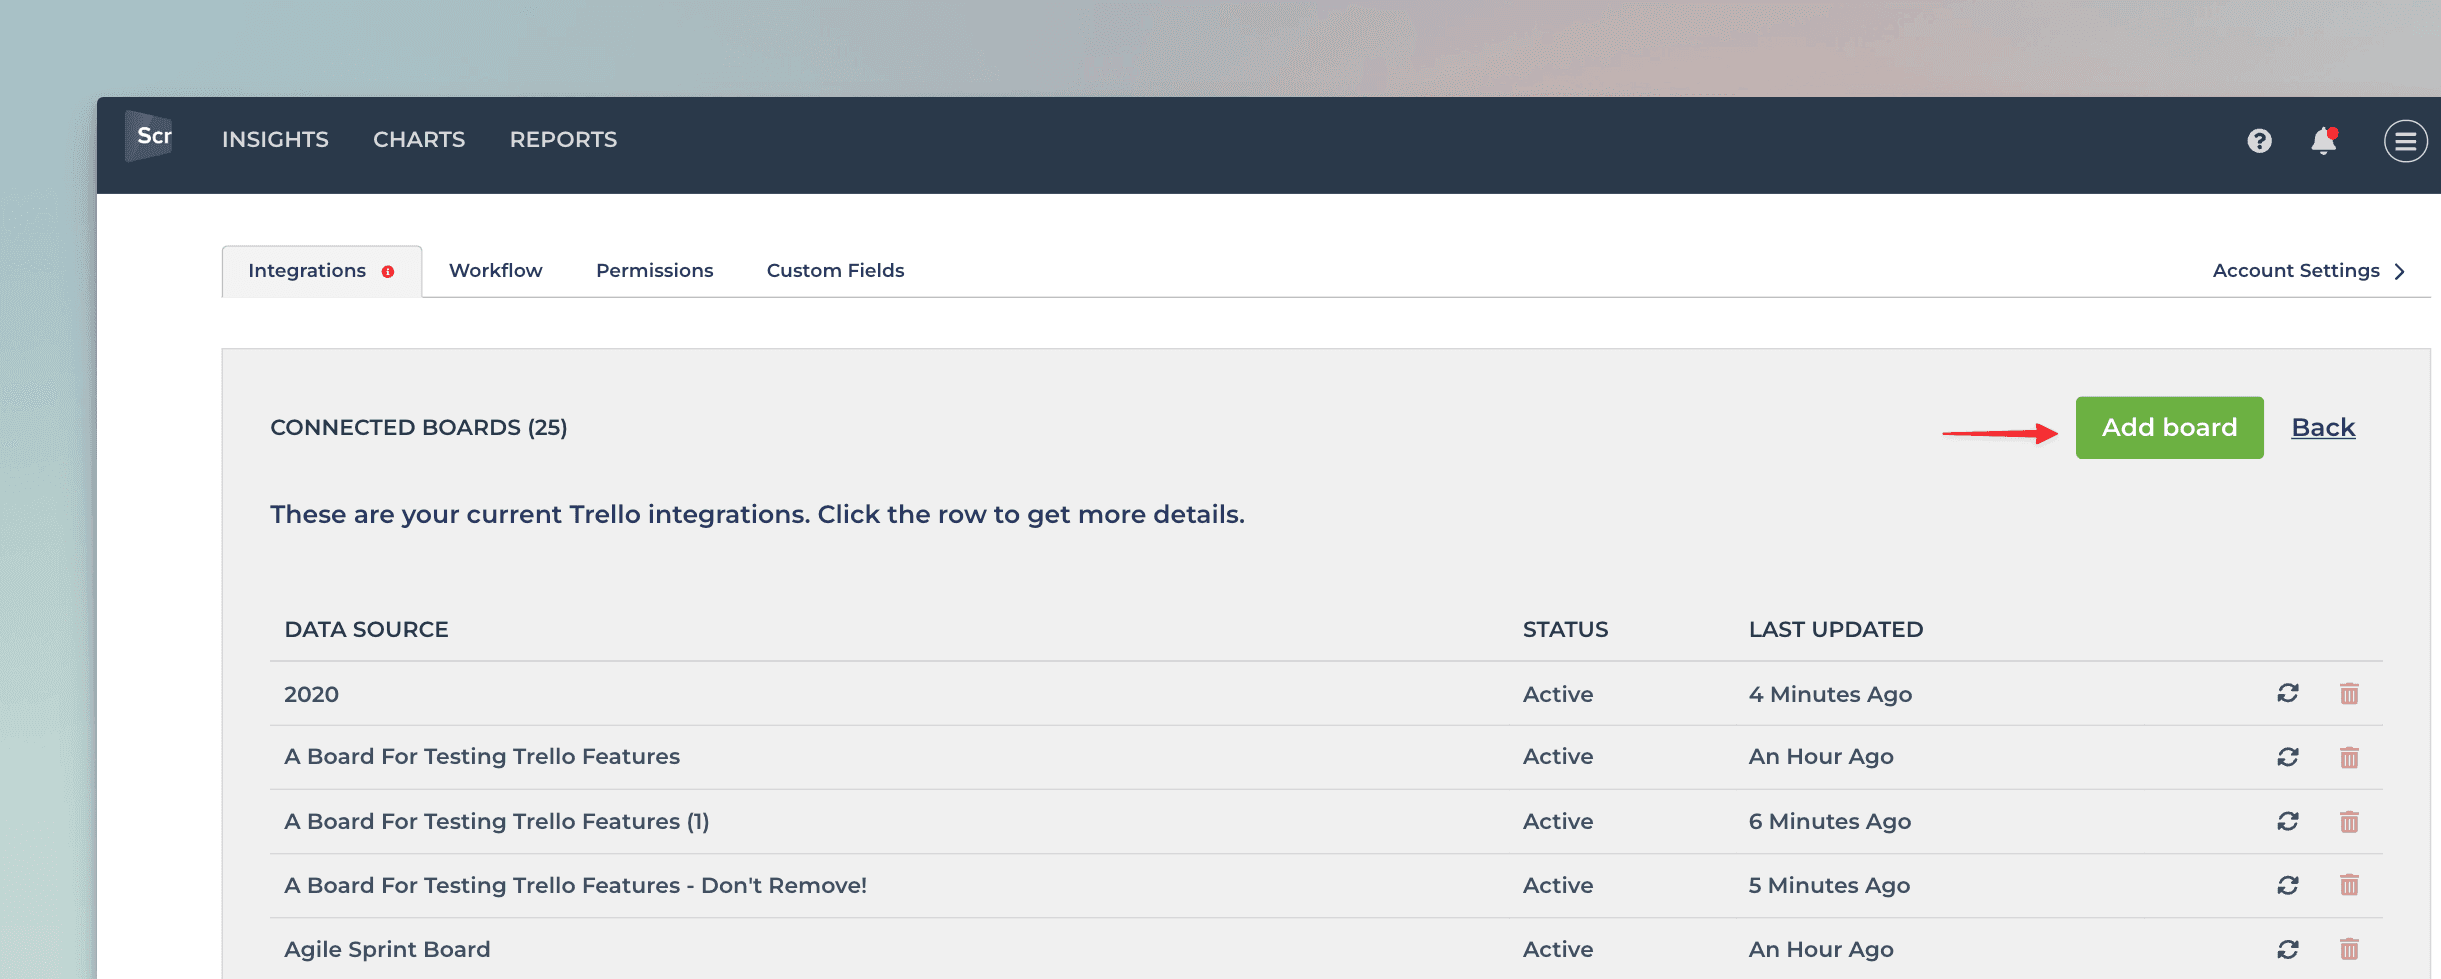
You'll be shown a list of data sources already imported. To import a new data source, click Add board in the top:
Next, you'll have to authorize access to the API. Once done, you'll be shown the list of available data sources:
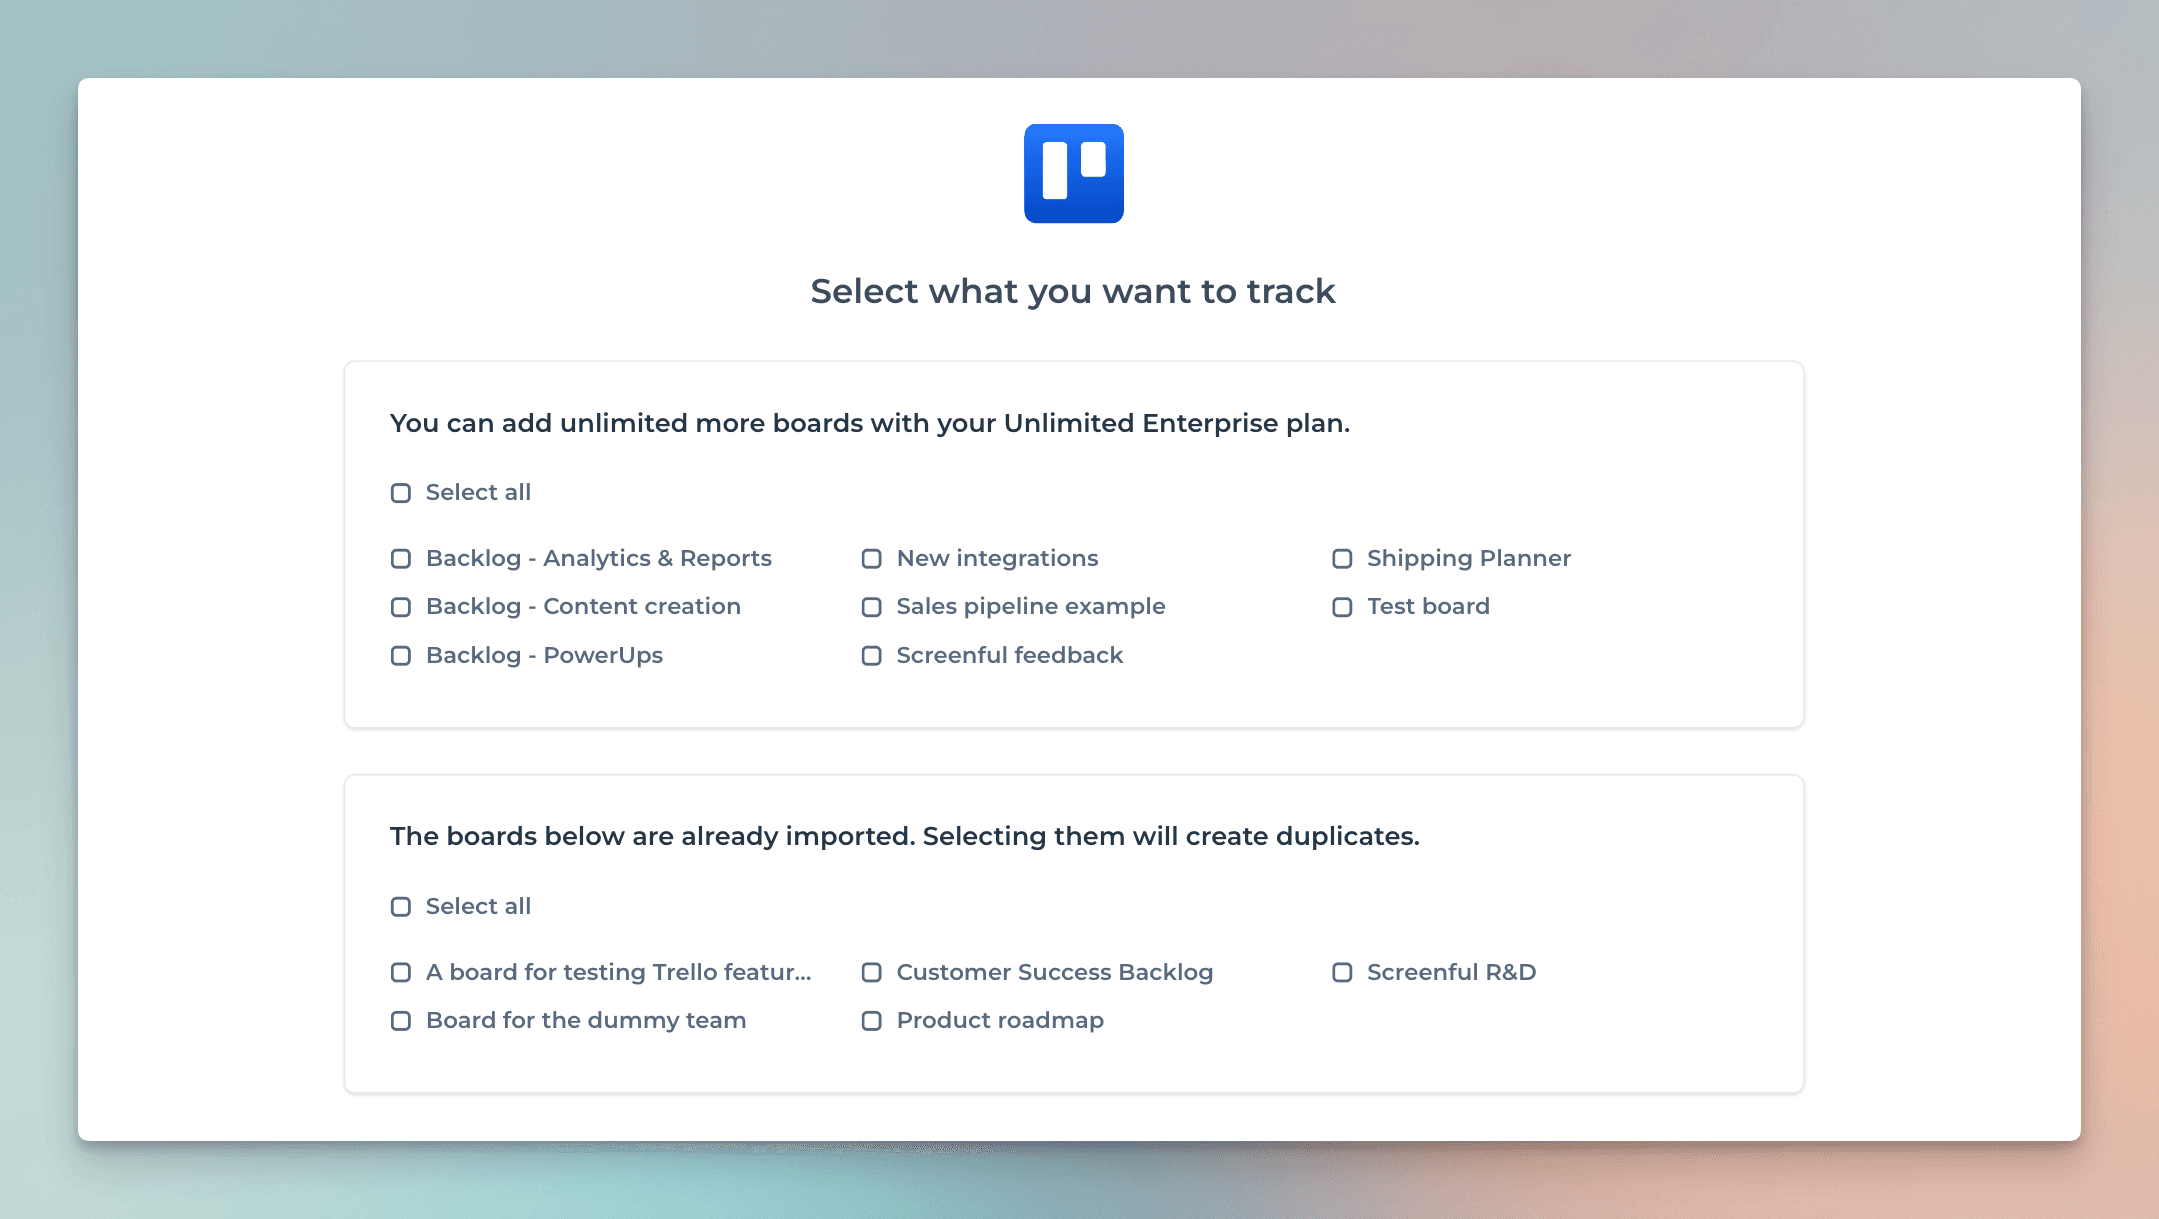
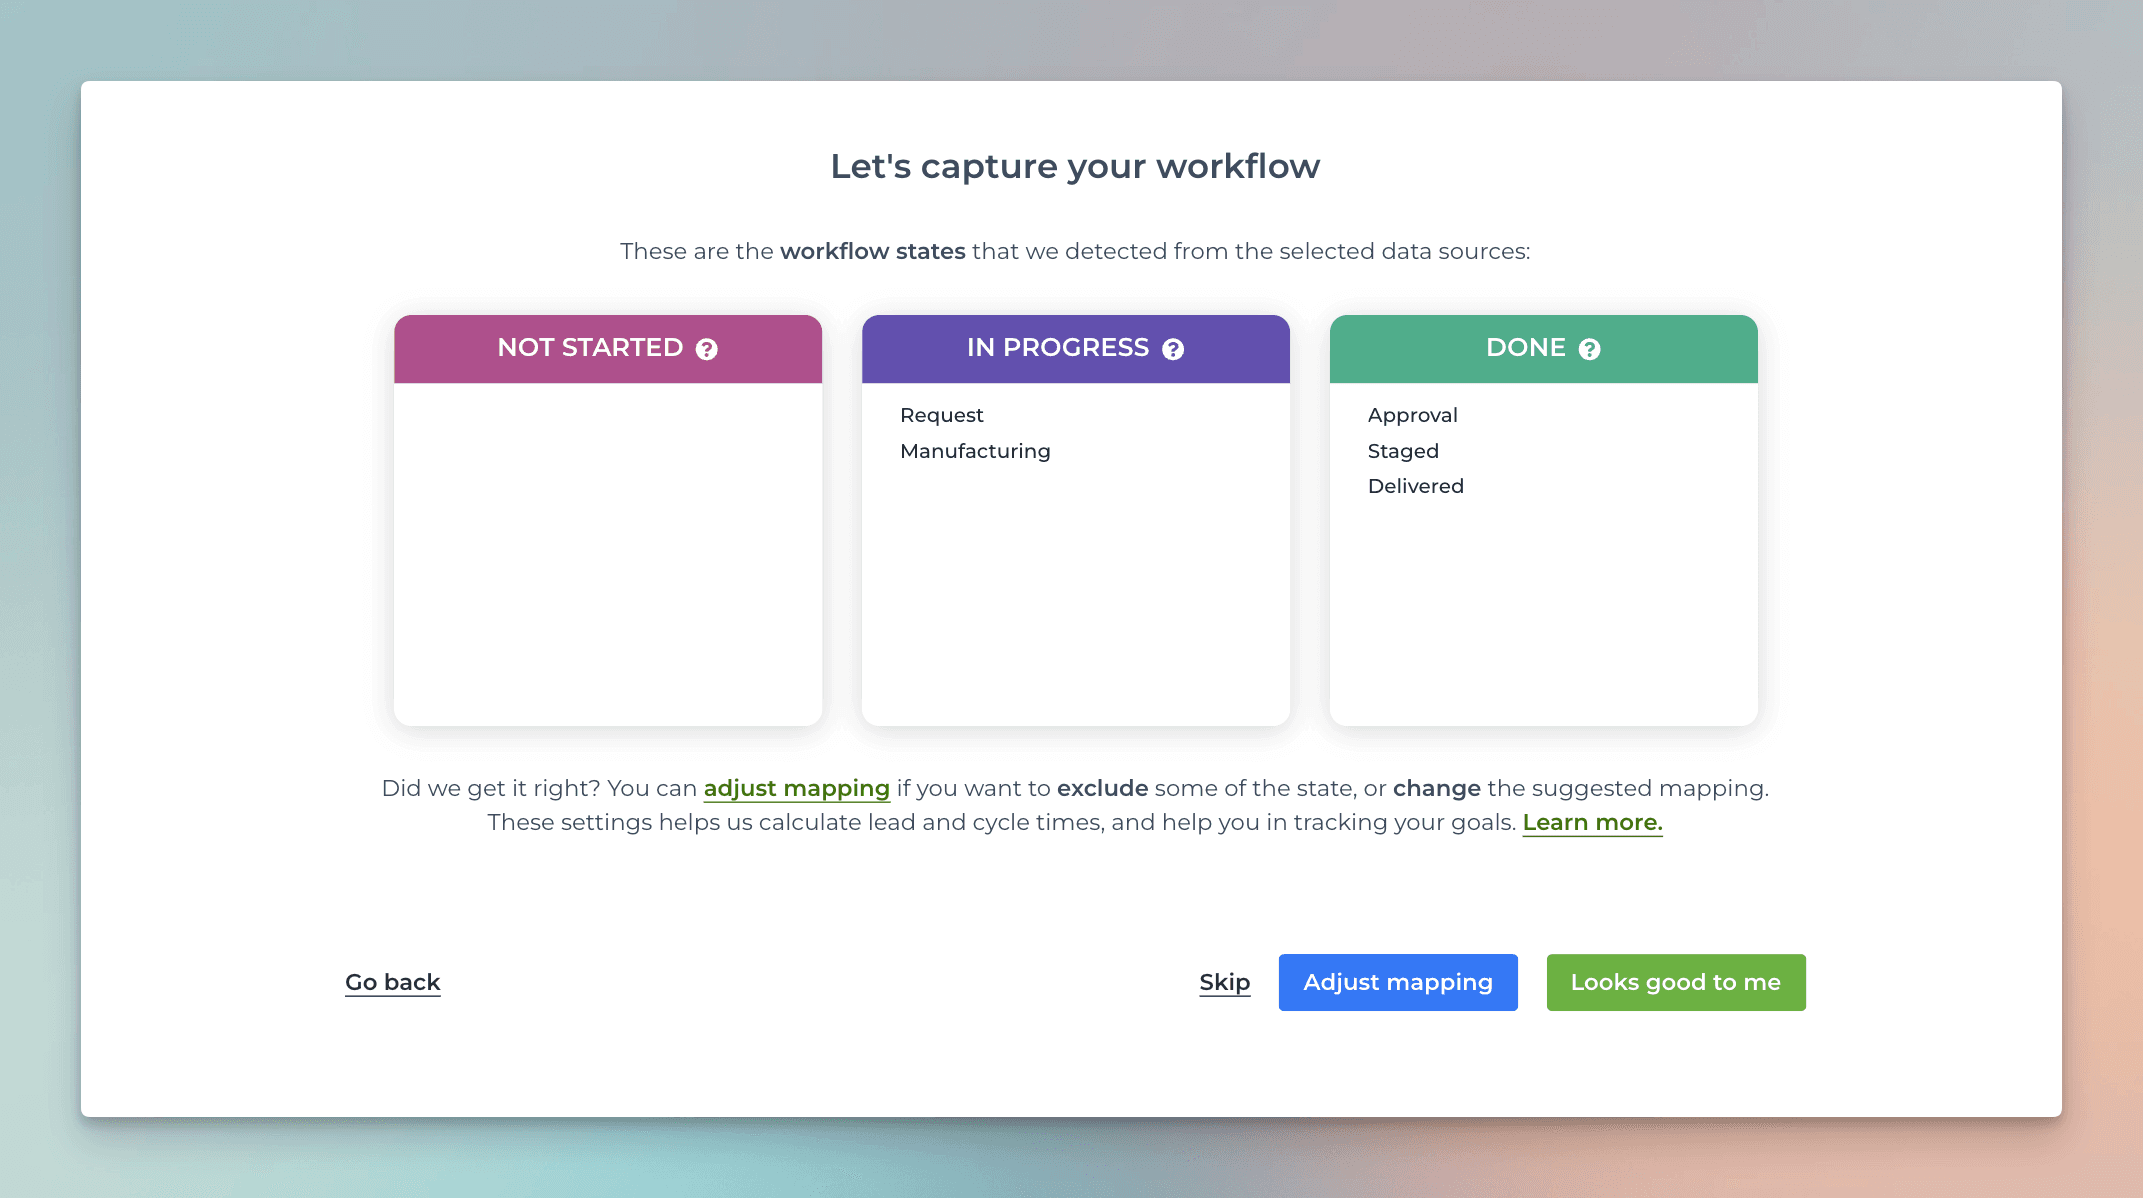
Select one or more boards to import and click Next. Your workflow steps are automatically mapped to Not started, In progress, and Done. This information is used for calculating the lead and cycle times.
You can adjust the mapping if needed, or accept the suggested mapping by clicking Looks good to me.
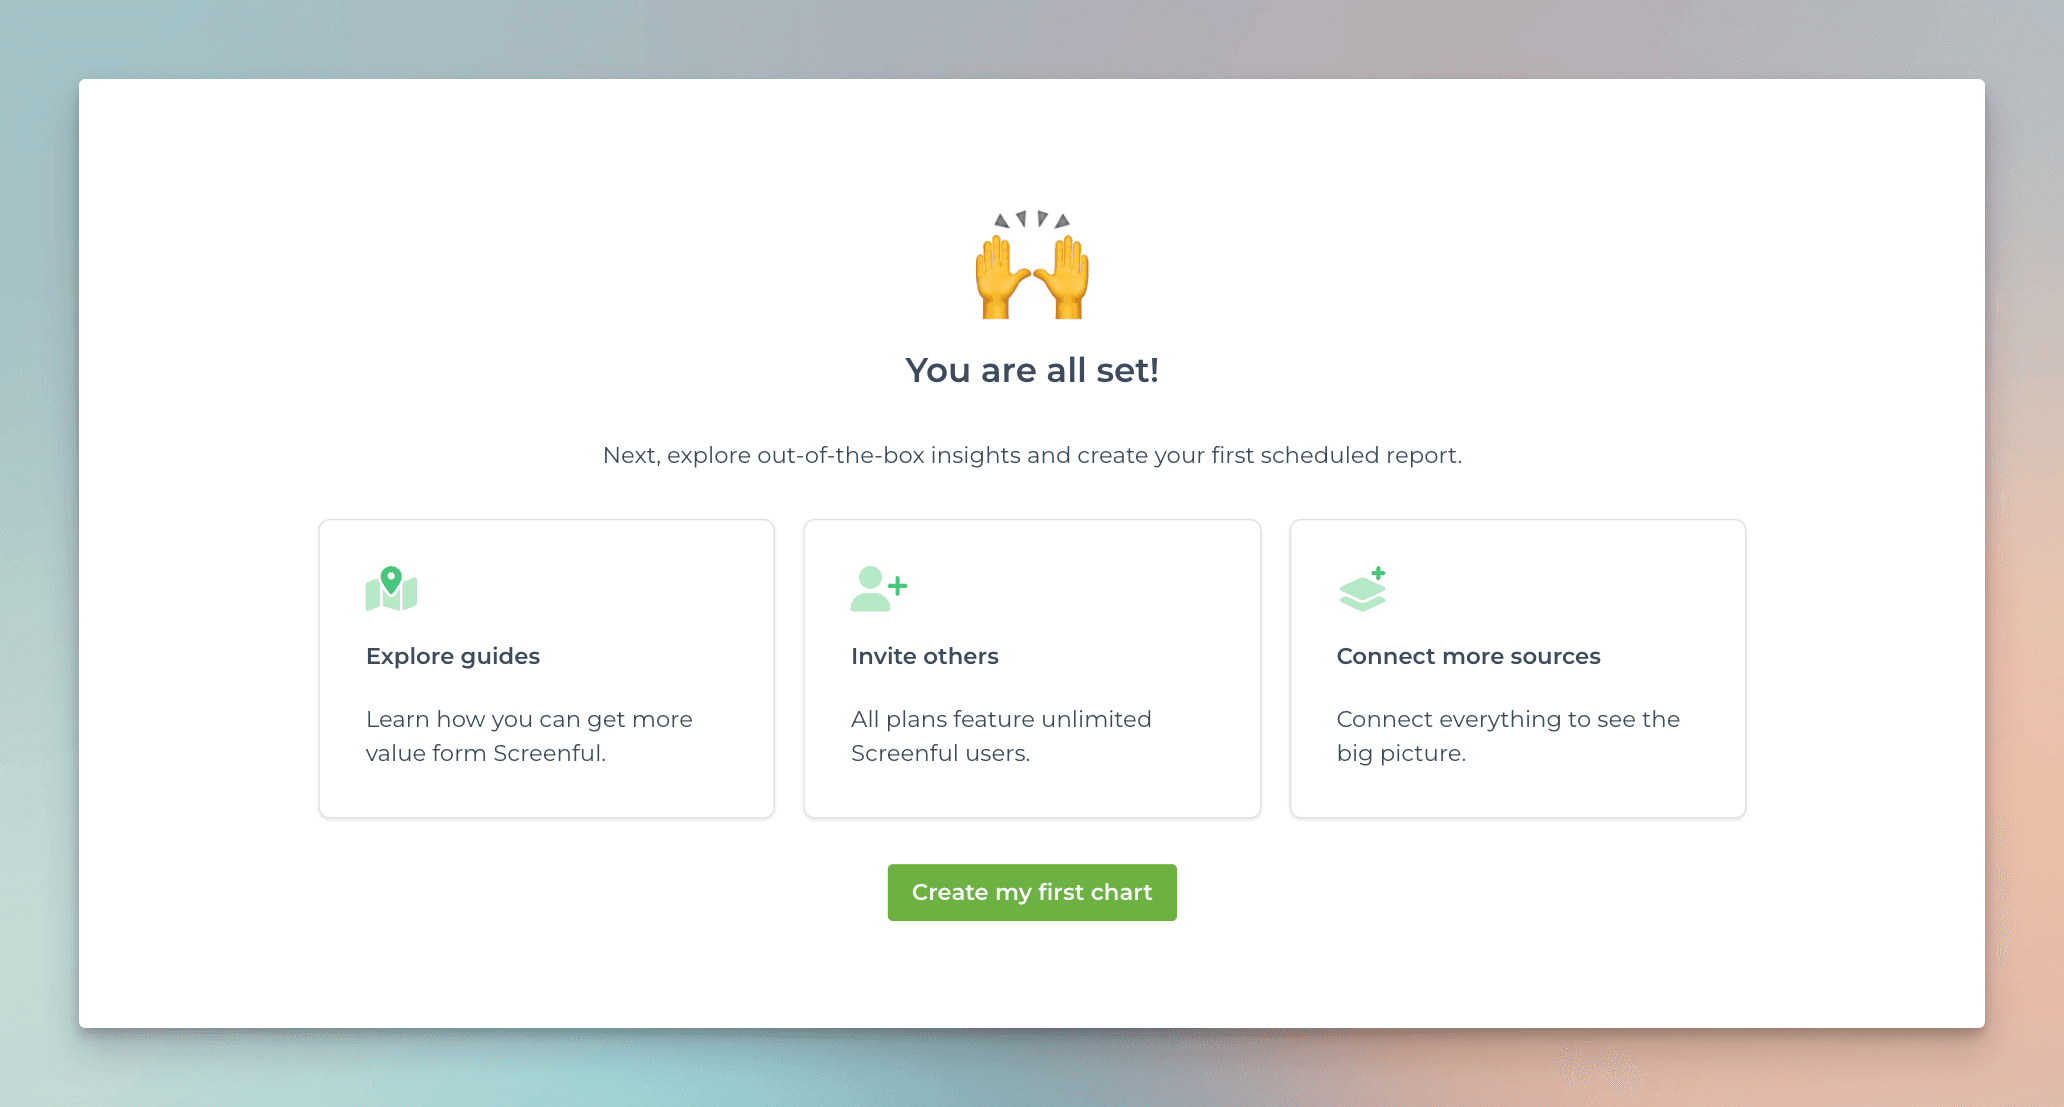
The data import process starts, and you'll be shown a confirmation when you are ready to start creating charts and reports:
Using a data source in a chart
When creating a chart, data sources can be selected from the Data sources menu:
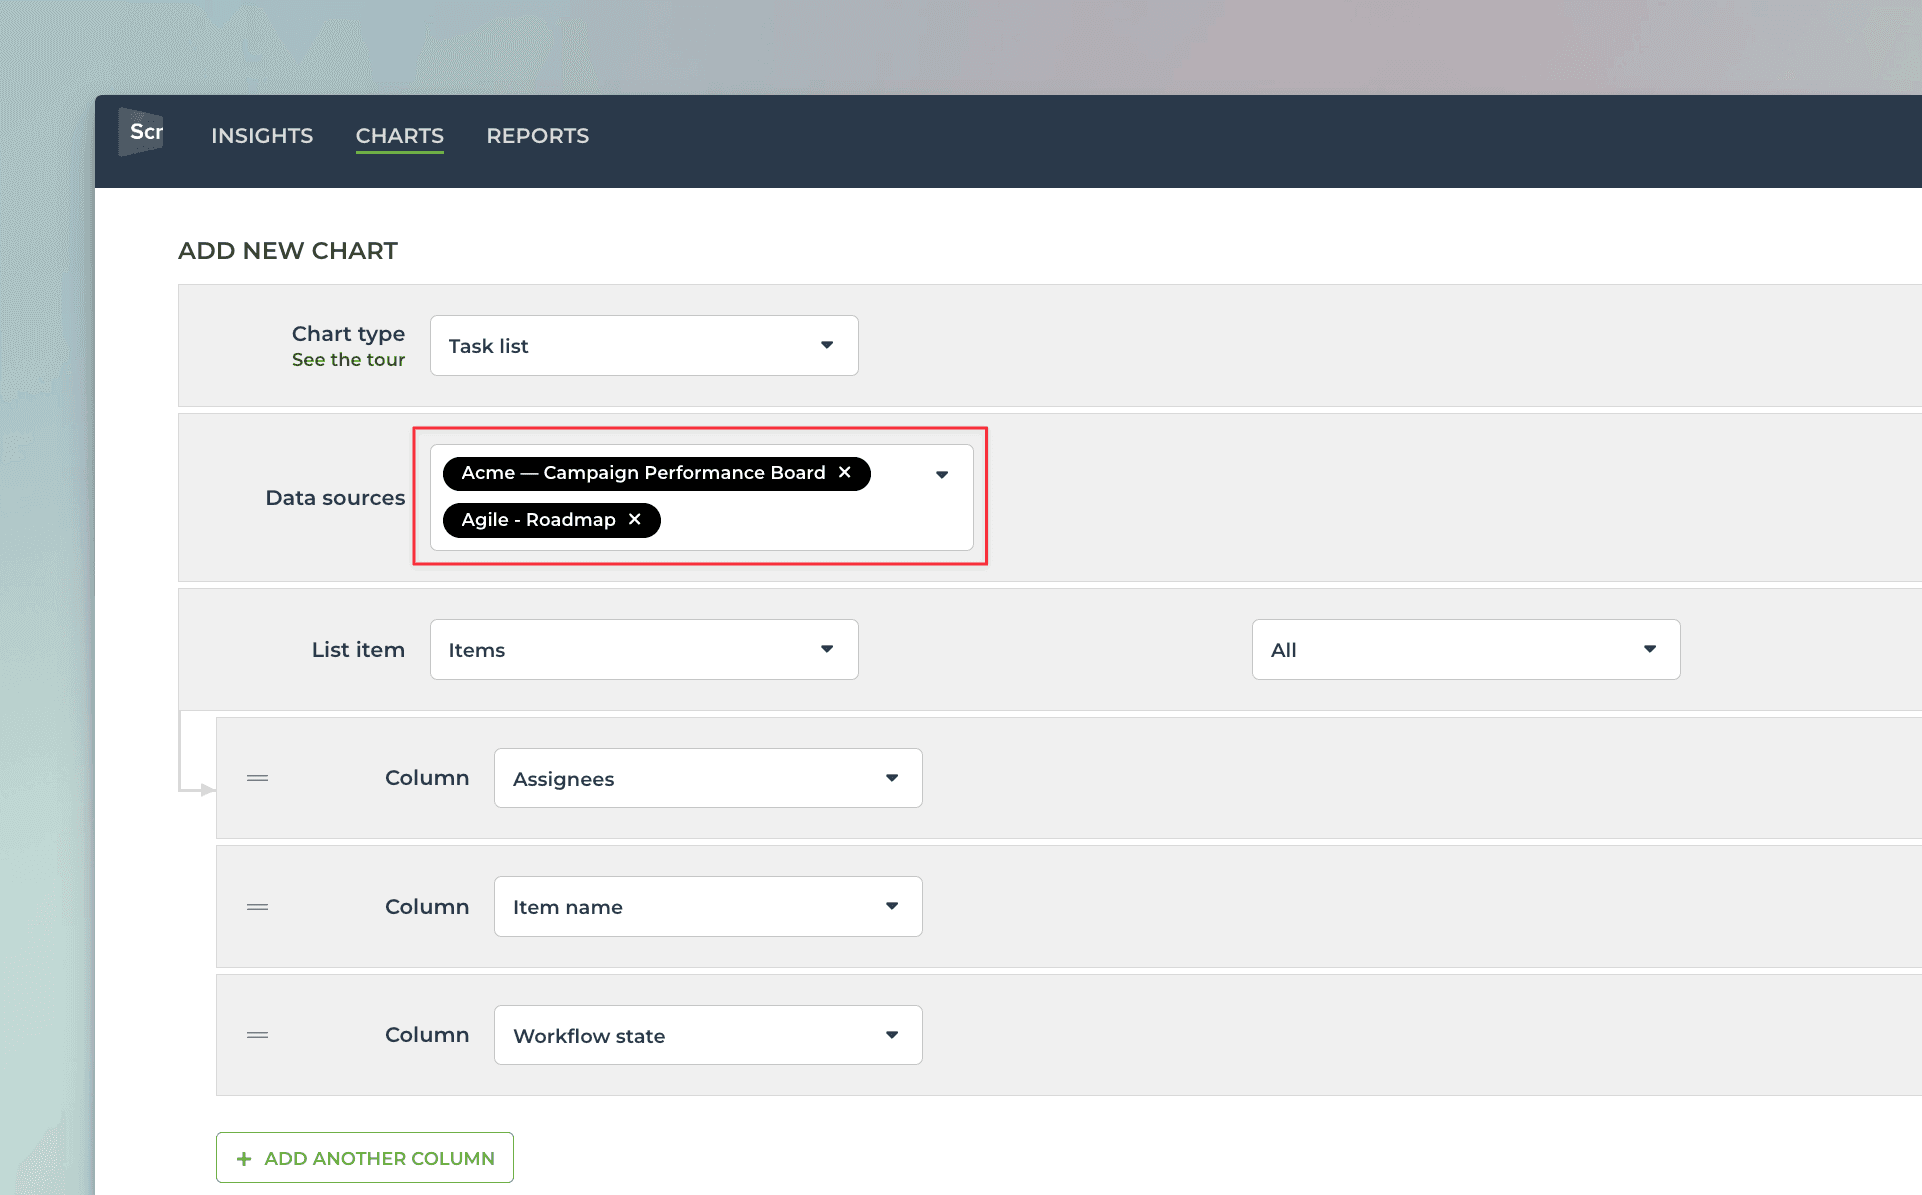
You can select one or more data sources for the chart.
Data sync options
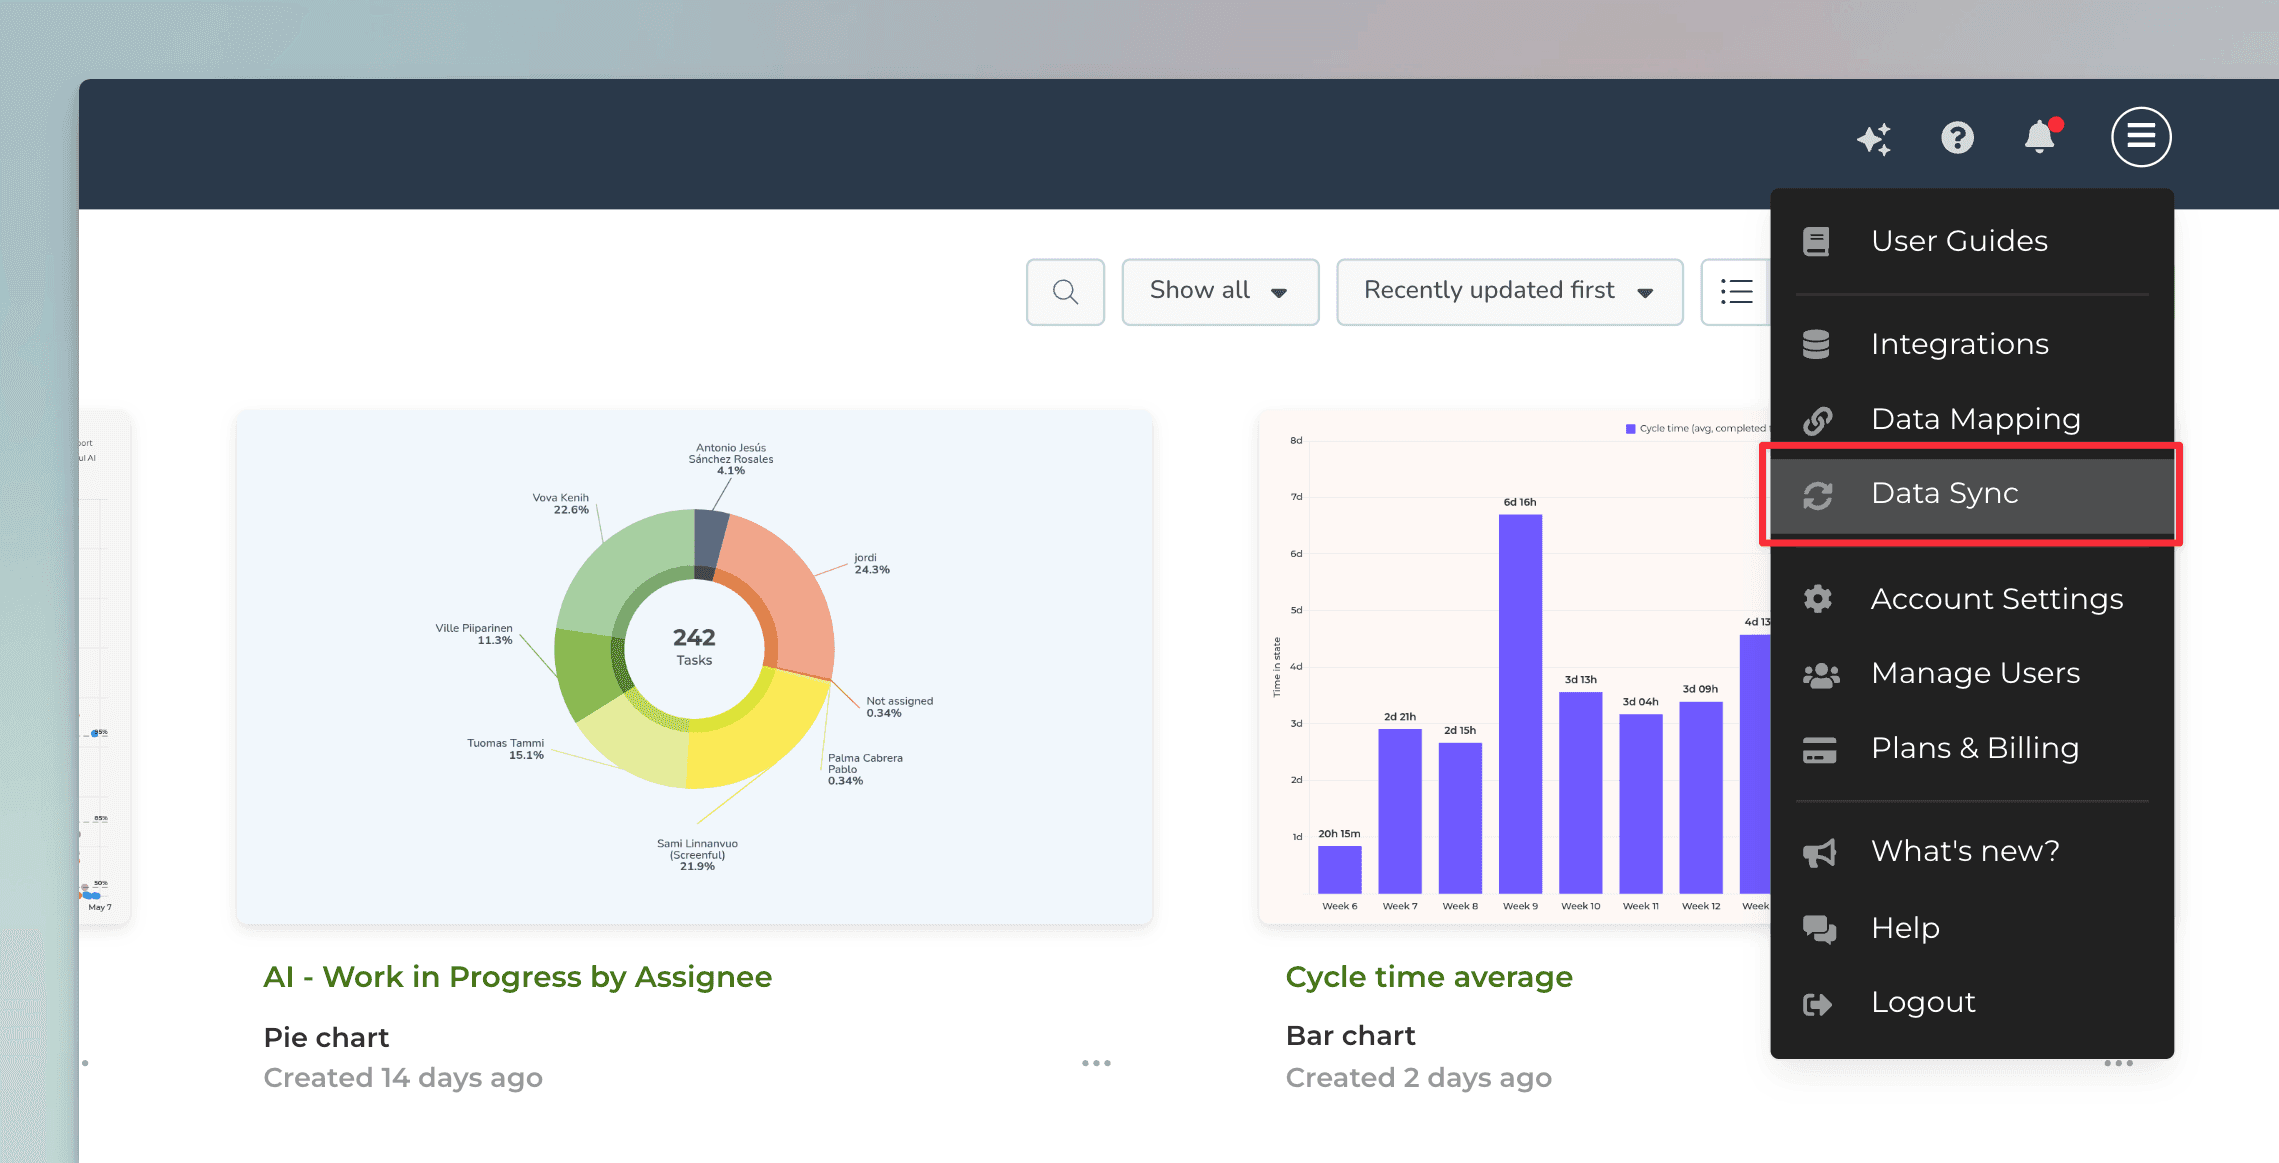
Data sources are automatically synced once per hour. At any time, you can trigger sync manually in the Integrations settings. You can access the integration settings by selecting Integrations from the main menu in the top right corner.
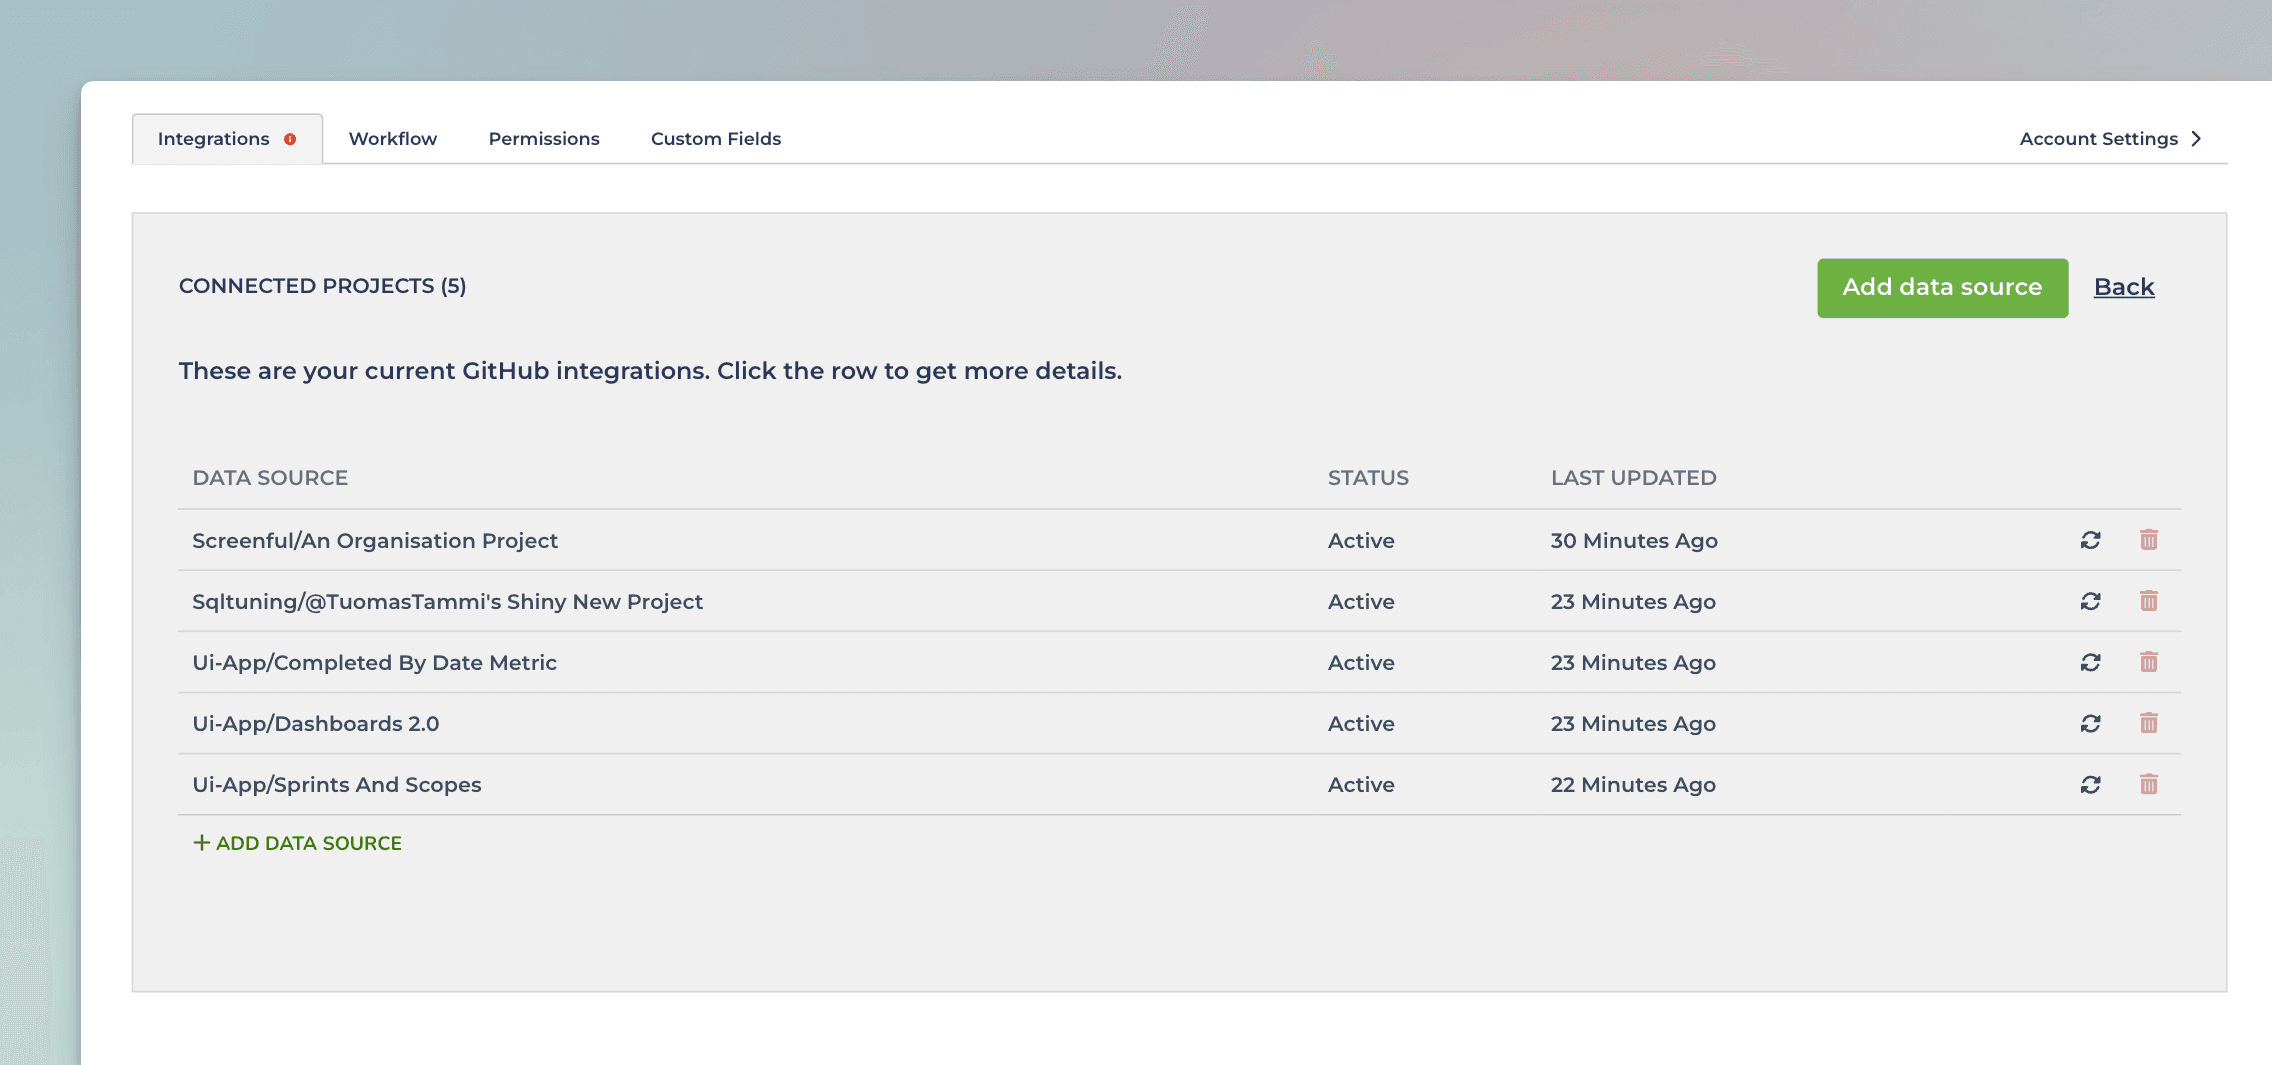
After selecting the tool, you'll see a list of imported data sources. You can trigger the sync process by clicking the sync icon for one or more data sources:
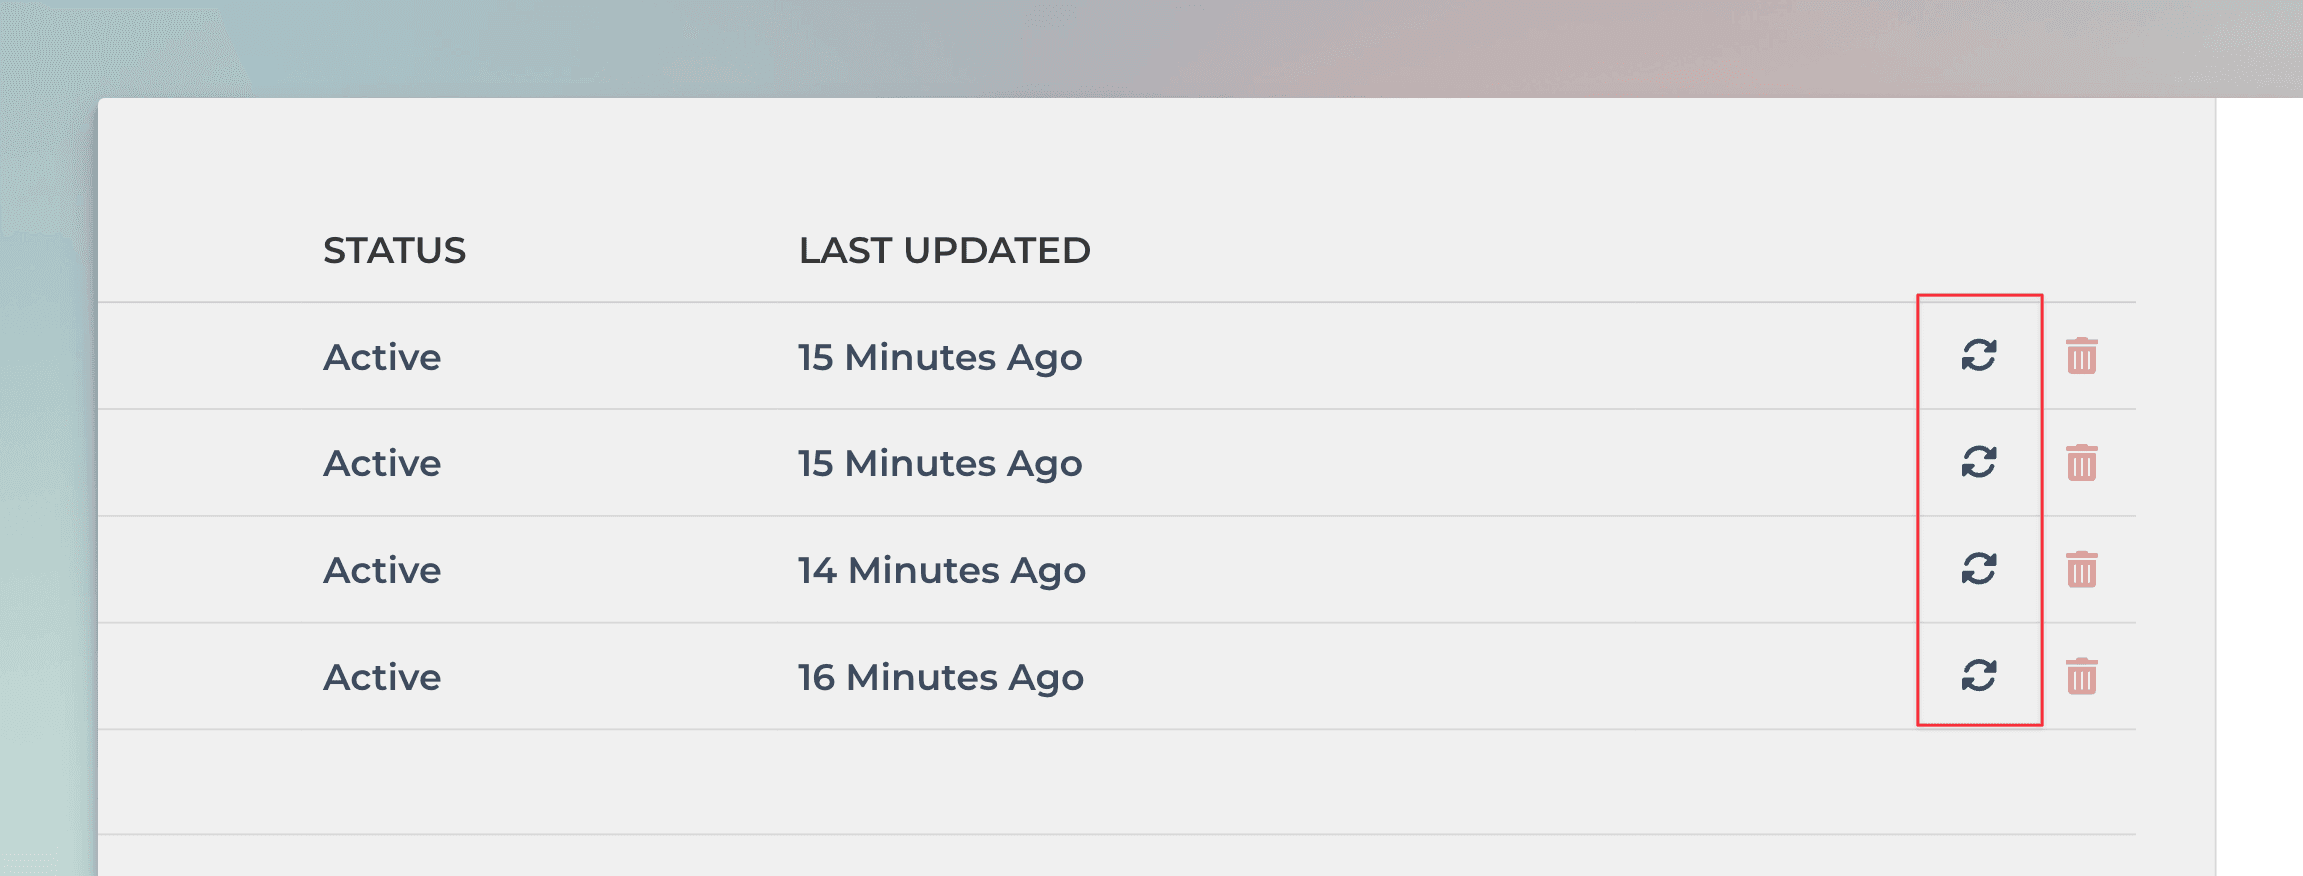
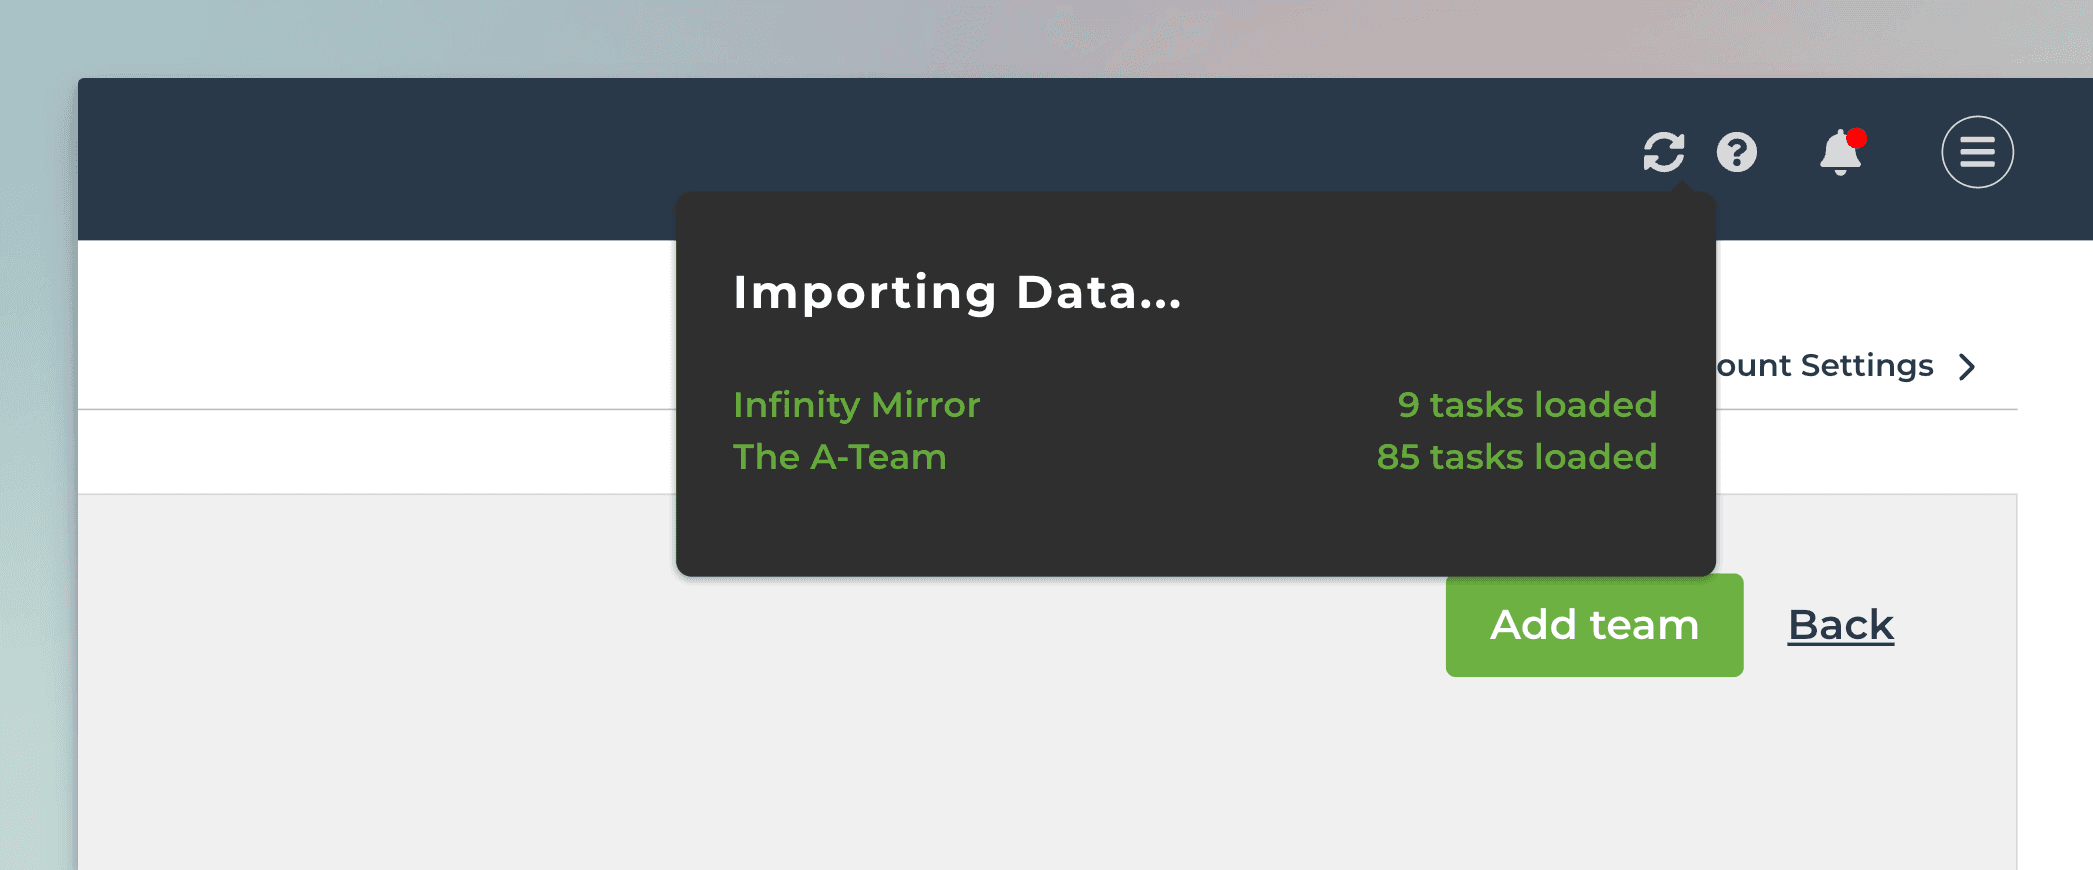
The data import process begins, and a sync icon becomes visible on the header part of the UI. You can hover the icon to see progress information:
Once the data sources are synced, the sync icon disappears from the UI header.
Resetting a data source
If you want to rebuild all the stats, you can do that with the Reset option. It reloads all data from the API and recalculates everything based on what API returns at that point. Your charts, reports, or other configurations won't be affected.
While you normally don't need to use reset, there are some special cases when you might want to reset data. If, for whatever reason, you are planning to remove a data source, and then import it again, you are likely better off just resetting the data source. It resets the data while keeping the data source id the same.
Since the new stats are built based on what comes out of API right now, the new stats won't include the items that were removed from the board. If you complete a task, and then remove it from the board after it was completed, it stays in the Screenful stats. Those items won't be present in your stats anymore after resetting the data.
You can find the reset option by first selecting Data sync from the main menu:
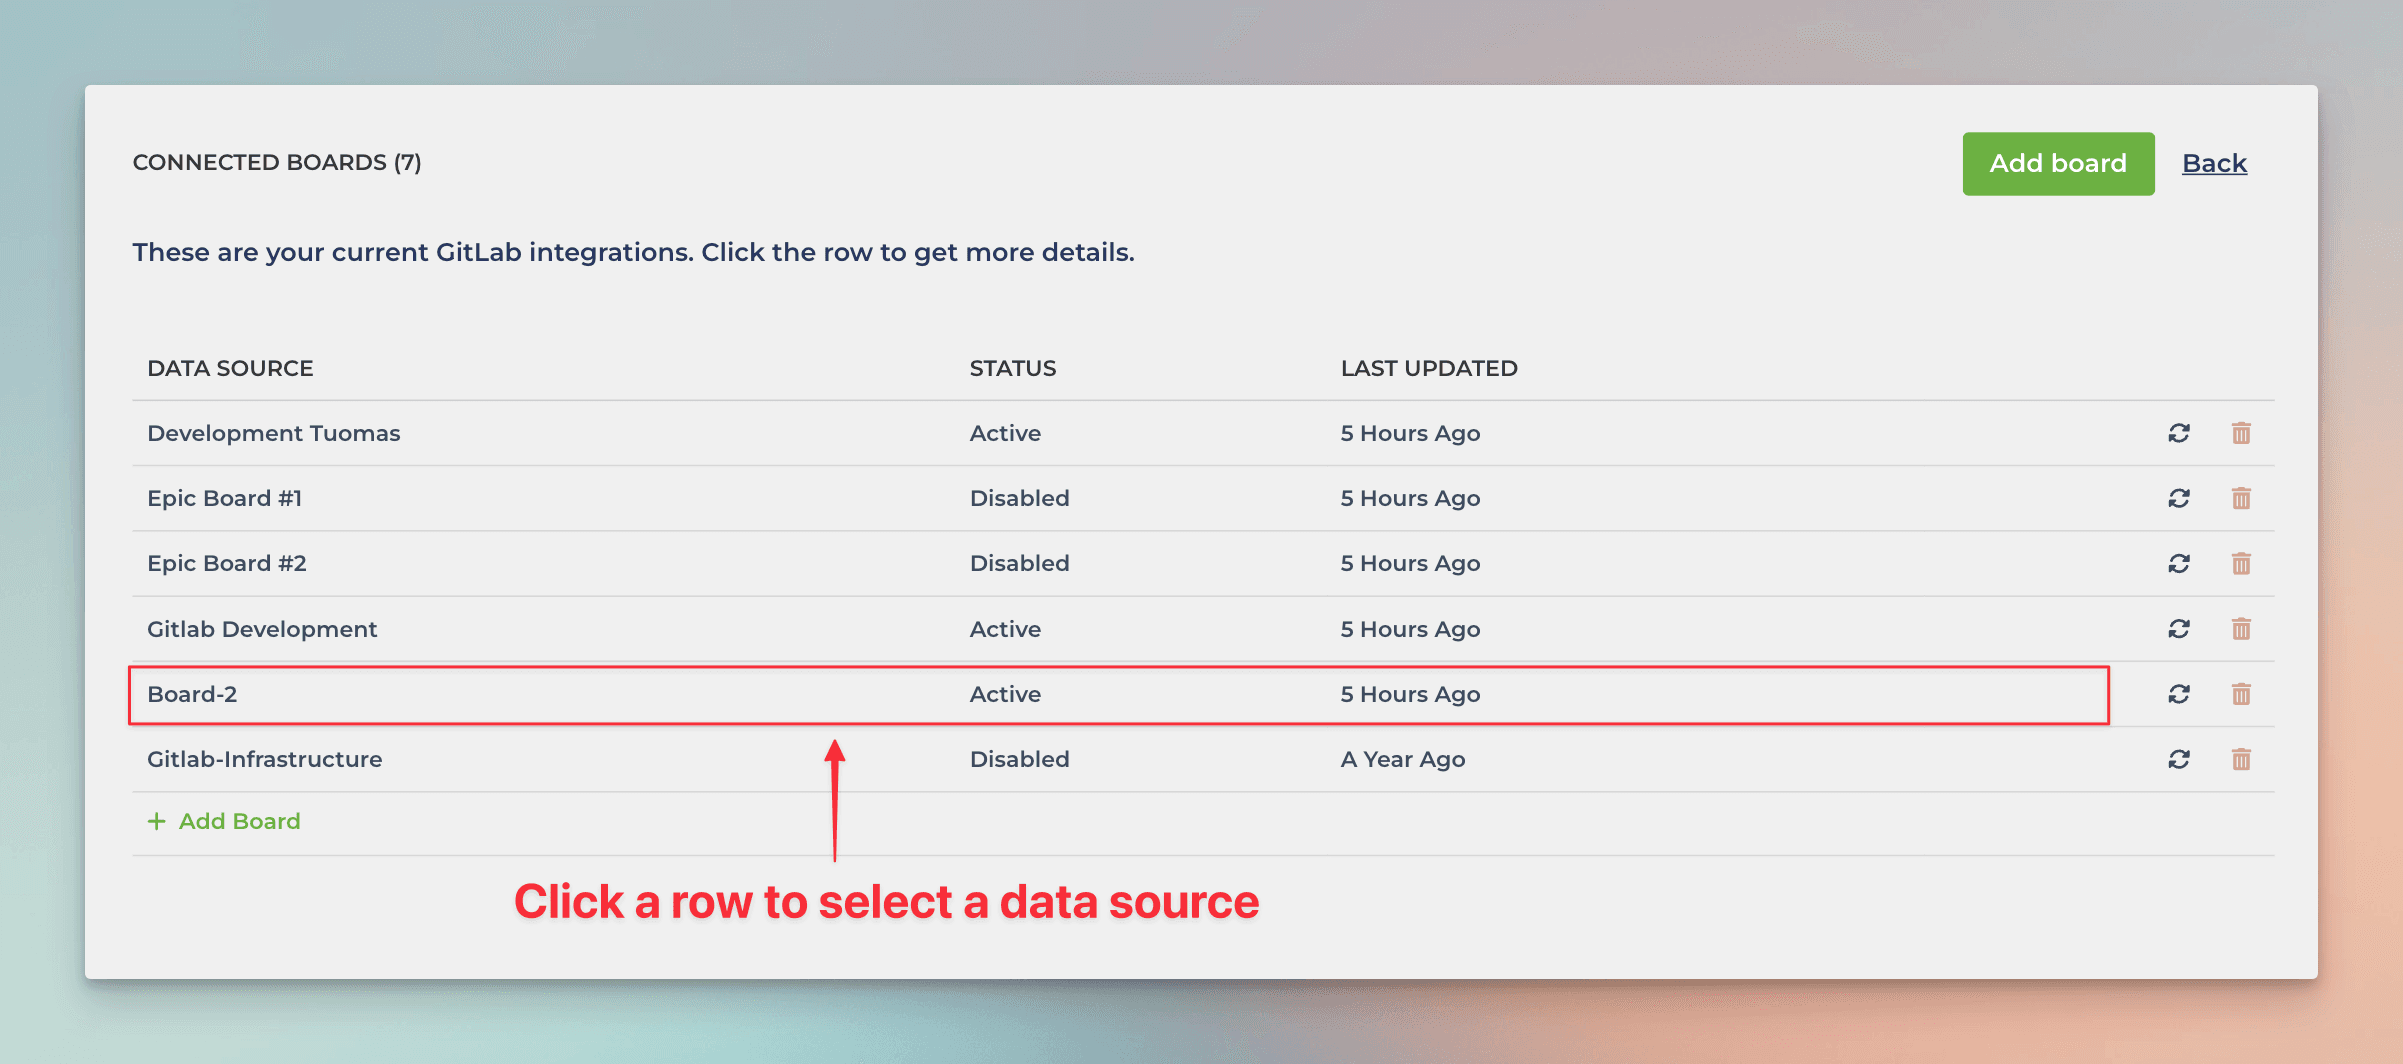
Then click the logo of the integration to see the list of data sources:
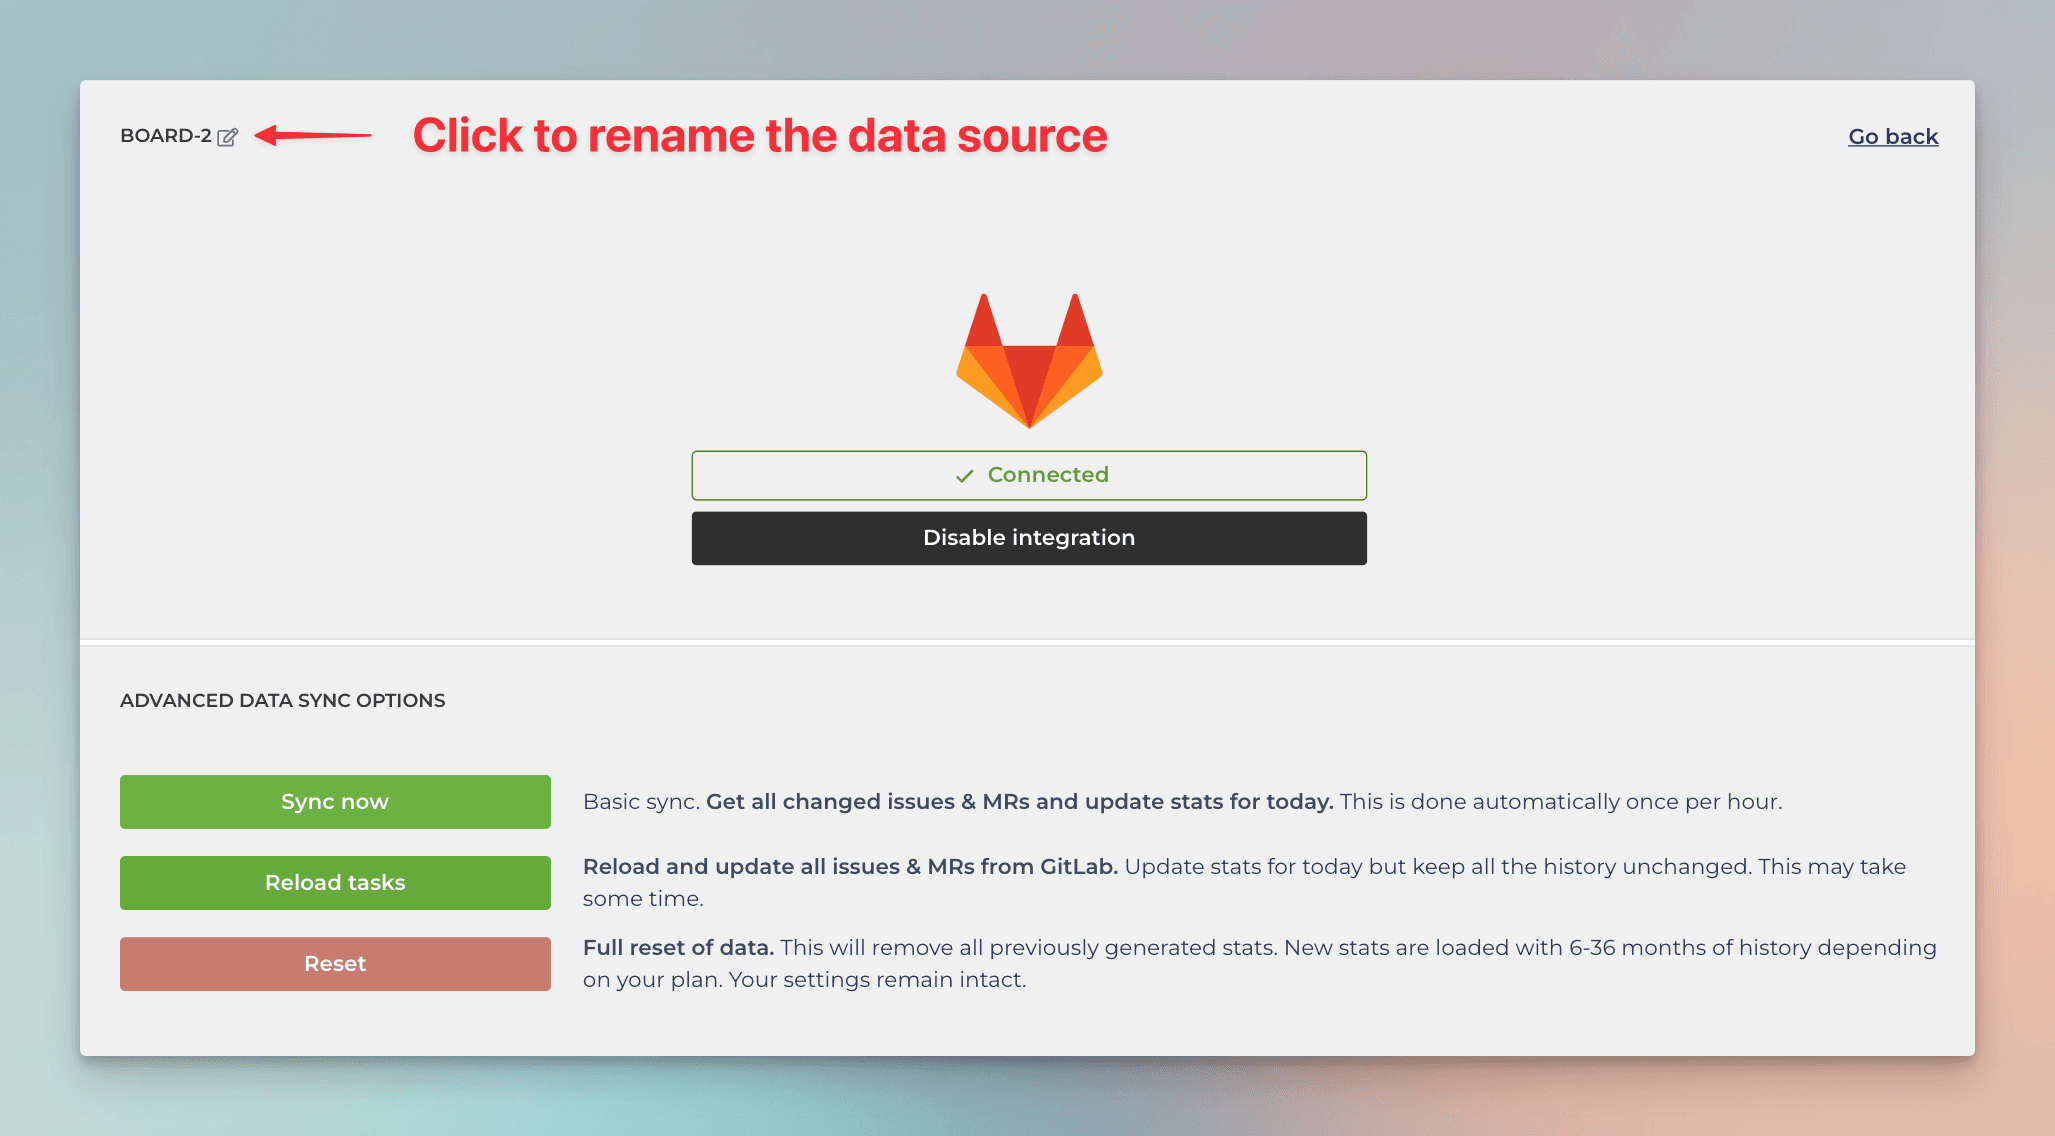
Clicking a data source reveals the Advanced data sync options:
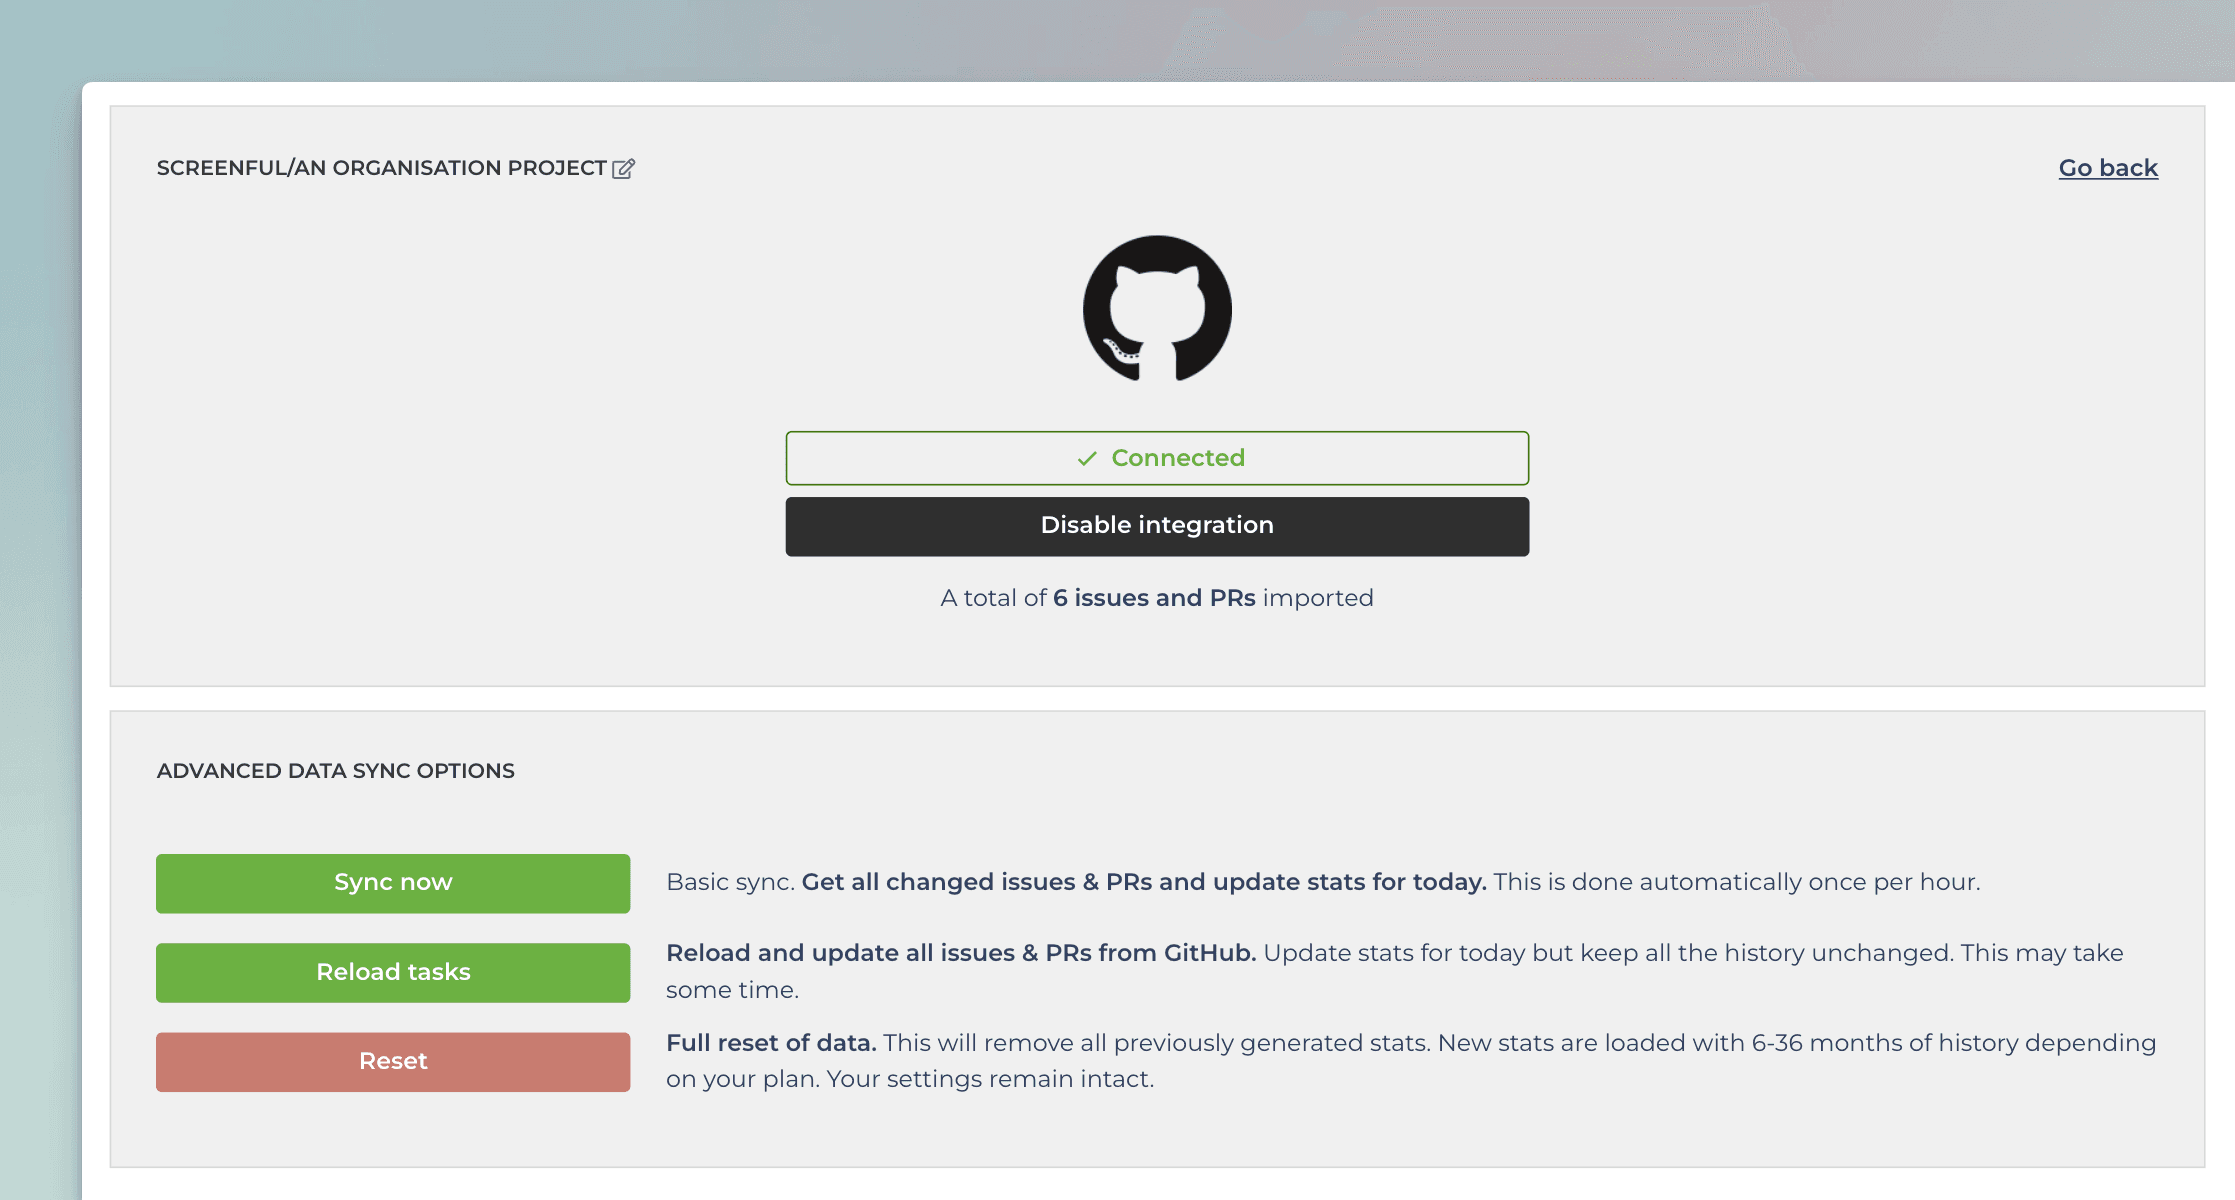
Clicking the Reset button starts the sync process, which can take minutes to complete depending on the size of the data source. A spinner icon appears on the top bar. Hoevering the mouse over the icon reveals the progress.
What does the data history mean?
We load all the tasks and all the history for each data source. You can create charts with all of your tasks in all plans. For example, you can create a Task list that contains all the tasks in the selected data sources.
When you create a chart that shows a historical trend, the length of the history is limited according to the plan. For example, 12 months of data history means that the trend can extend a maximum of 12 months into the history.
You can see the plans and their limits on the pricing page.
Renaming a data source
You can rename data sources by first selecting Integrations from the main menu on the top right:
Select the tool to see the imported data sources, and then click the data source from the list:
The data source settings page is shown, and you can click the edit icon next to the data source name to enter a new name:
Learn more
Book a free onboarding call
Need help with setting up your charts and reports? Don't find a metric you are looking for? Book a call with our expert. We'd love to help you supercharge your reporting!


