
Tracking GitHub Pull Requests with Screenful
Feb 8, 2025
GitHub provides a robust system for handling pull requests, but tracking progress and gaining insights into team performance can be challenging. Screenful is a powerful analytics and reporting tool for GitHub that helps teams track key metrics related to pull requests.
Contents:
Why to track Pull Requests?
Managing pull requests efficiently is crucial for development teams to ship on time and ensure high code quality. Tracking and quantifying your pull requests (PRs) offers several benefits, including:
Improved Code Review Process: Identifying bottlenecks in the review process ensures faster approval and merging.
Enhanced Team Productivity: Monitoring PR trends helps optimize team efficiency.
Reduced Merge Conflicts: Keeping track of open PRs helps prevent conflicts and stale branches.
Read on to learn how to get automated insights from your GitHub pull requests data.
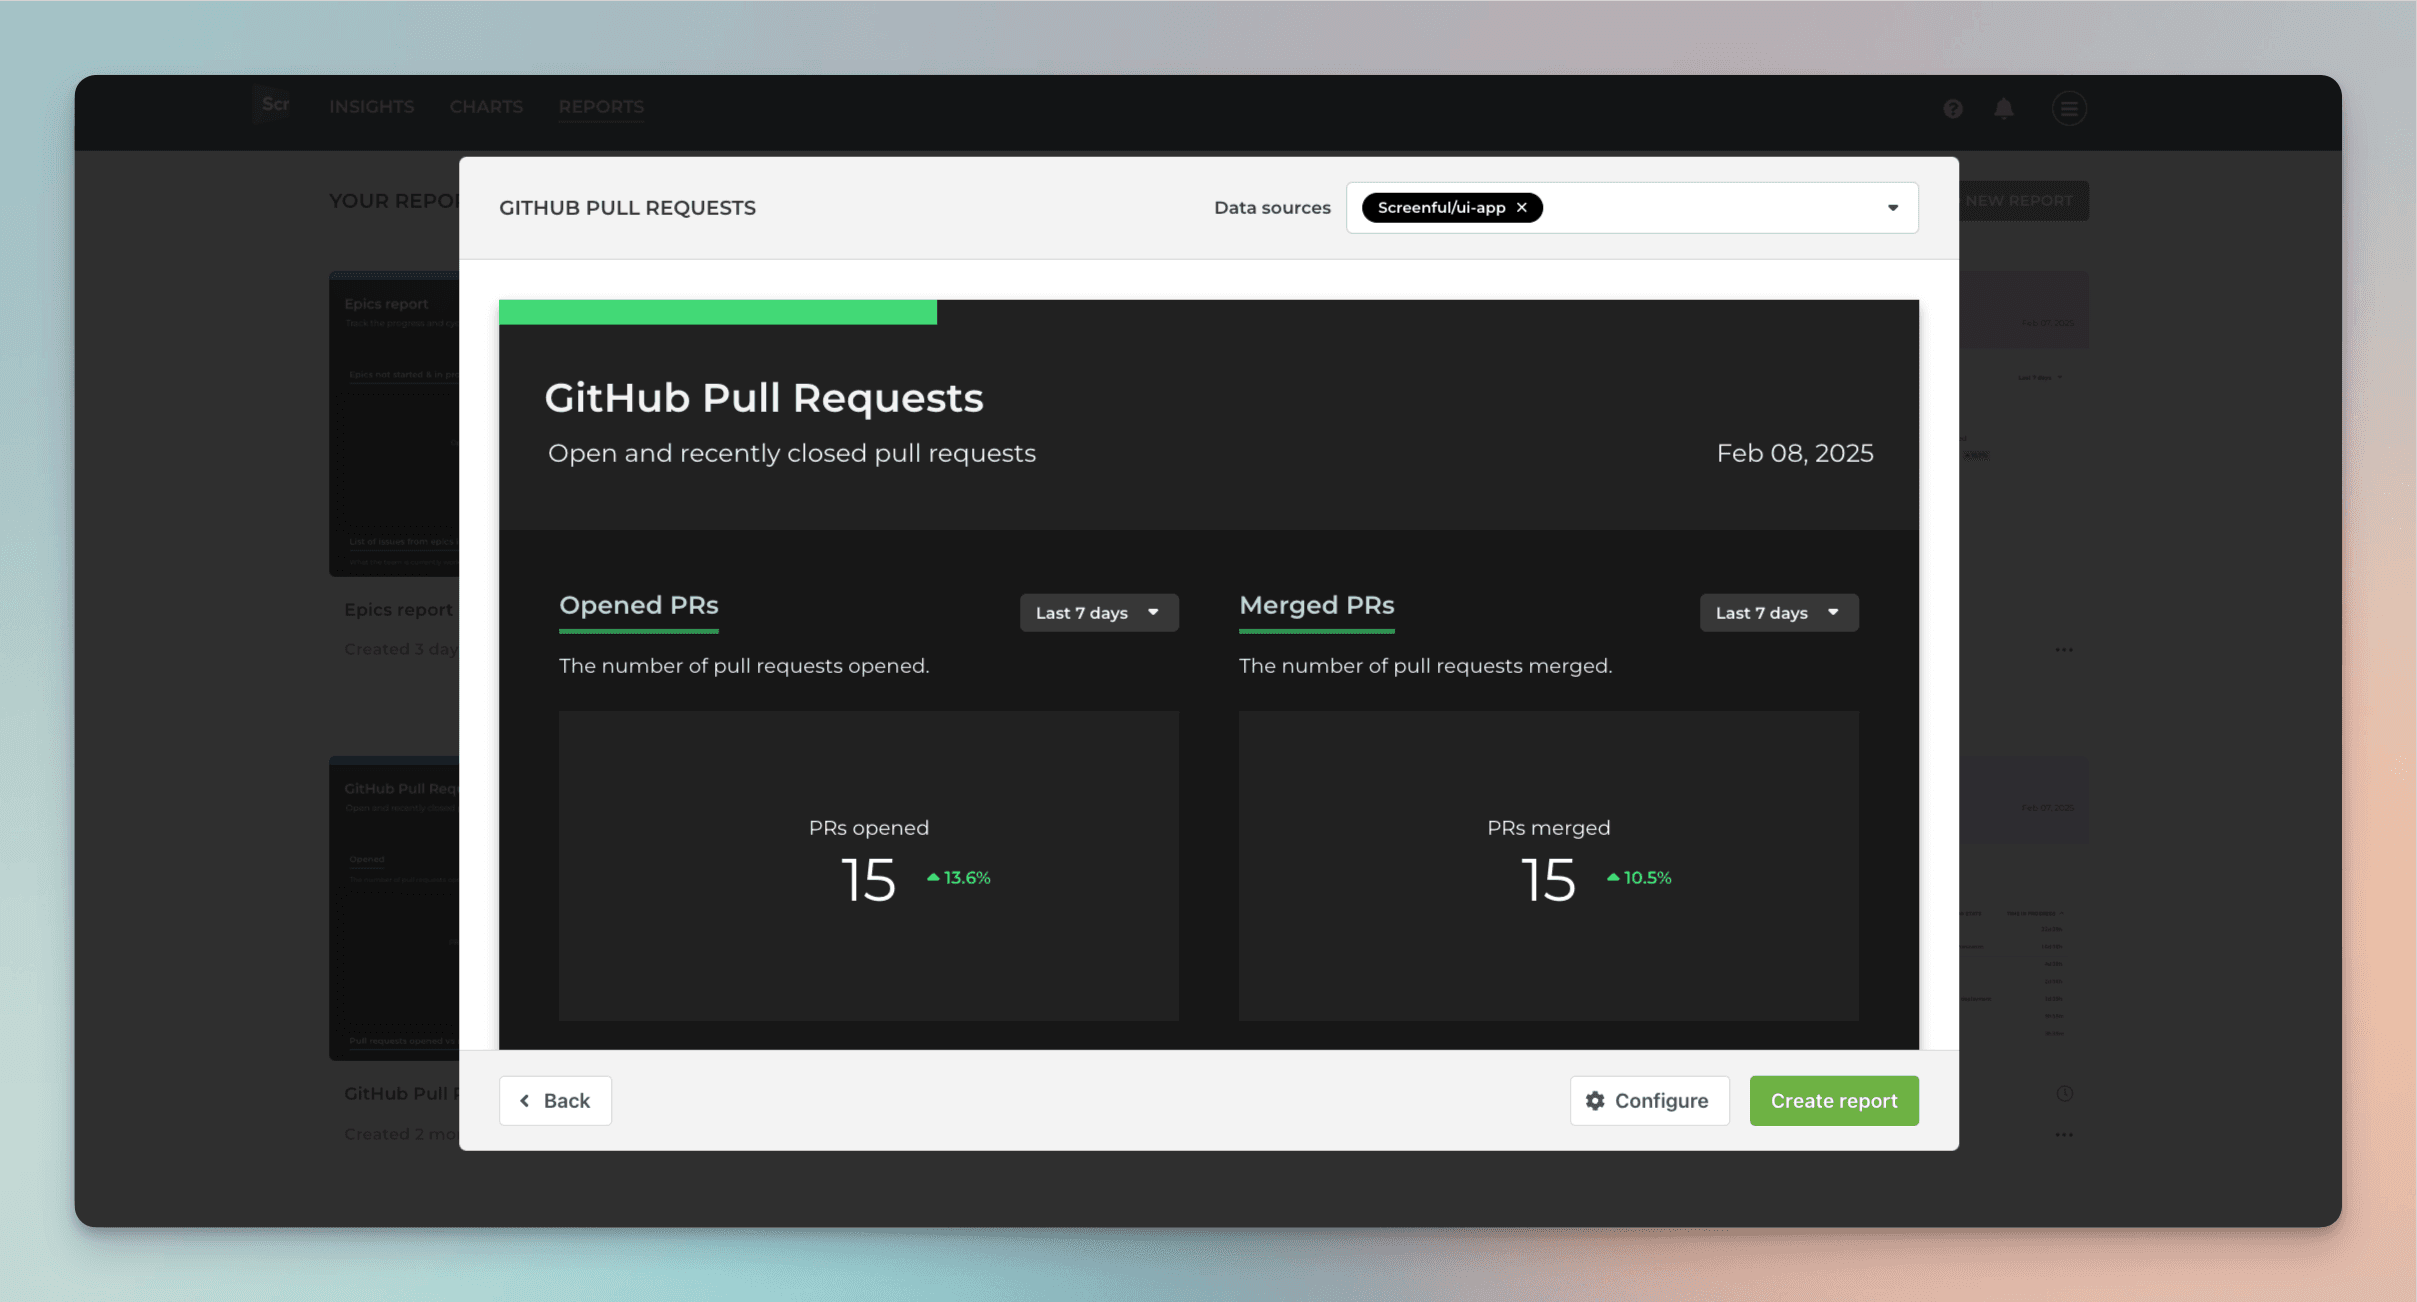
Track PR opened vs merged
See the number of pull requests opened vs merged.
The total number of PRs that have been created but not necessarily merged yet.
The number of PRs that have been successfully merged into the target branch (e.g., main or develop).
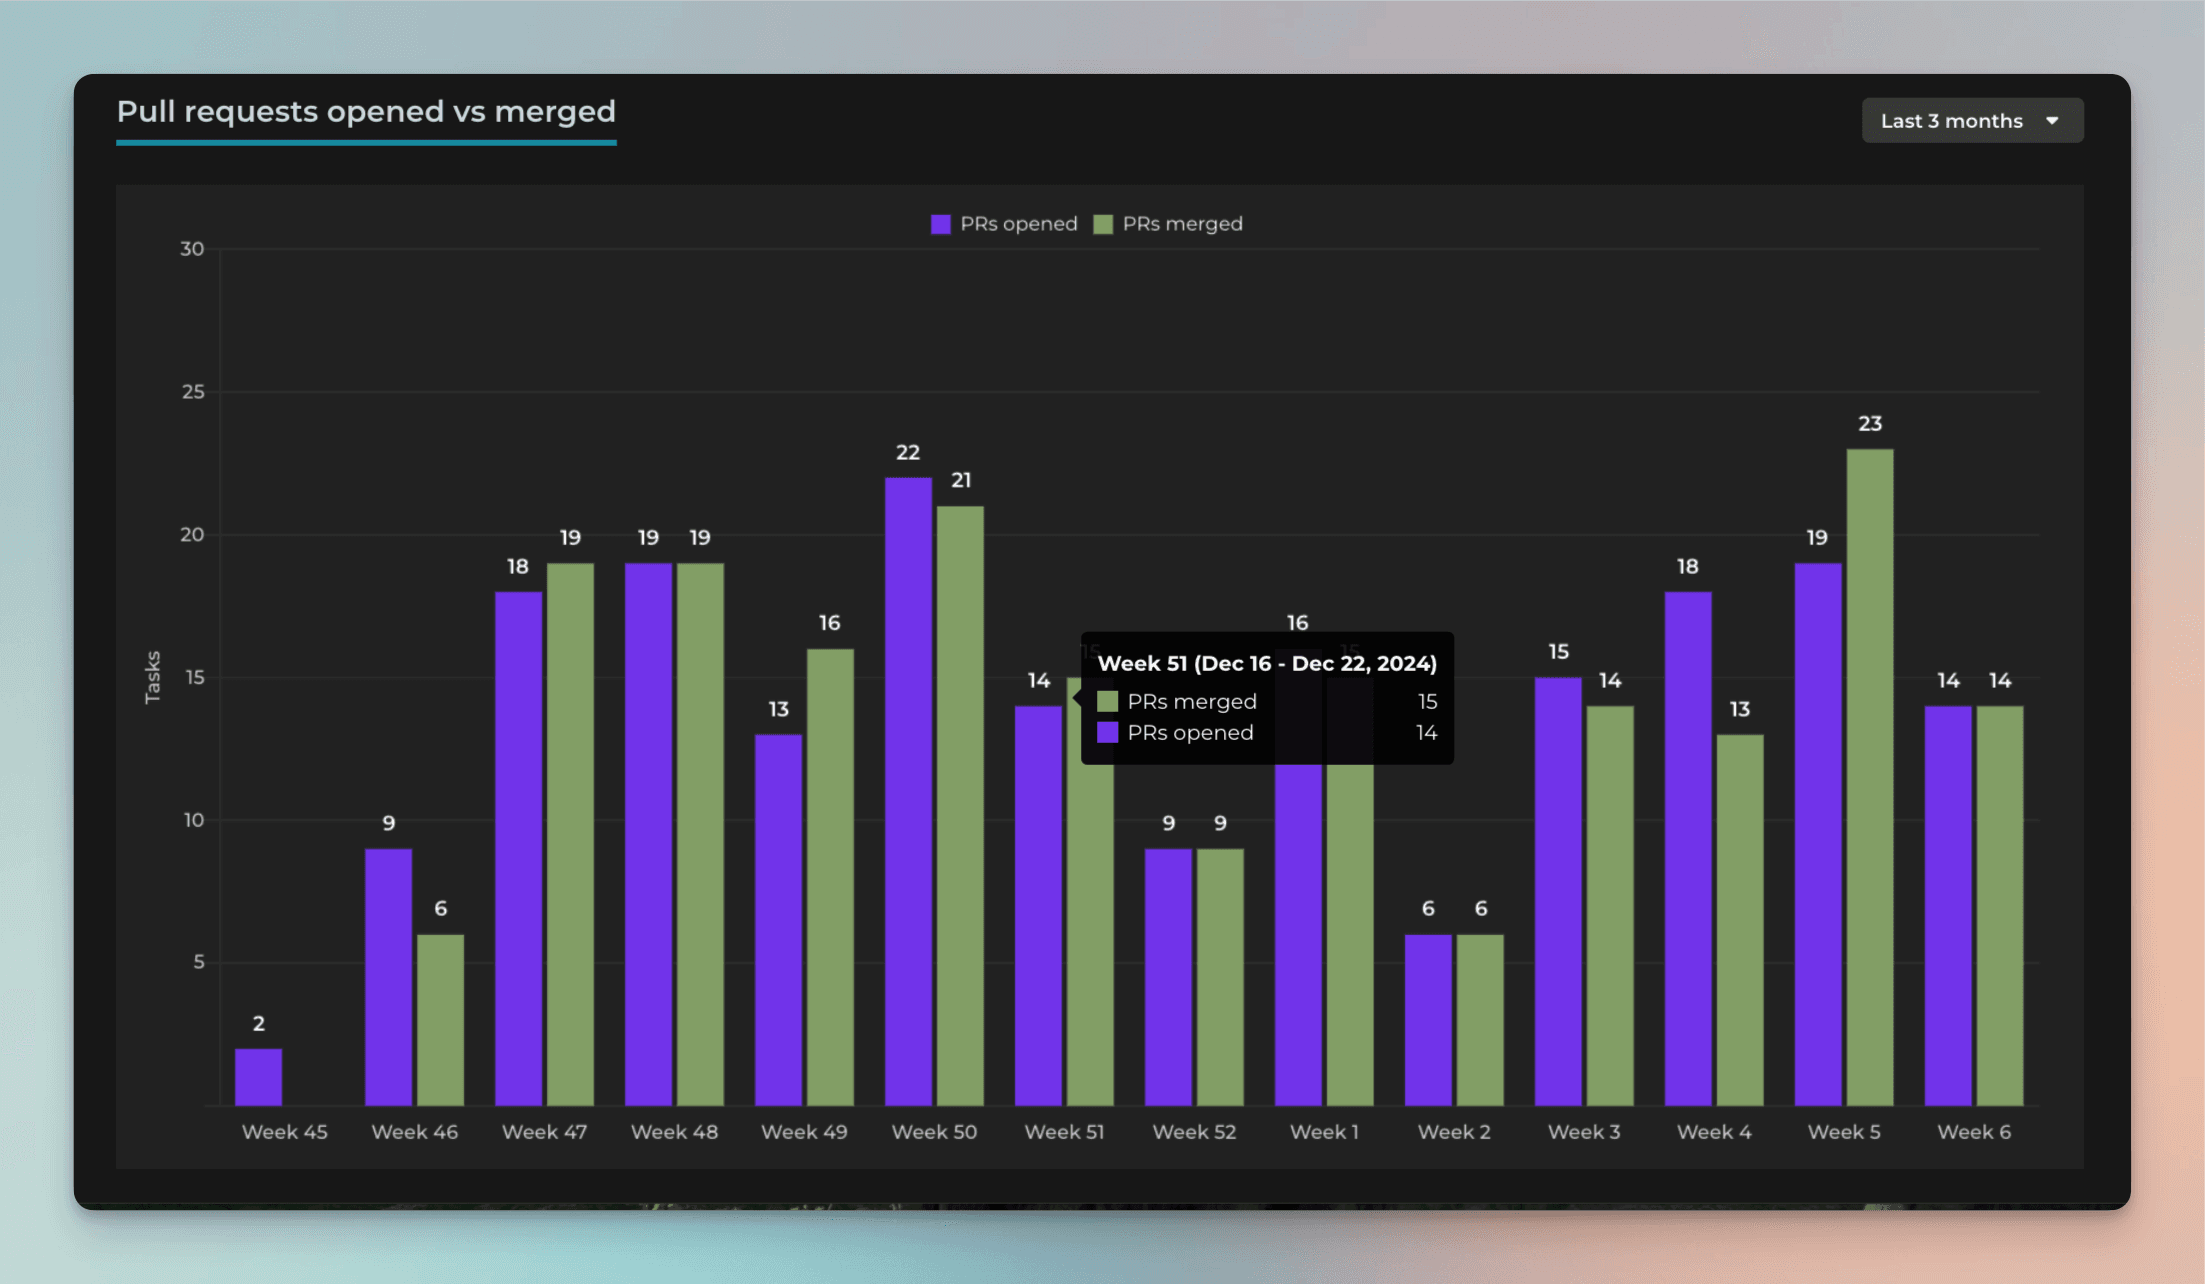
Are you opening more PRs than you can close?
Time to merge a pull request
To measure how long it took to merge a pull request in GitHub, you can use the scatter plot chart:
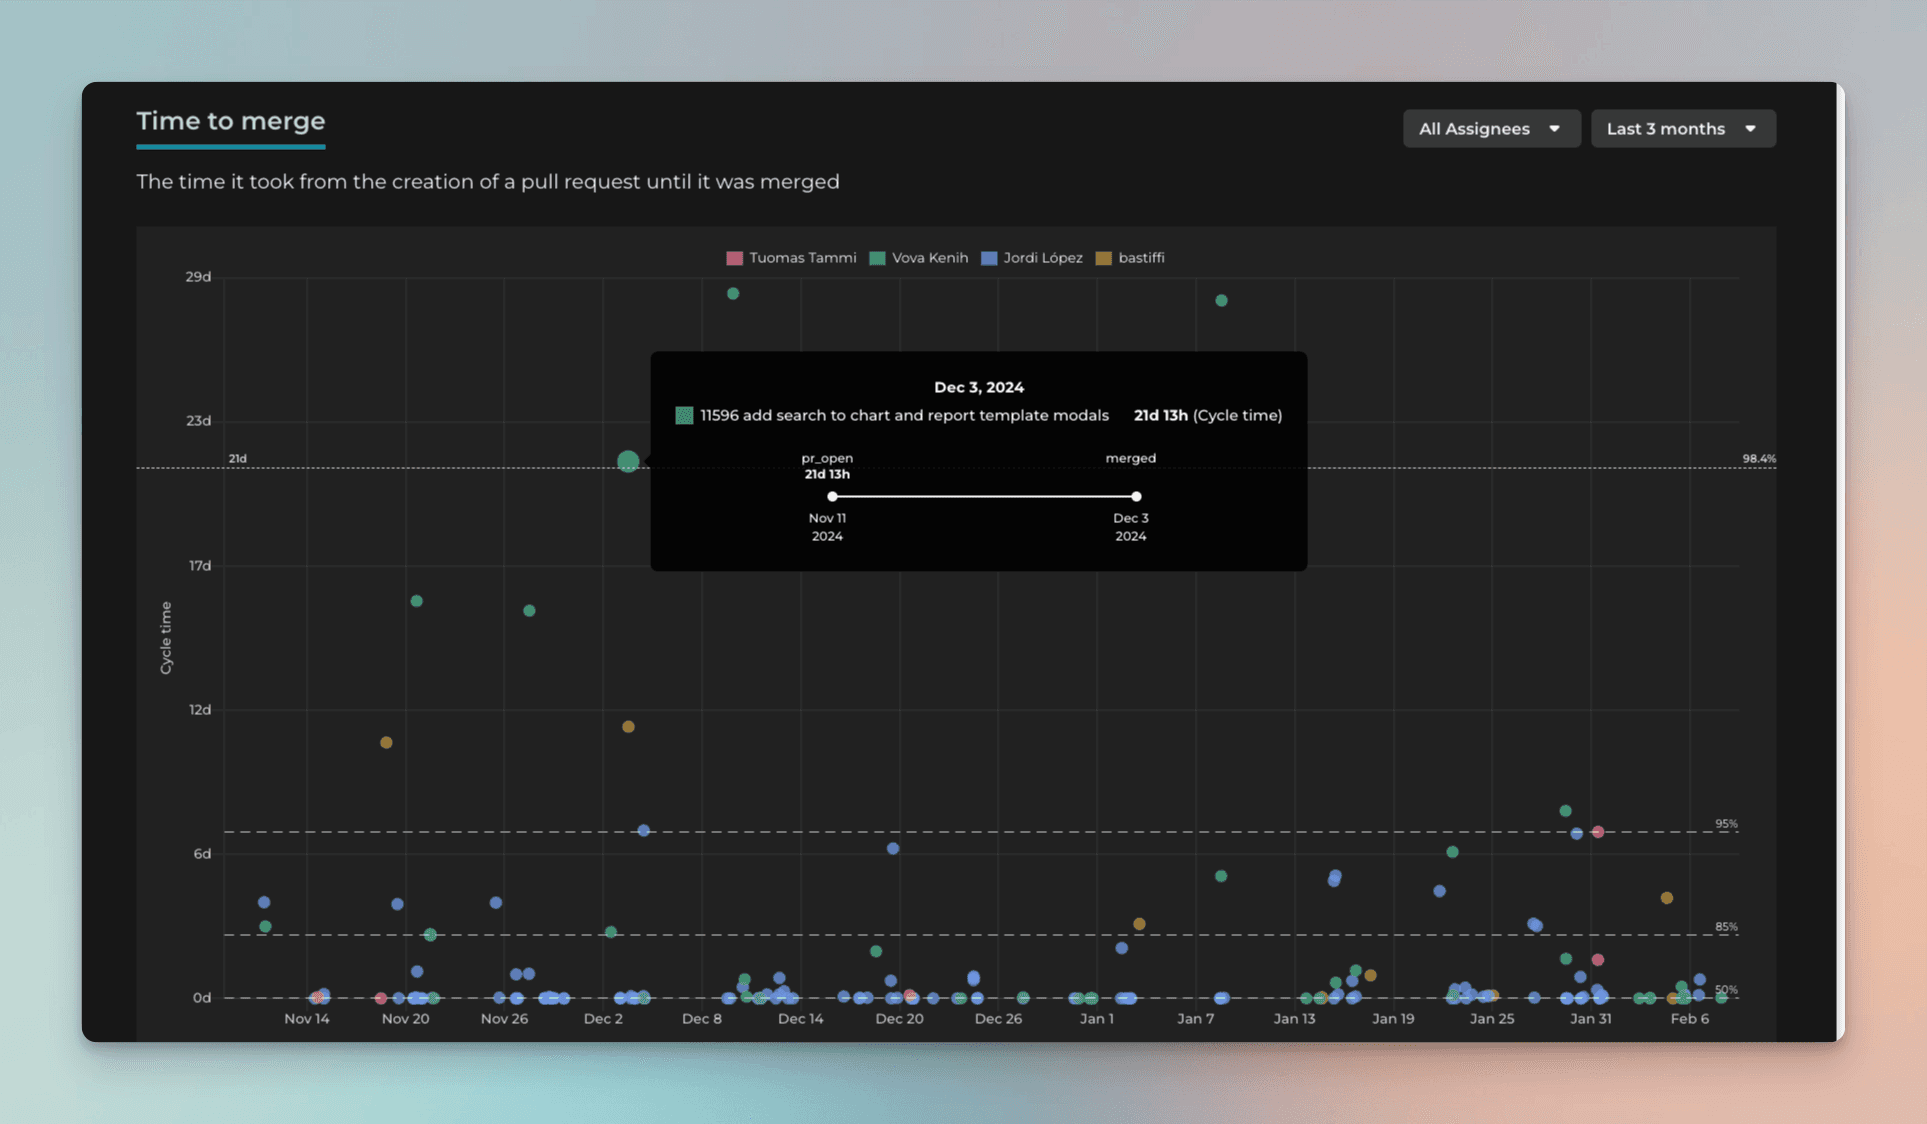
Each circle is a completed pull request. The horizontal line shows when a PR was closed. The vertical line shows how long it took to complete a PR. The higher the circle, the longer it took to complete it. You can see more detailed timings when you hover the mouse over the circle.
Track pull request review times
You can track pull request review times by adding pull request review time as a column in the Task list:
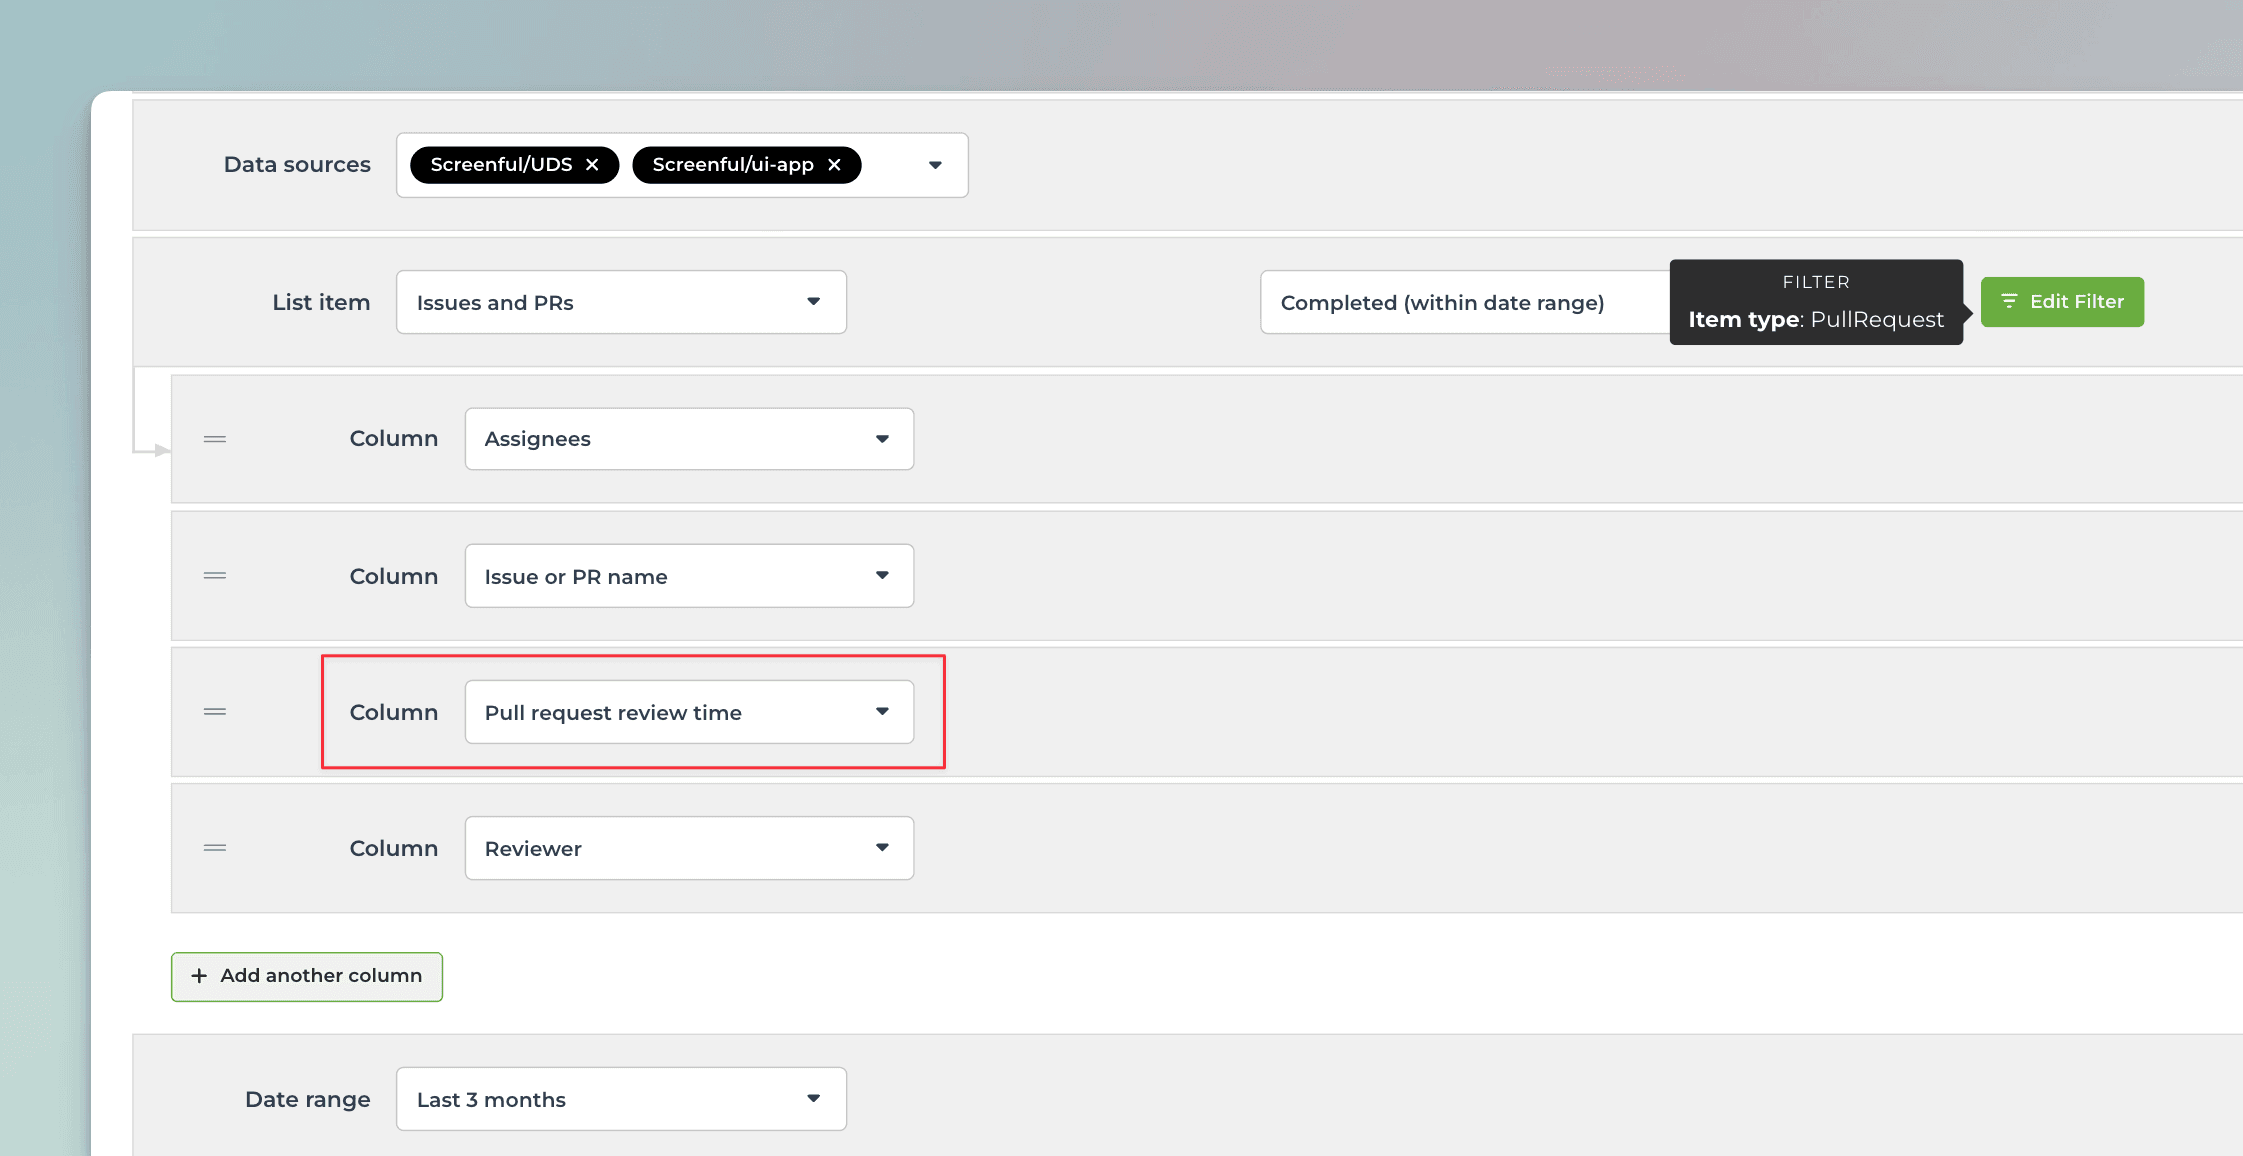
Note that I have set a filter item type -> PullRequest to include only pull requests in this chart. Here's the resulting task list:
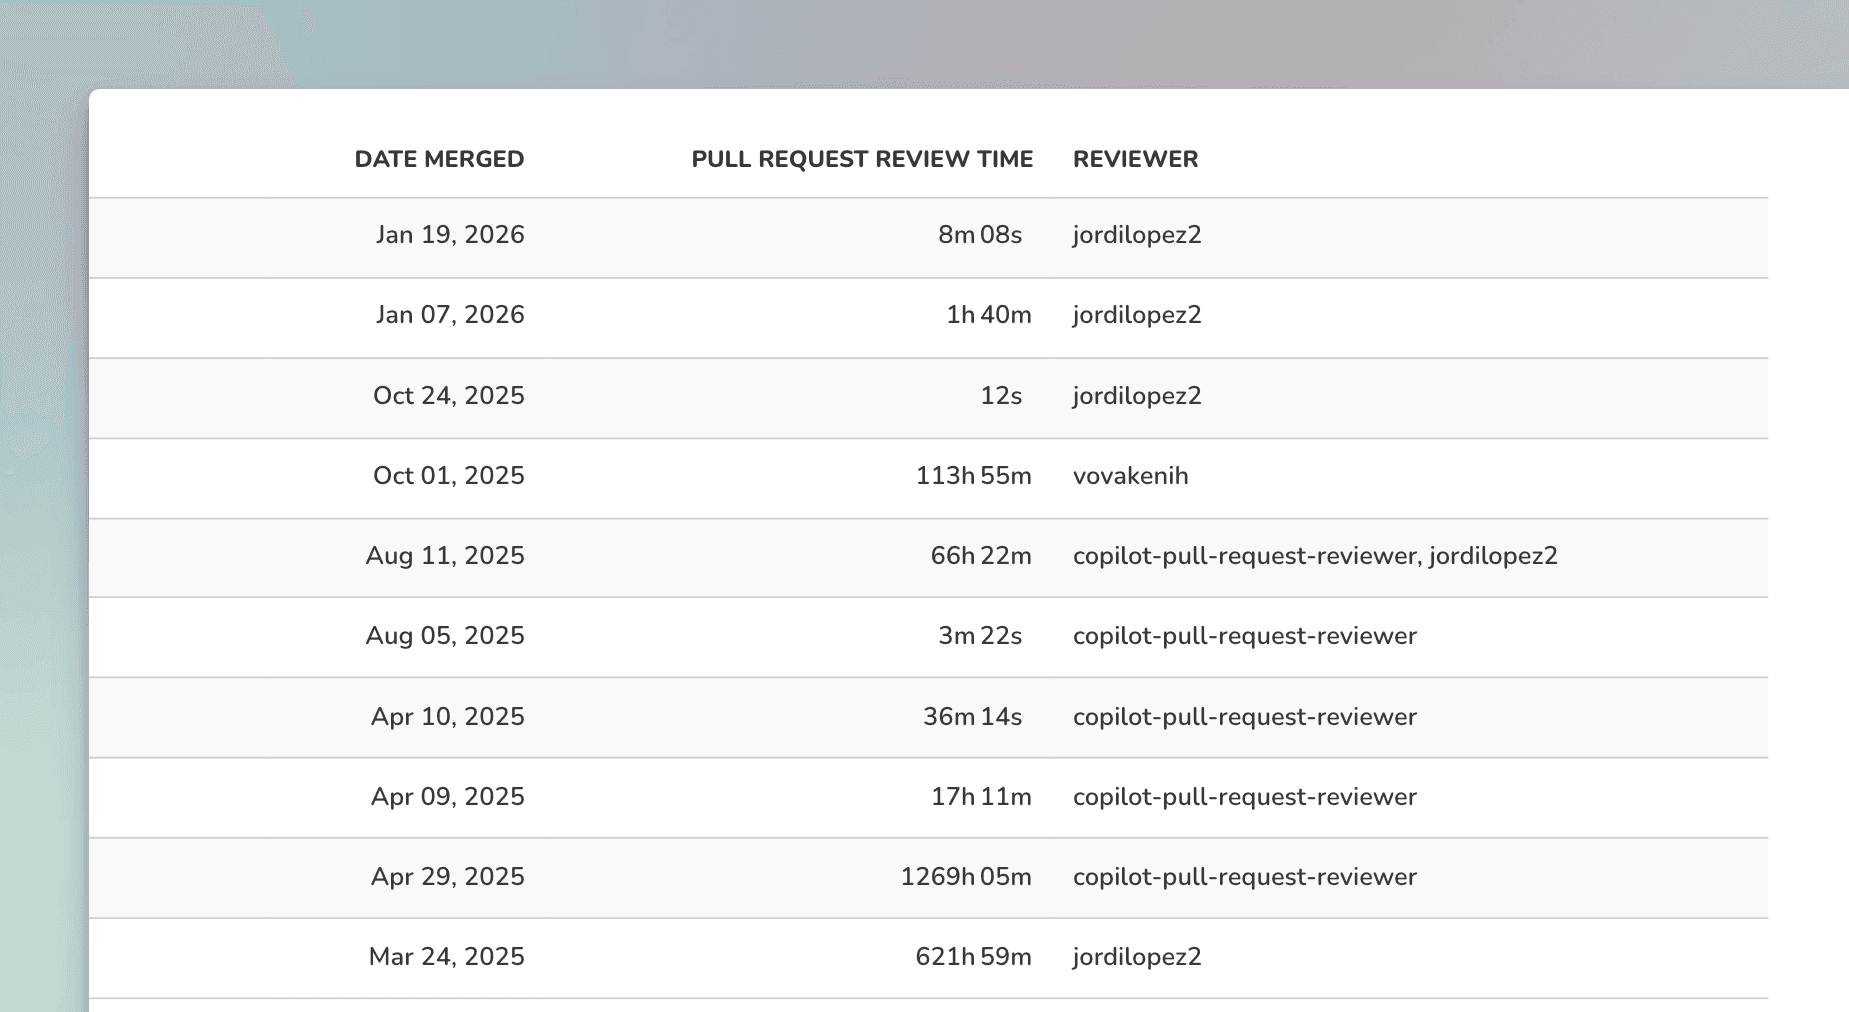
You can set the summary at the bottom to display either the sum, average, or median of the pull request times.
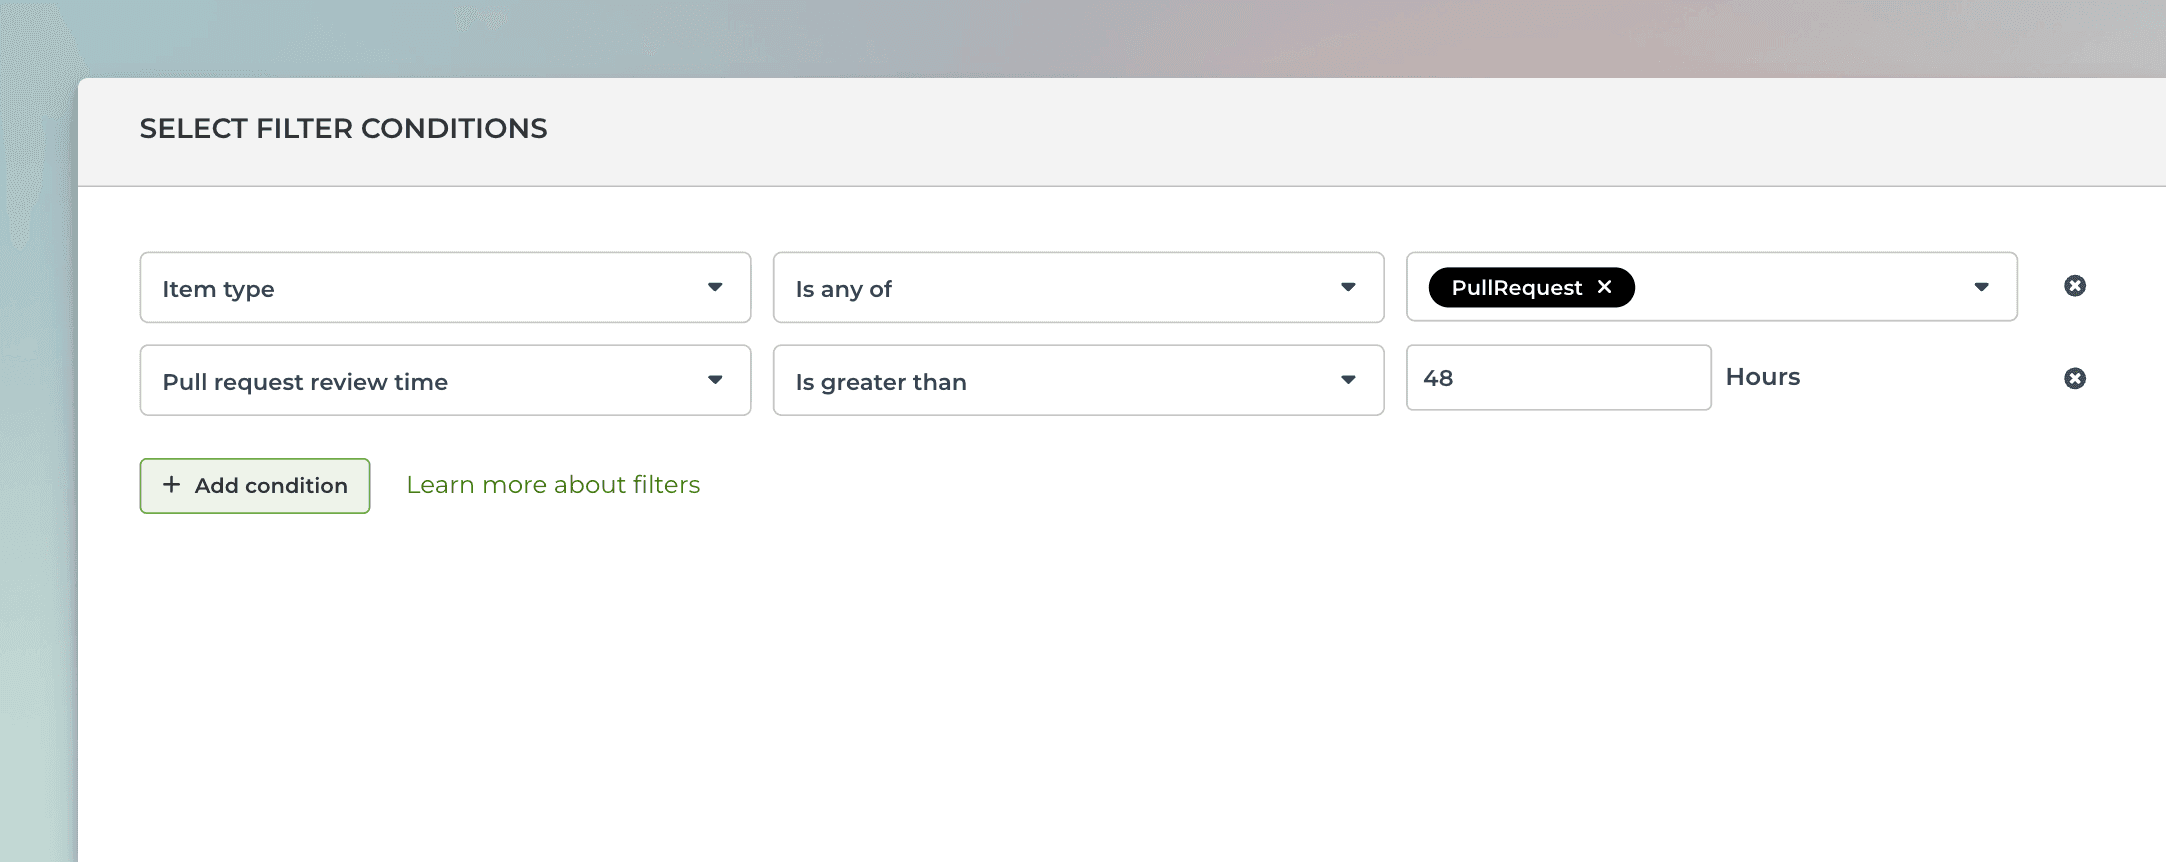
You can filter by Pull request review time to surface the ones that are taking longer than expected:
Create custom charts using issues and pull requests
You can create charts based on issues or pull requests. Here’s an example Task List that contains both issues and pull requests of a GitHub repository:
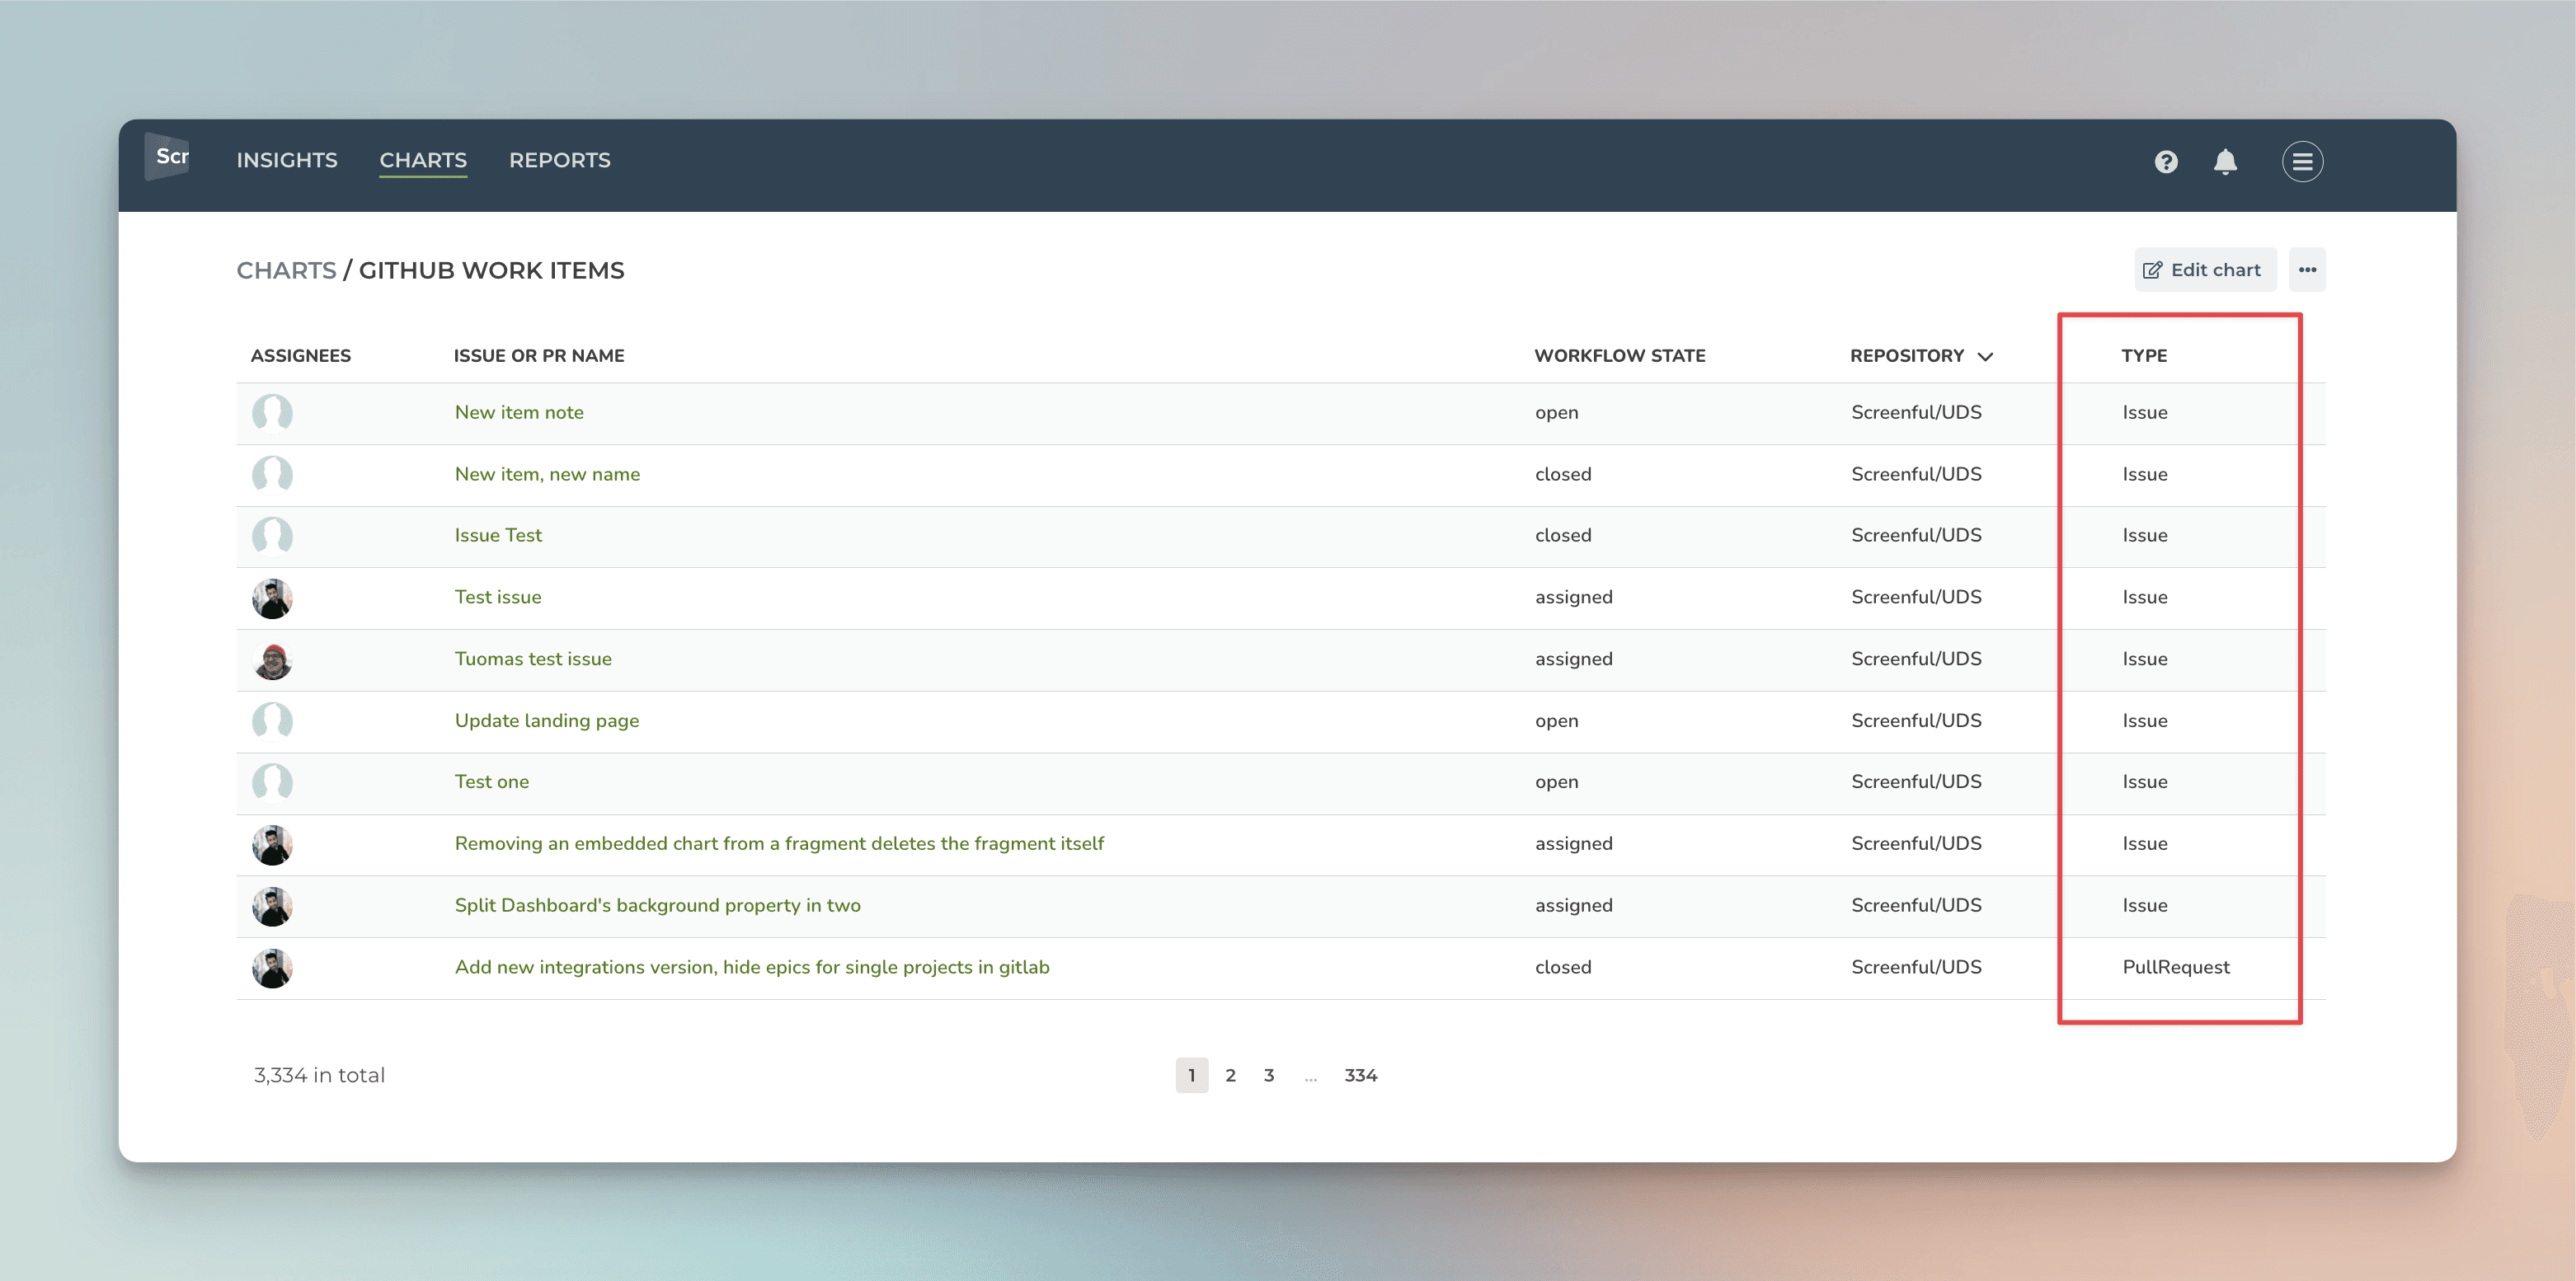
The highlighted column shows the item type: Issue or Pull request.
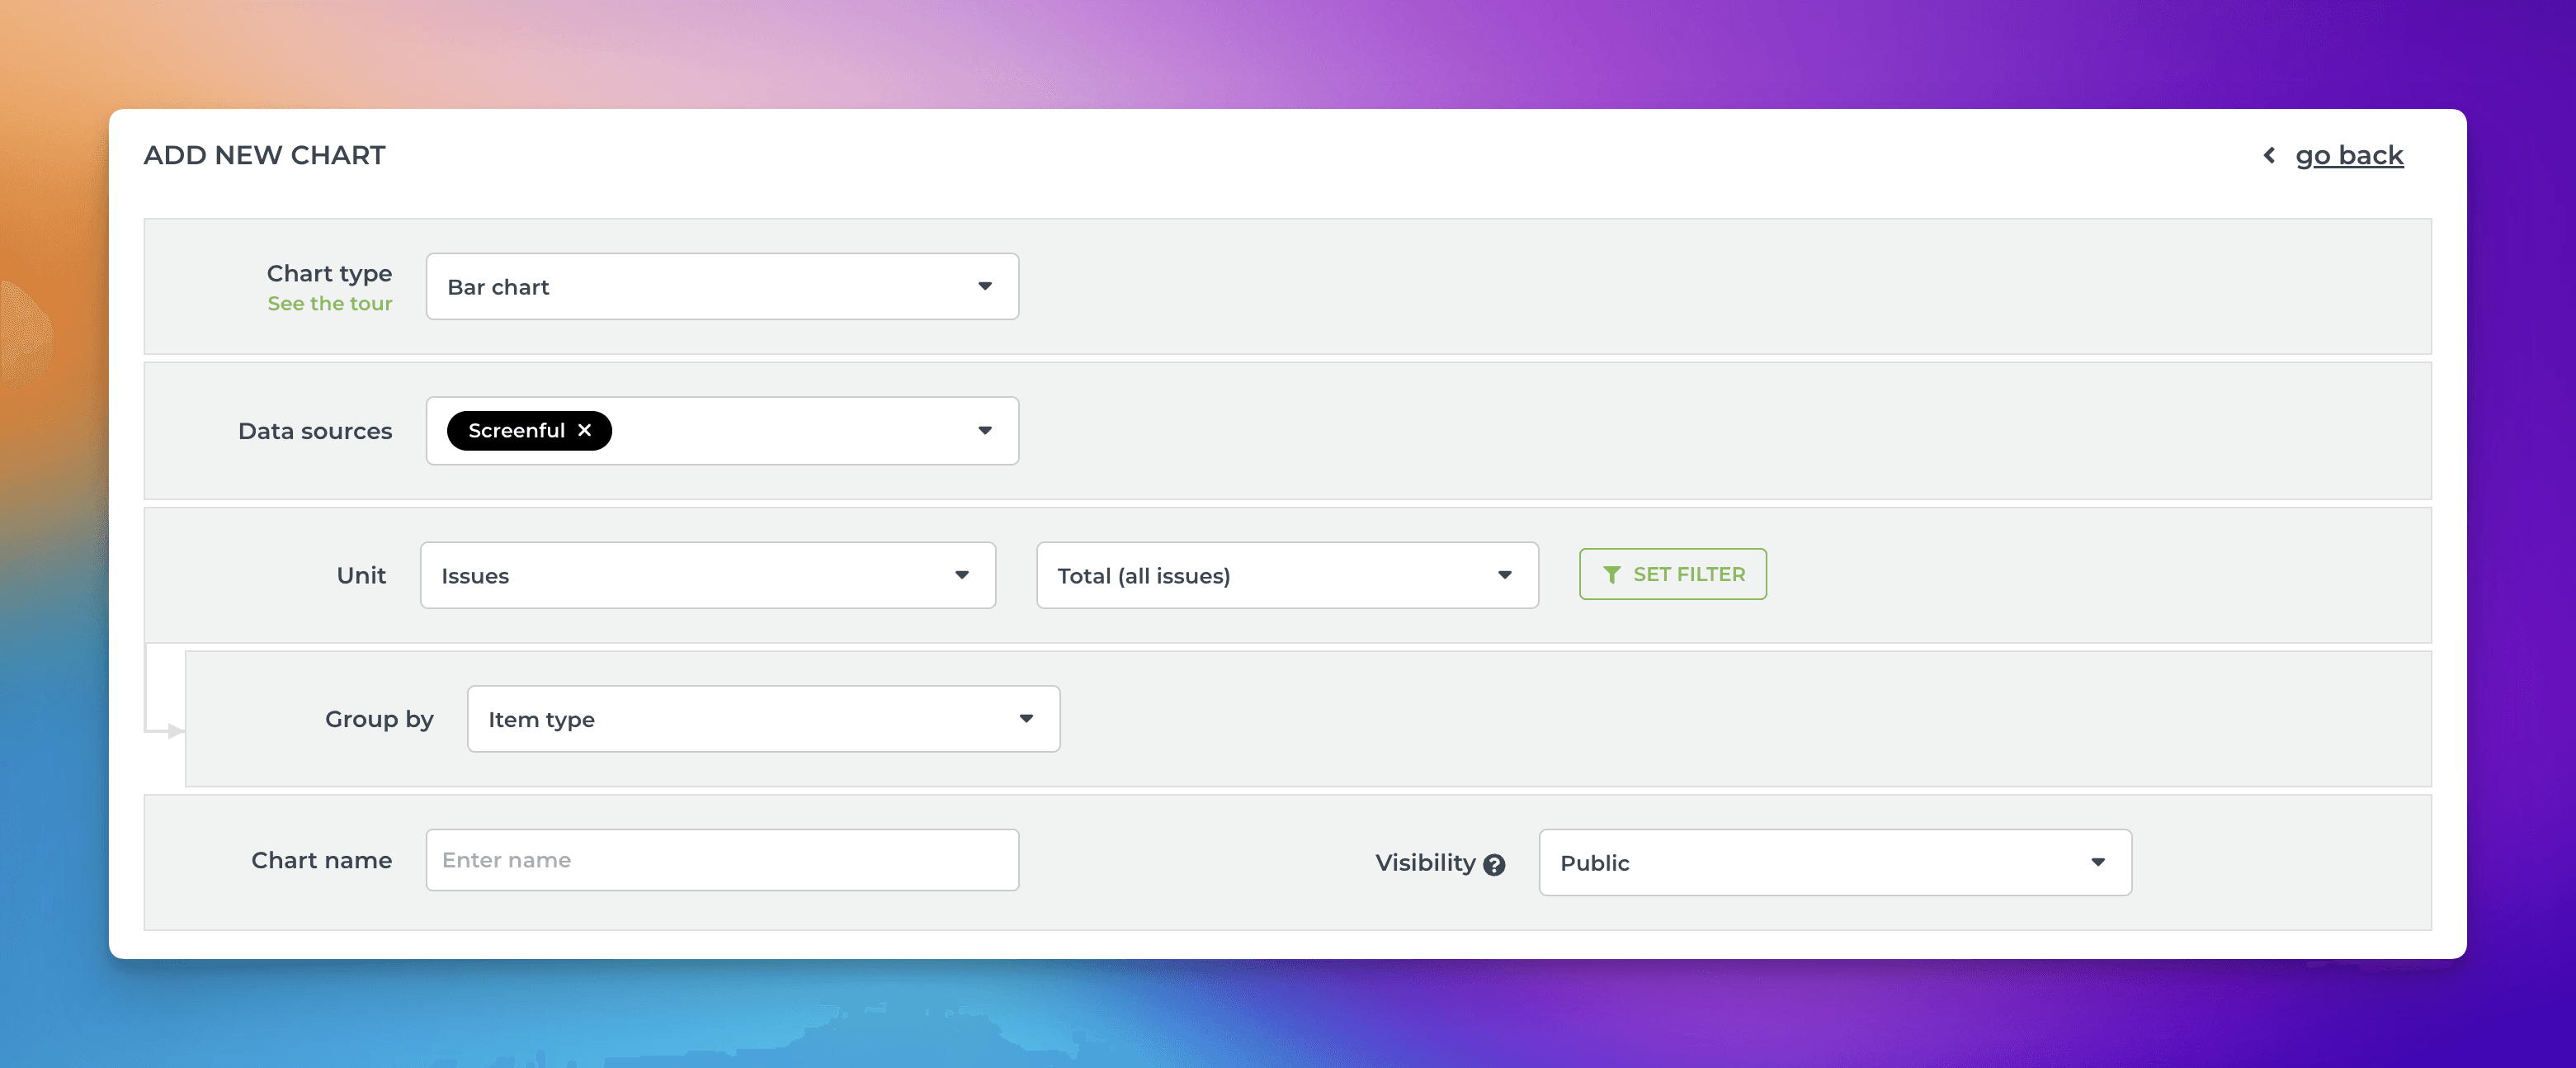
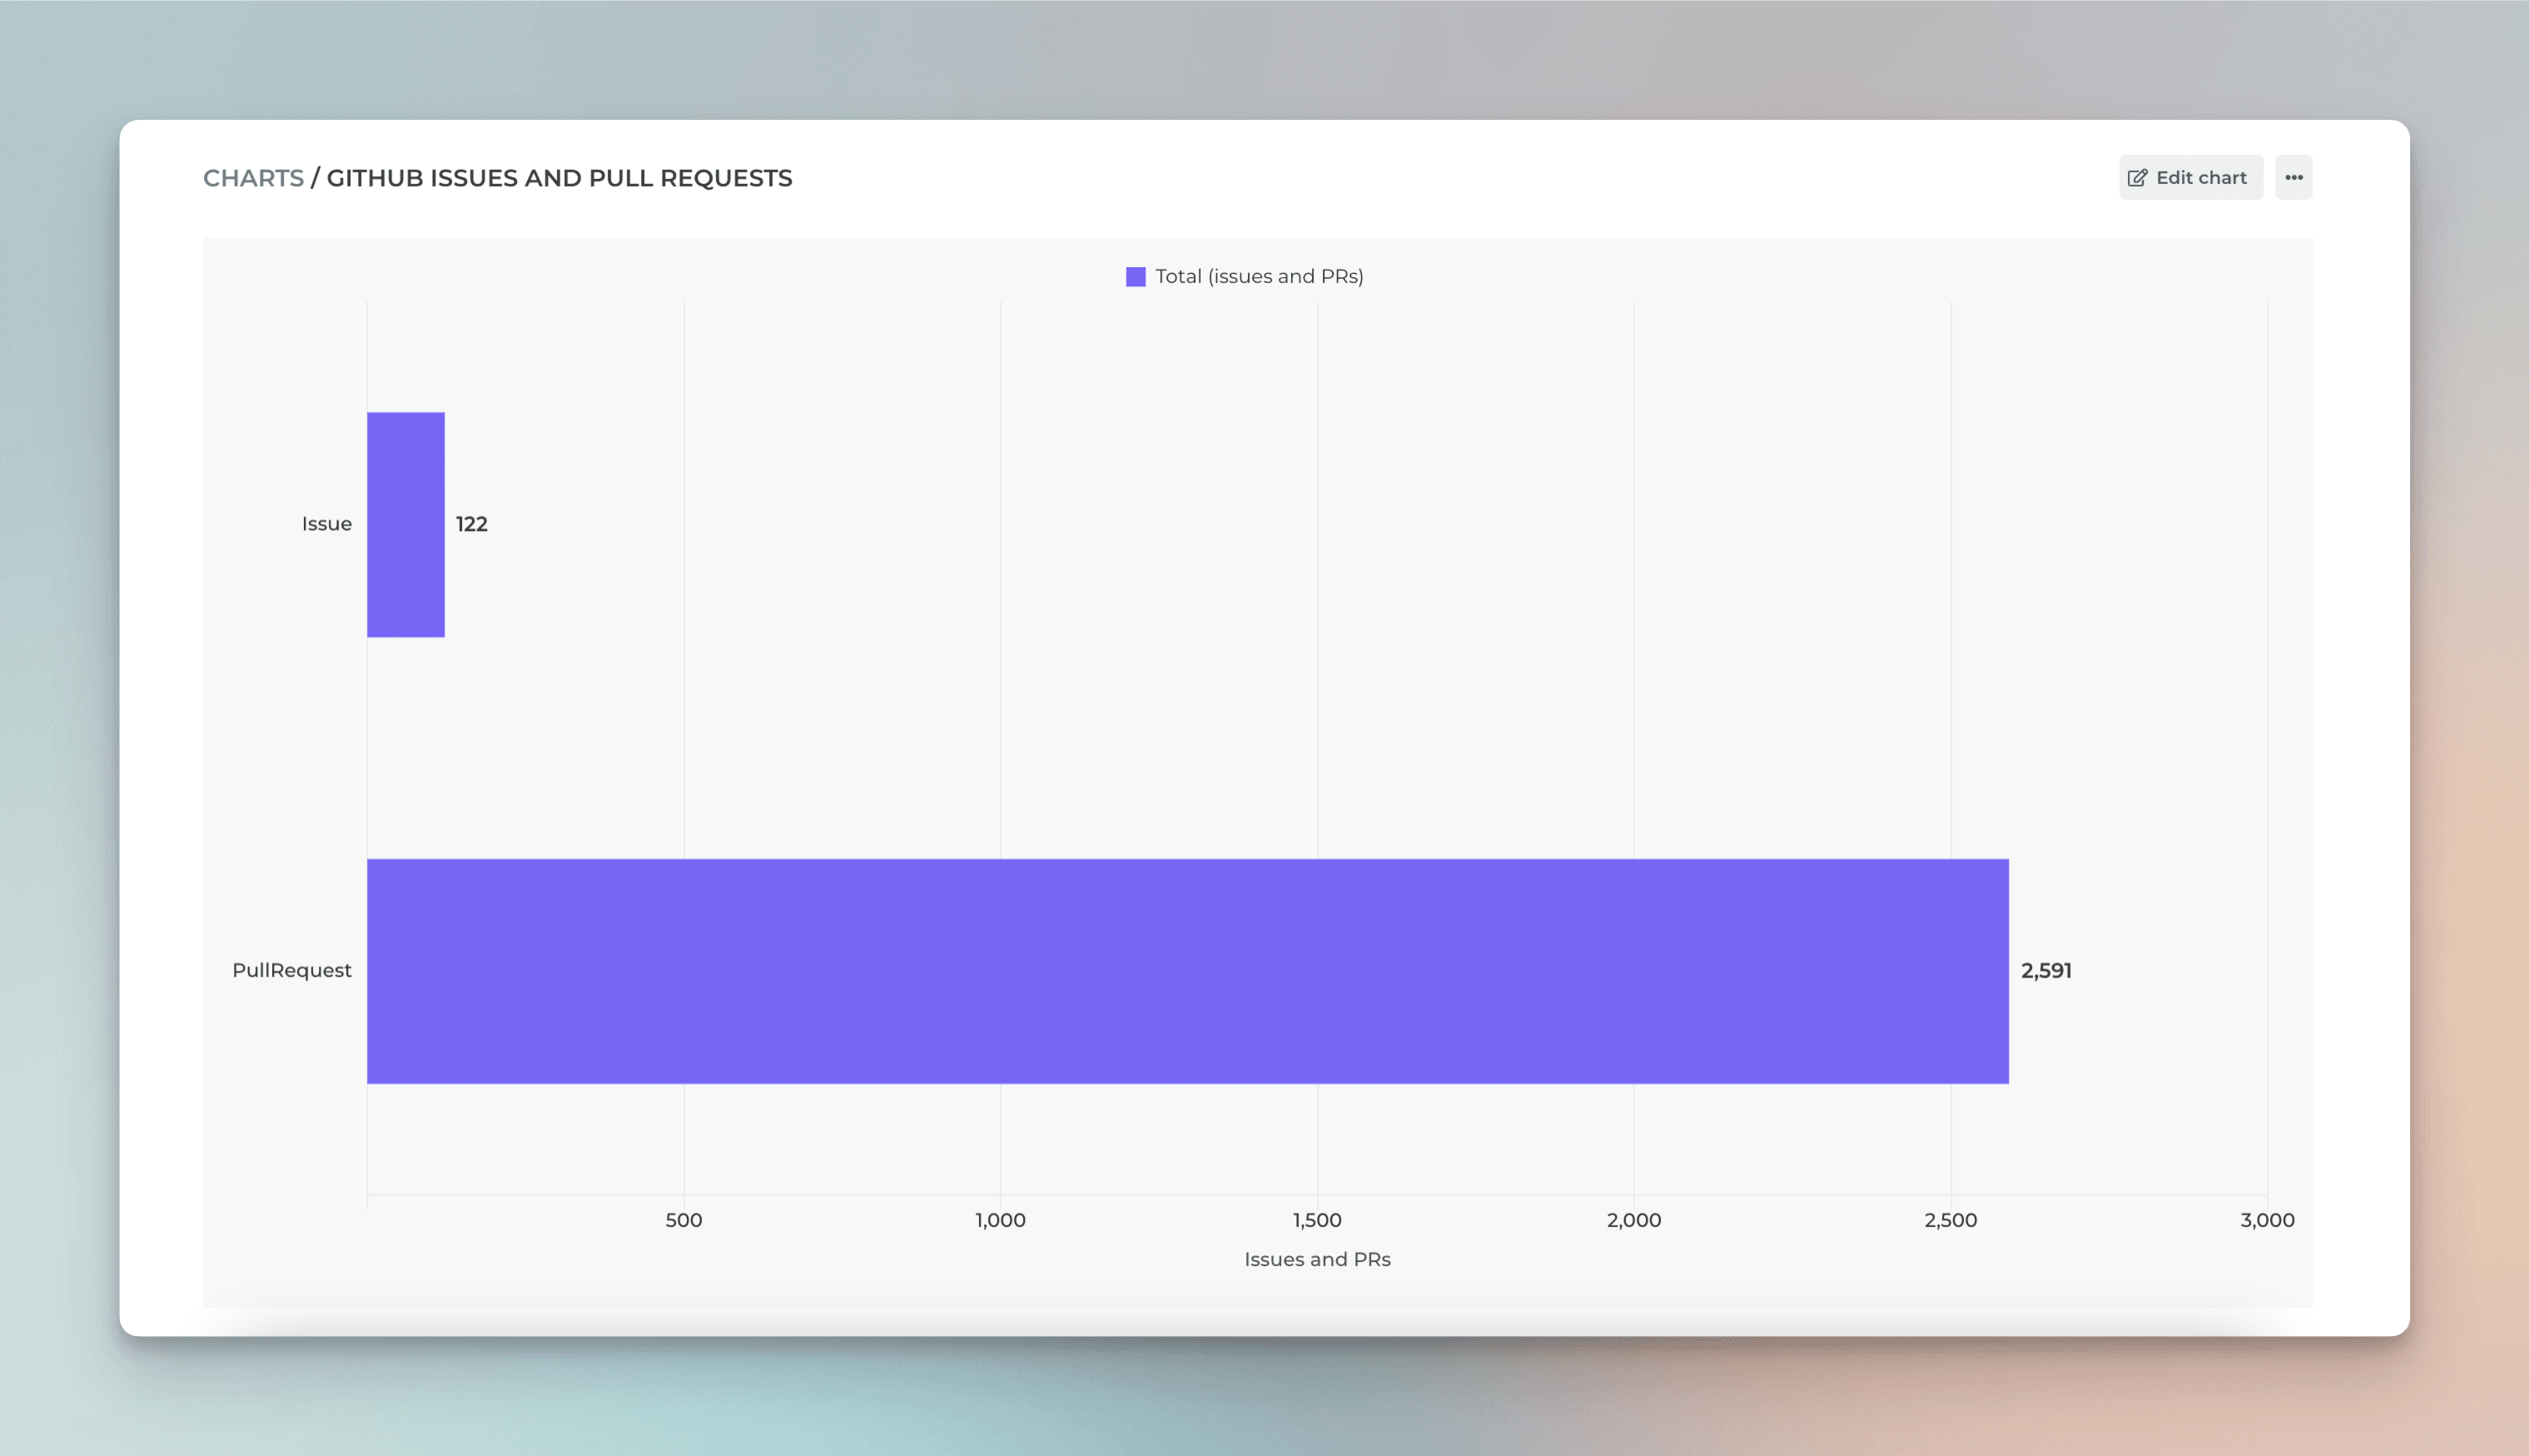
With the charts that support grouping, you can also group data by item type. This can be helpful if you want to track the number of issues and pull requests in your projects:
Here’s the resulting chart:
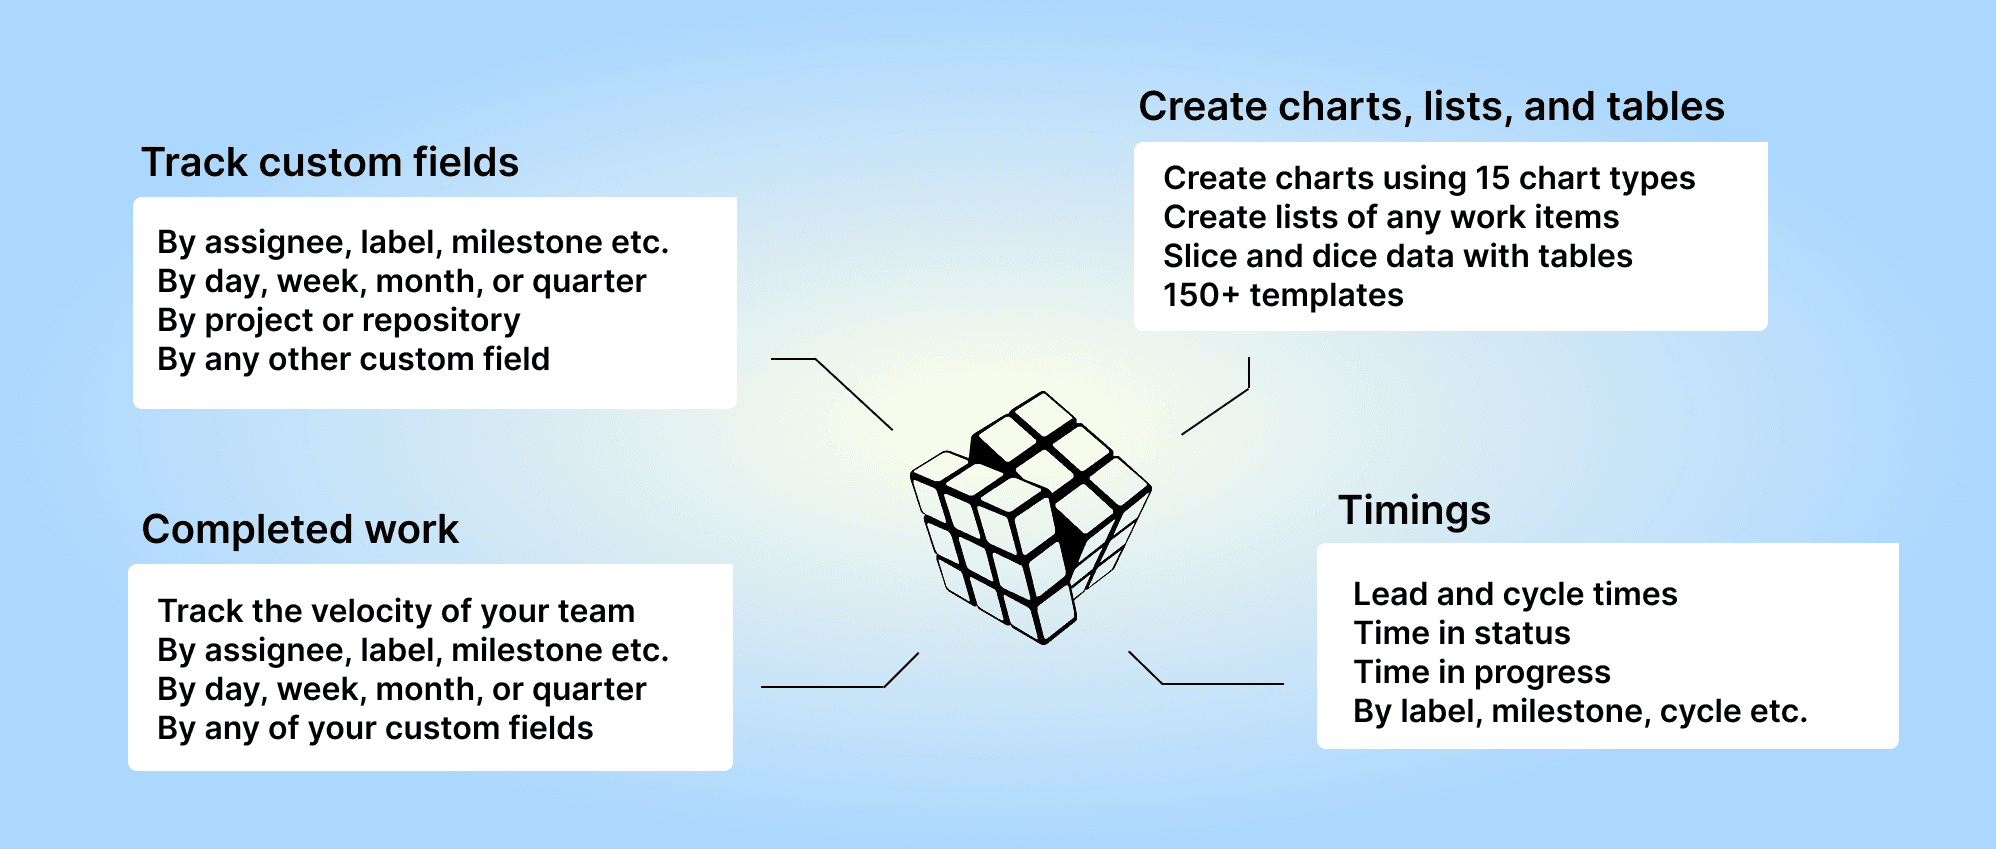
When creating charts, you can choose from 15 chart types and use data from any of your custom fields.
By default, Screenful shows both issues and pull requests. When you are editing a chart, you can include or exclude either one using the item type filter:
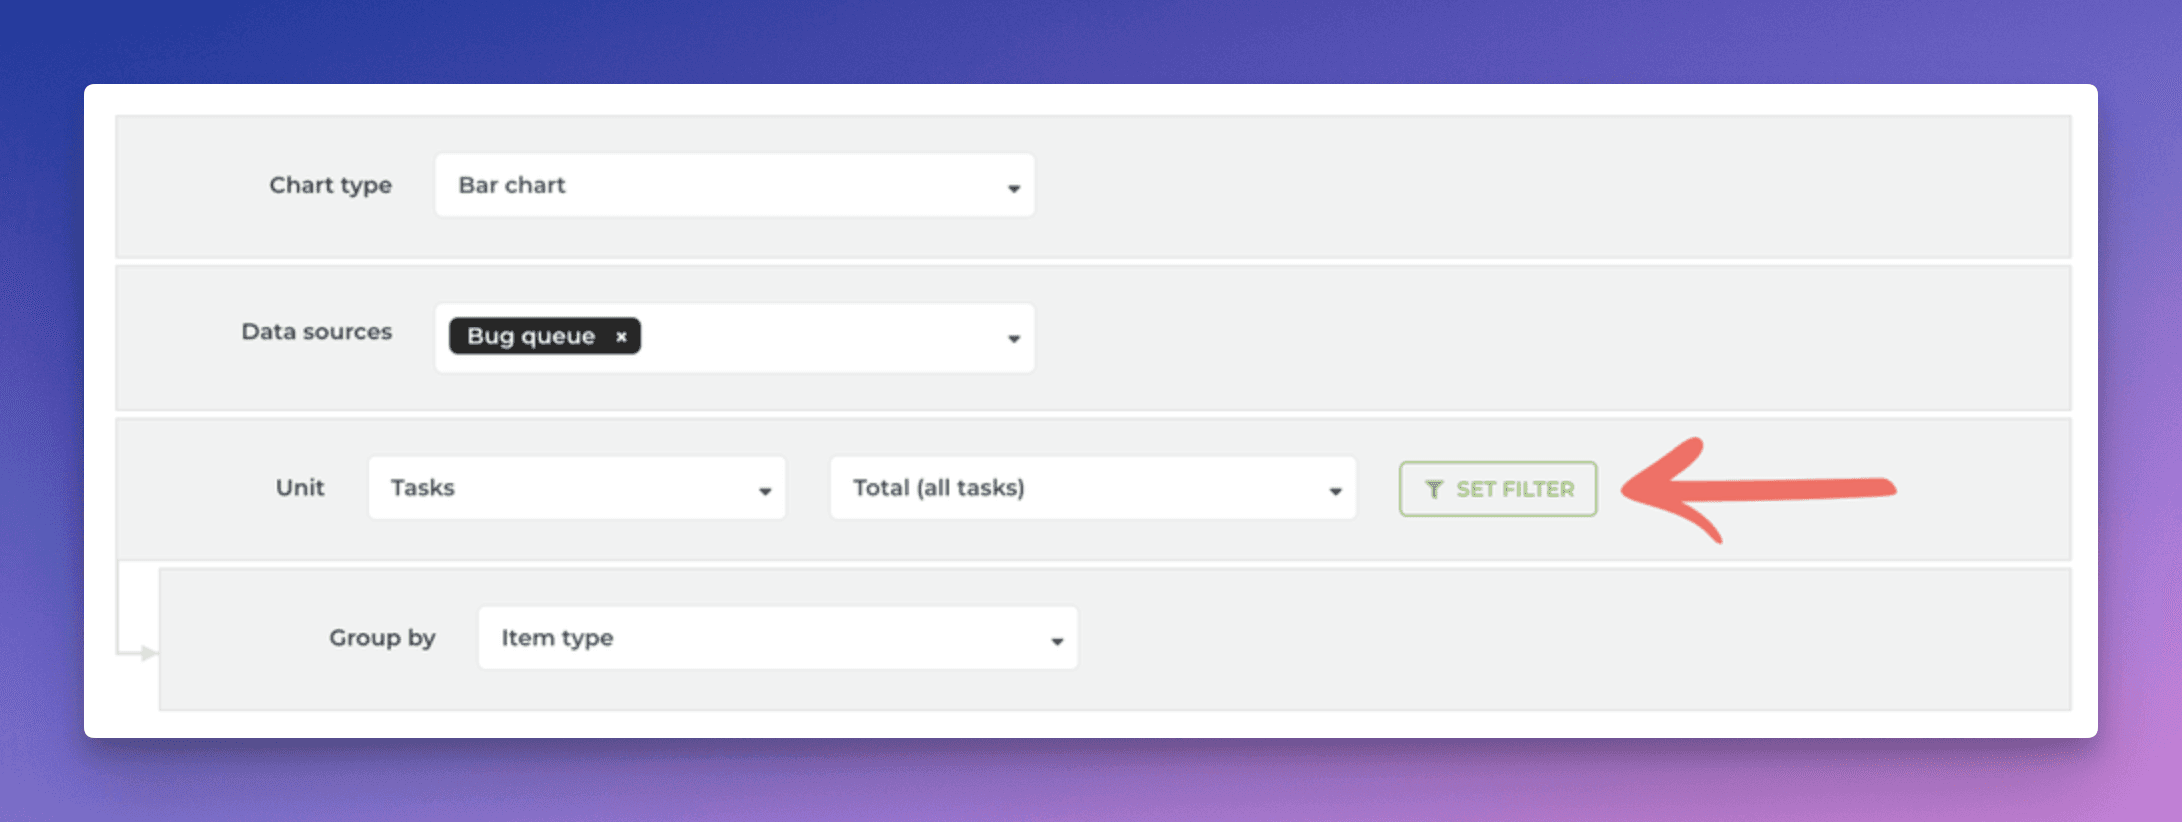
Clicking Set filter opens the filter modal:
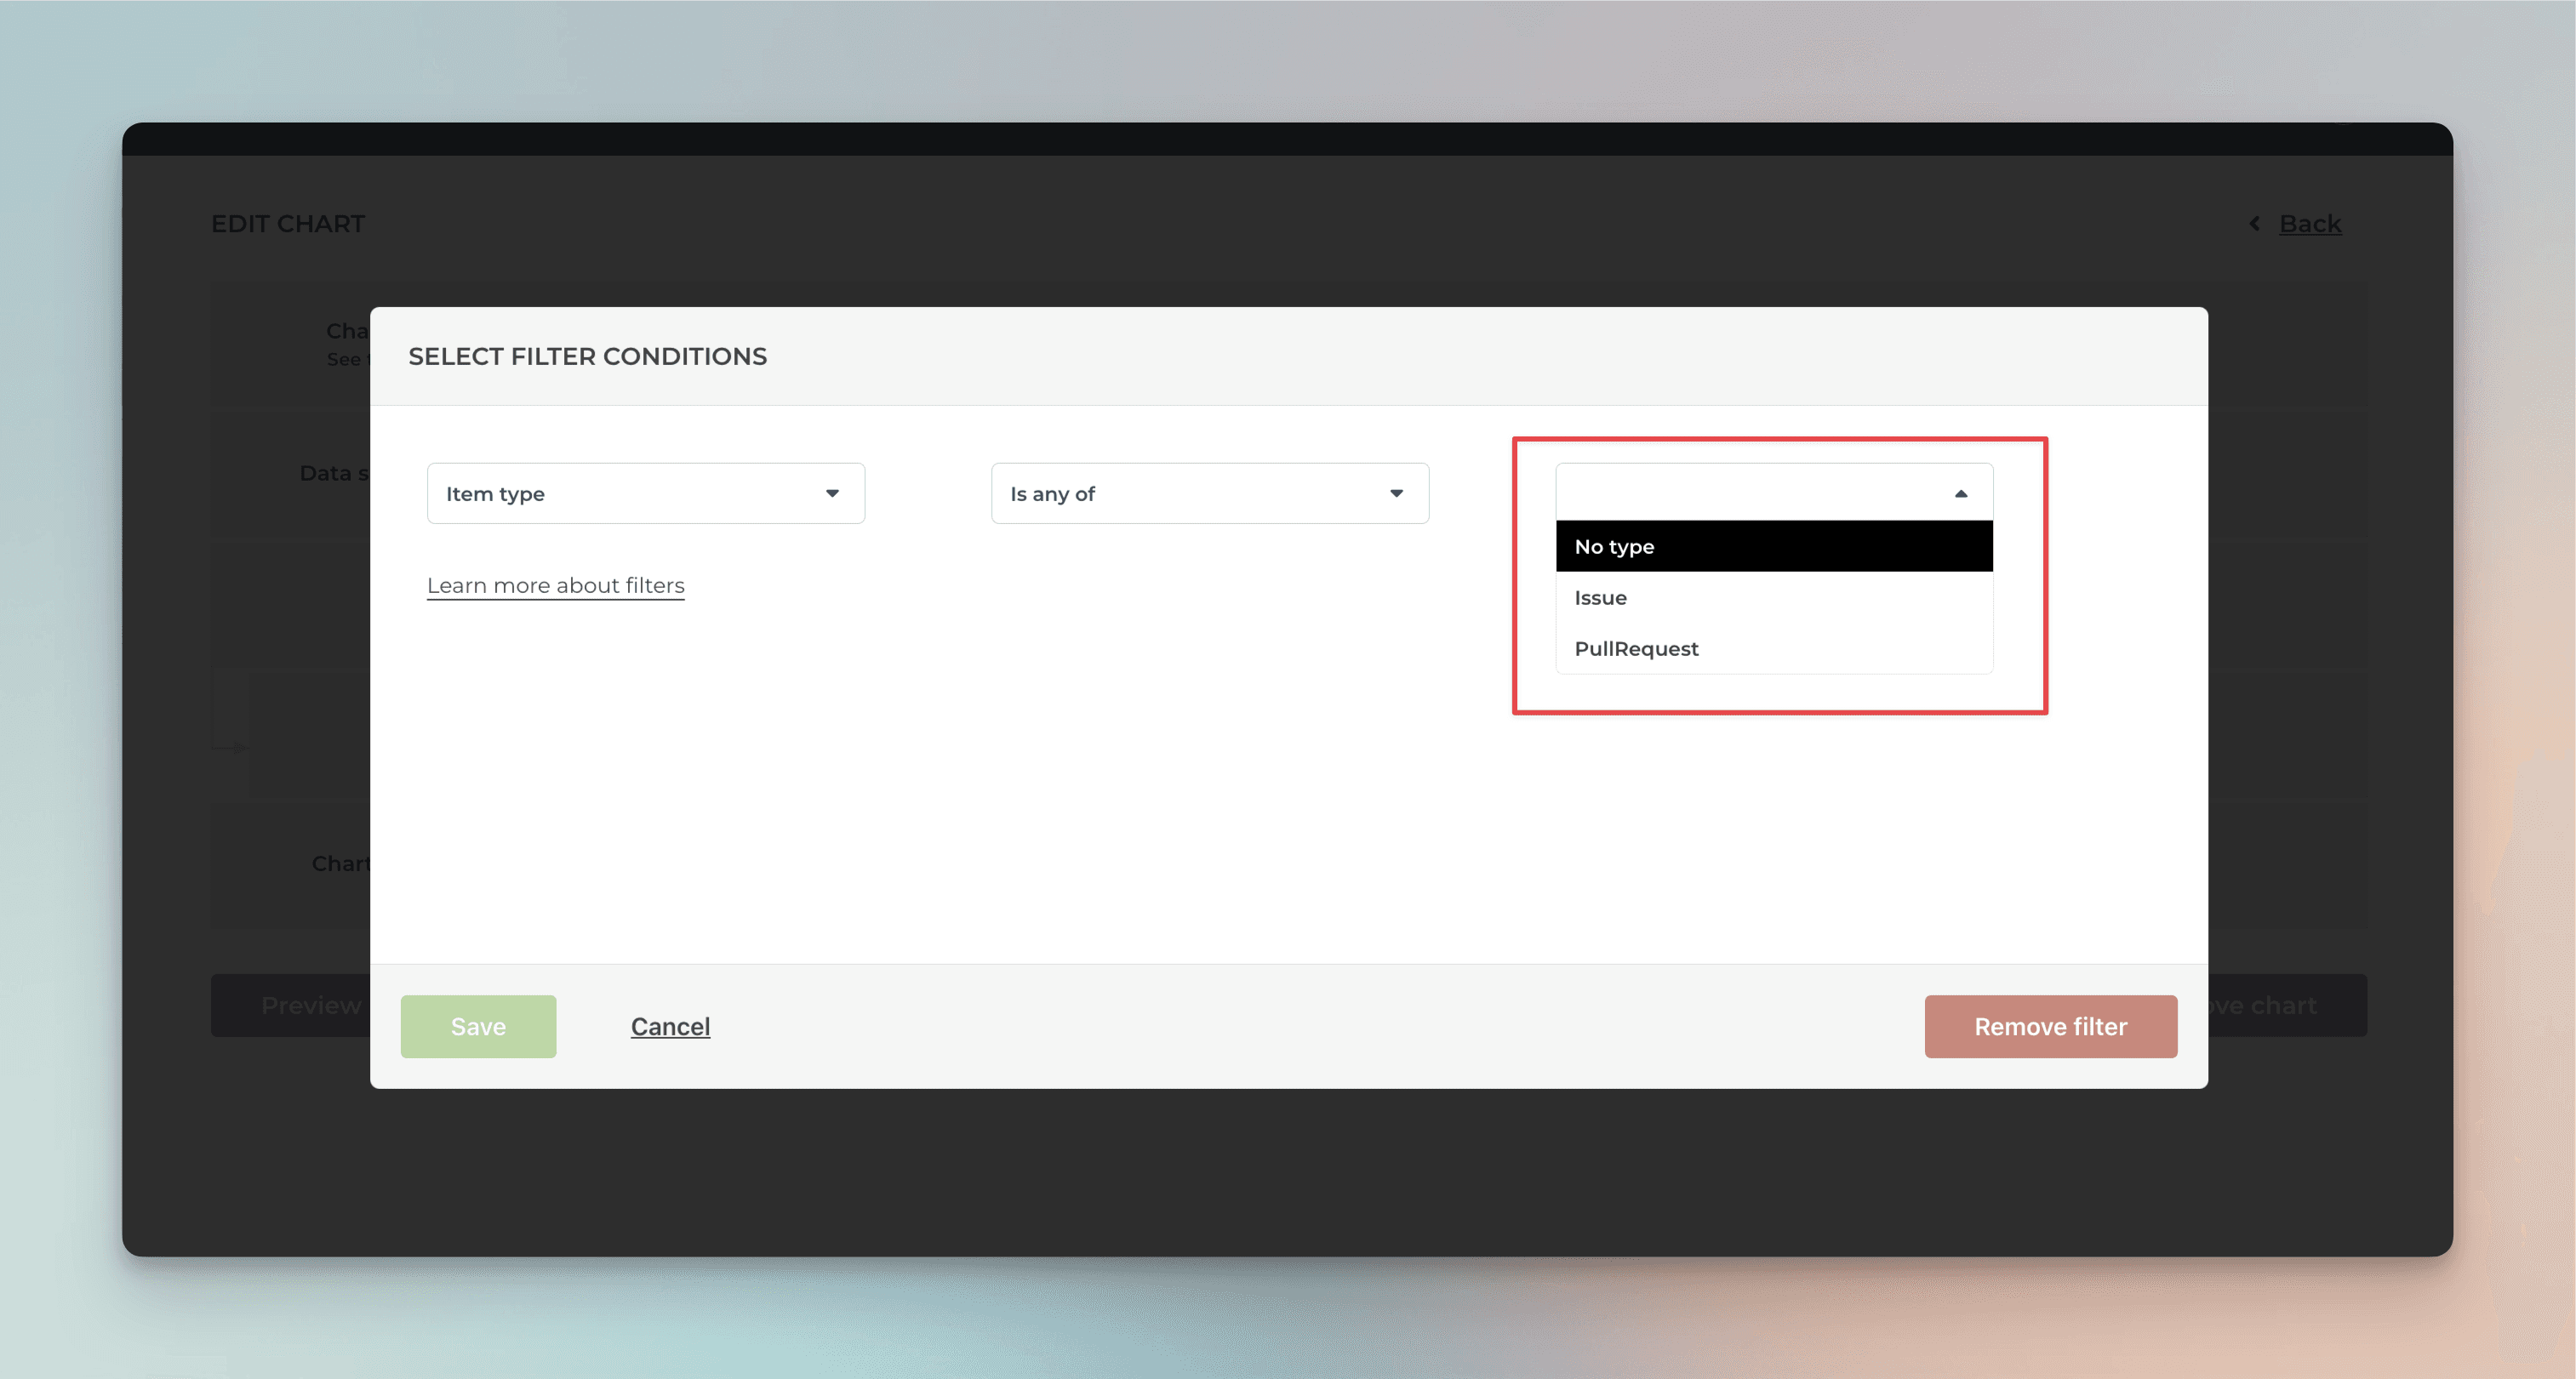
When you select PullRequest, the chart will display data only from Pull requests.
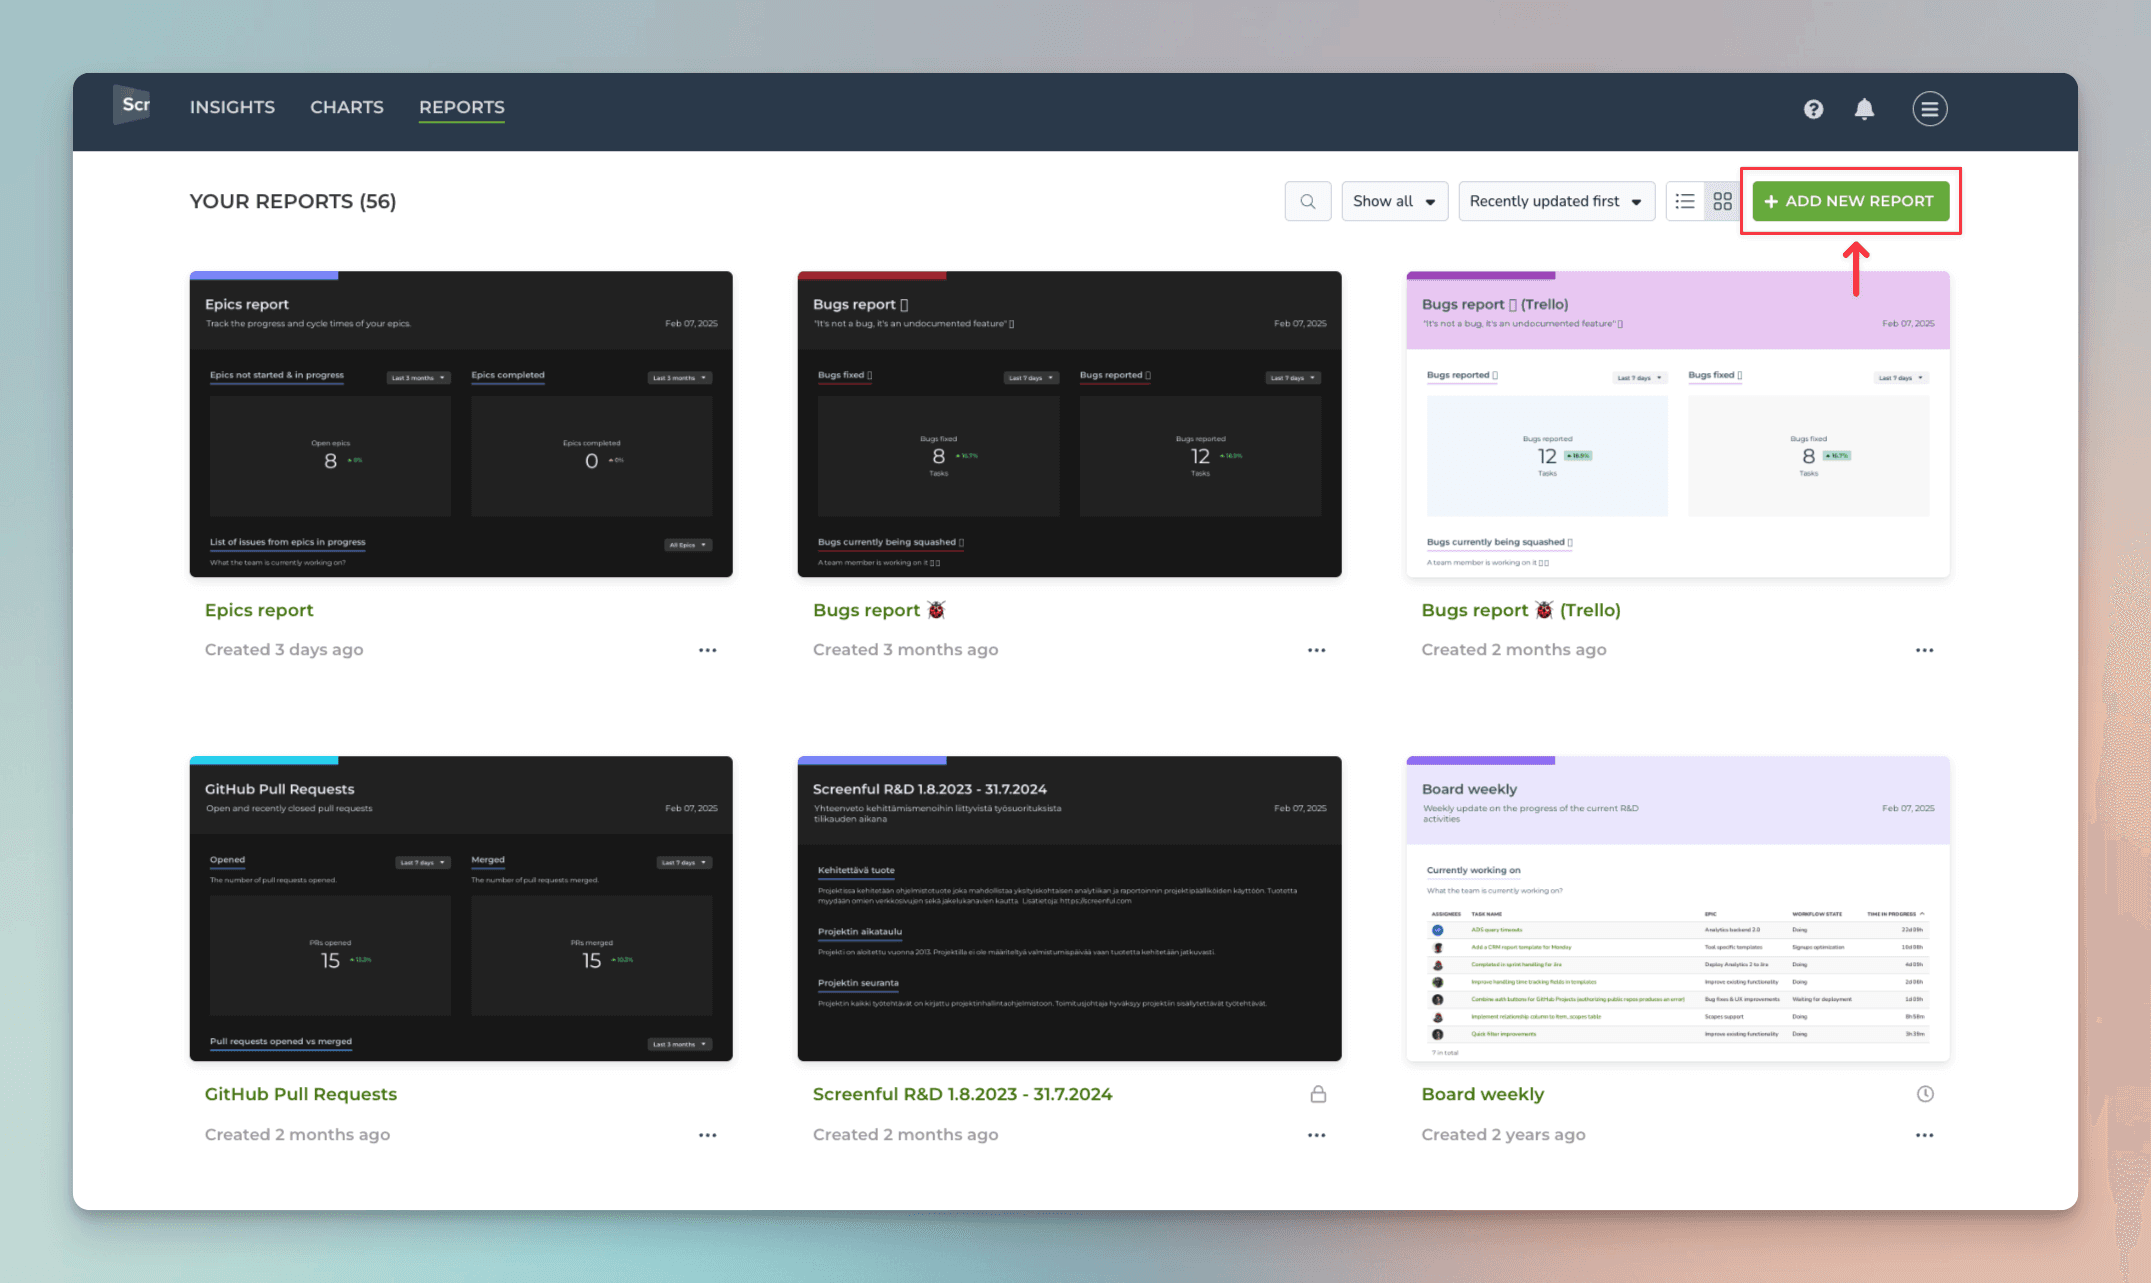
Create Pull Request report from template
You can create a Pull Request report by using a report template. Go to the Reports tab and click Add new report:
A modal opens, showing the available templates. Select GitHub Pull Requests:
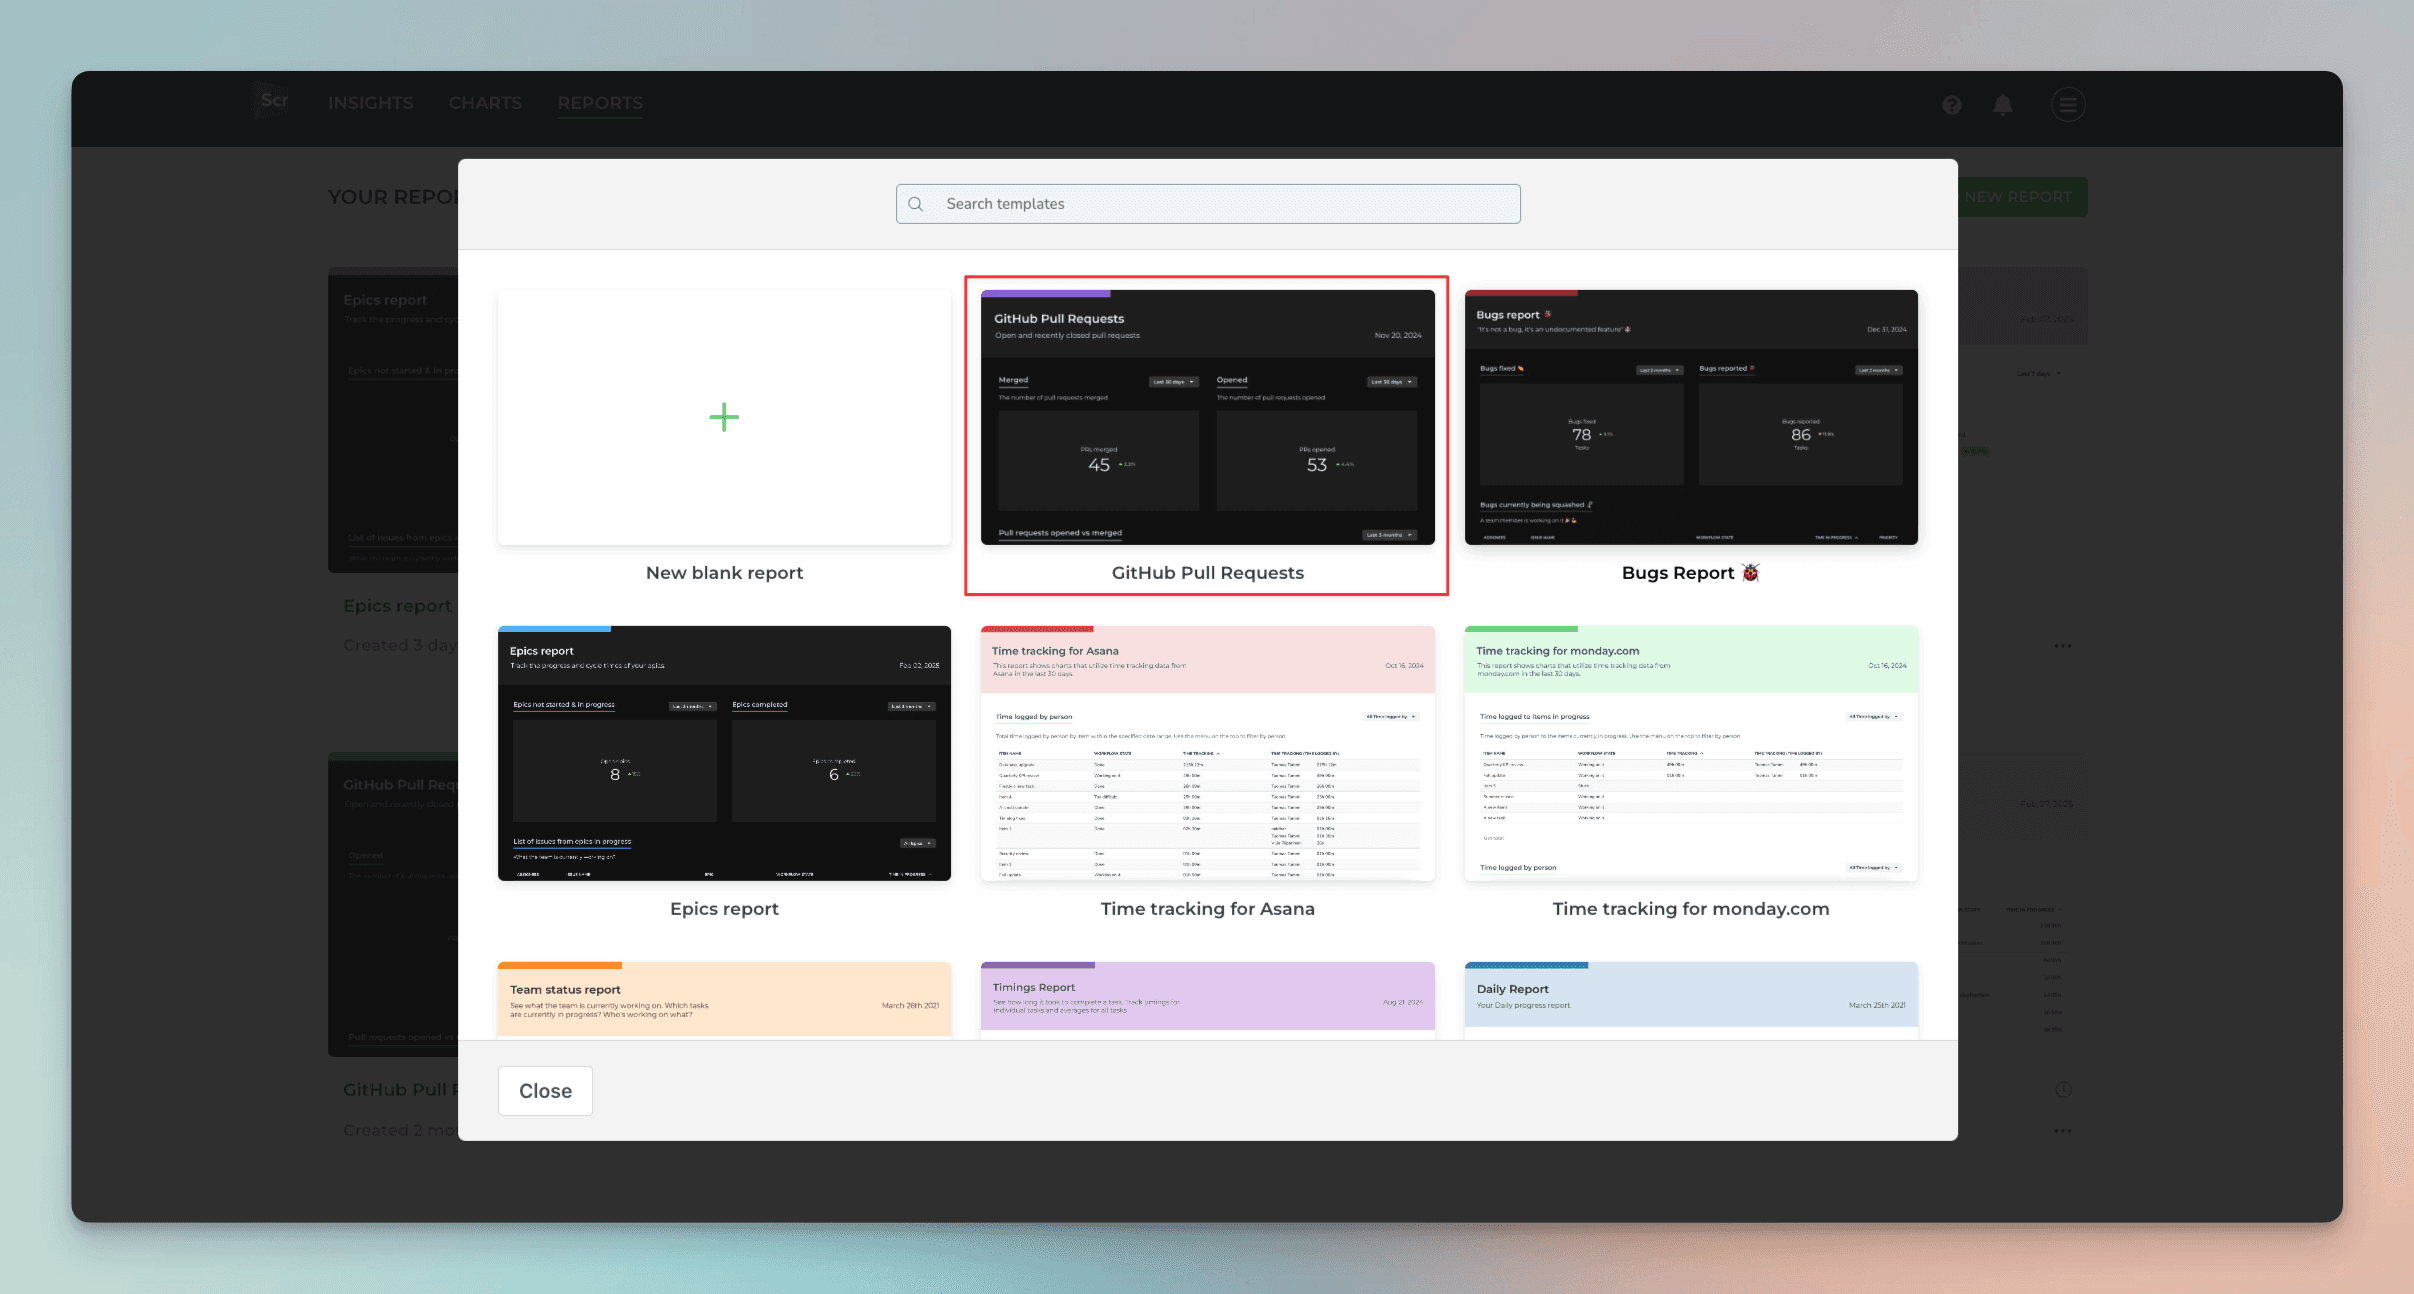
A report is created containing pull request data from the selected repositories:
Once you have created the report, it appears under the Reports tab. From there, you can share it with a link or schedule to be sent via email or Slack.
About Screenful
Screenful provides multidimensional analytics of the data in GitHub. You can slice & dice your data with 15 different chart types, and click through to drill into details.
To get started, start a free trial via the GitHub Marketplace. For more information, see the guide Setting up Screenful with GitHub.
Let us know if you have questions or feedback by contacting hello@screenful.com. To stay on the loop, read our blog, or follow us on LinkedIn.
