You can use the Planned Work chart for tracking future revenues based on your data in monday.com, Jira, Asana, Linear, or any of tools we support with our analytics. It enables tracking when sales revenue will be recognized based on set dates. You can use it to project the expected revenue based on booked or estimated deals.
See how much revenue is estimated for the future
Let's assume you have a sales pipeline board that tracks leads and open opportunities. On that board, you have assigned each item an estimated Deal value and an estimated Close date.

While the example board above is from monday.com, you can have this data in any of the tools we support. You can structure your board any way you want as long as the key information is present:
Deal name
Deal value
Estimated close date
The Planned work chart shows the work with a planned duration. That means a task must have a set date (e.g. due date, close date, or completion date) to be included in this chart.
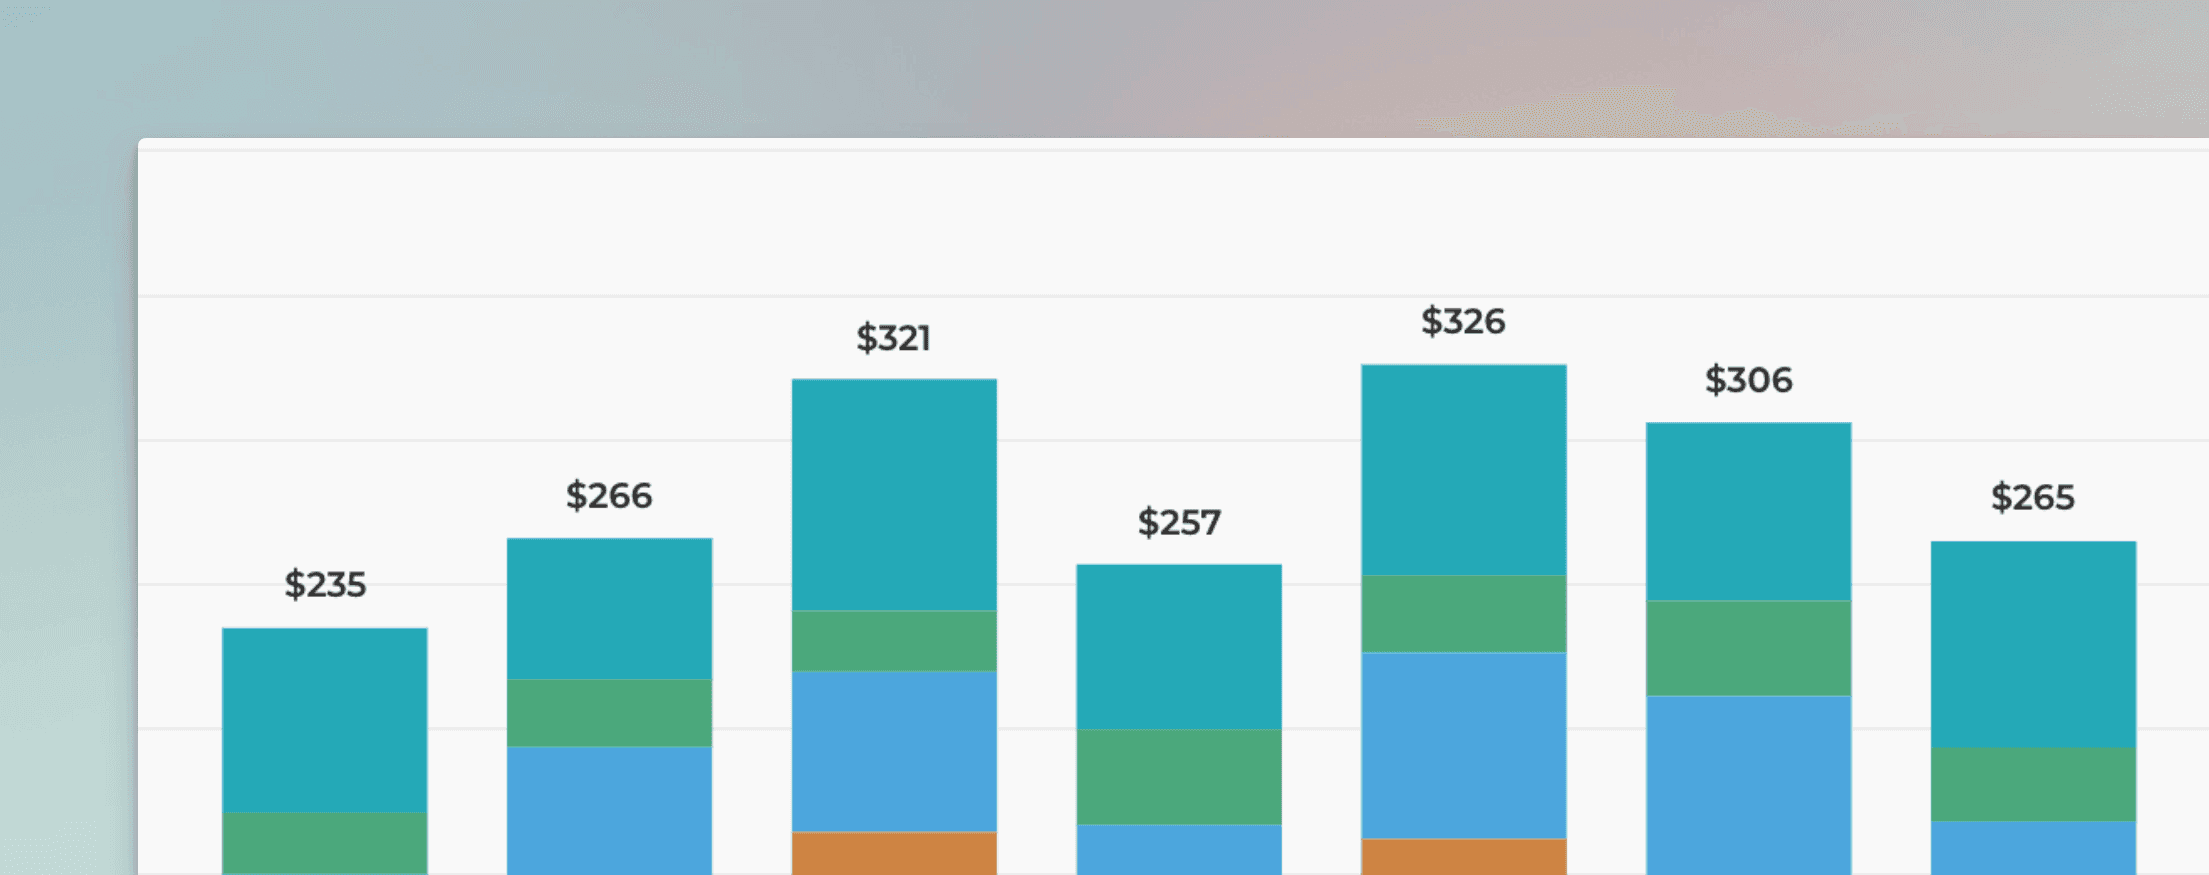
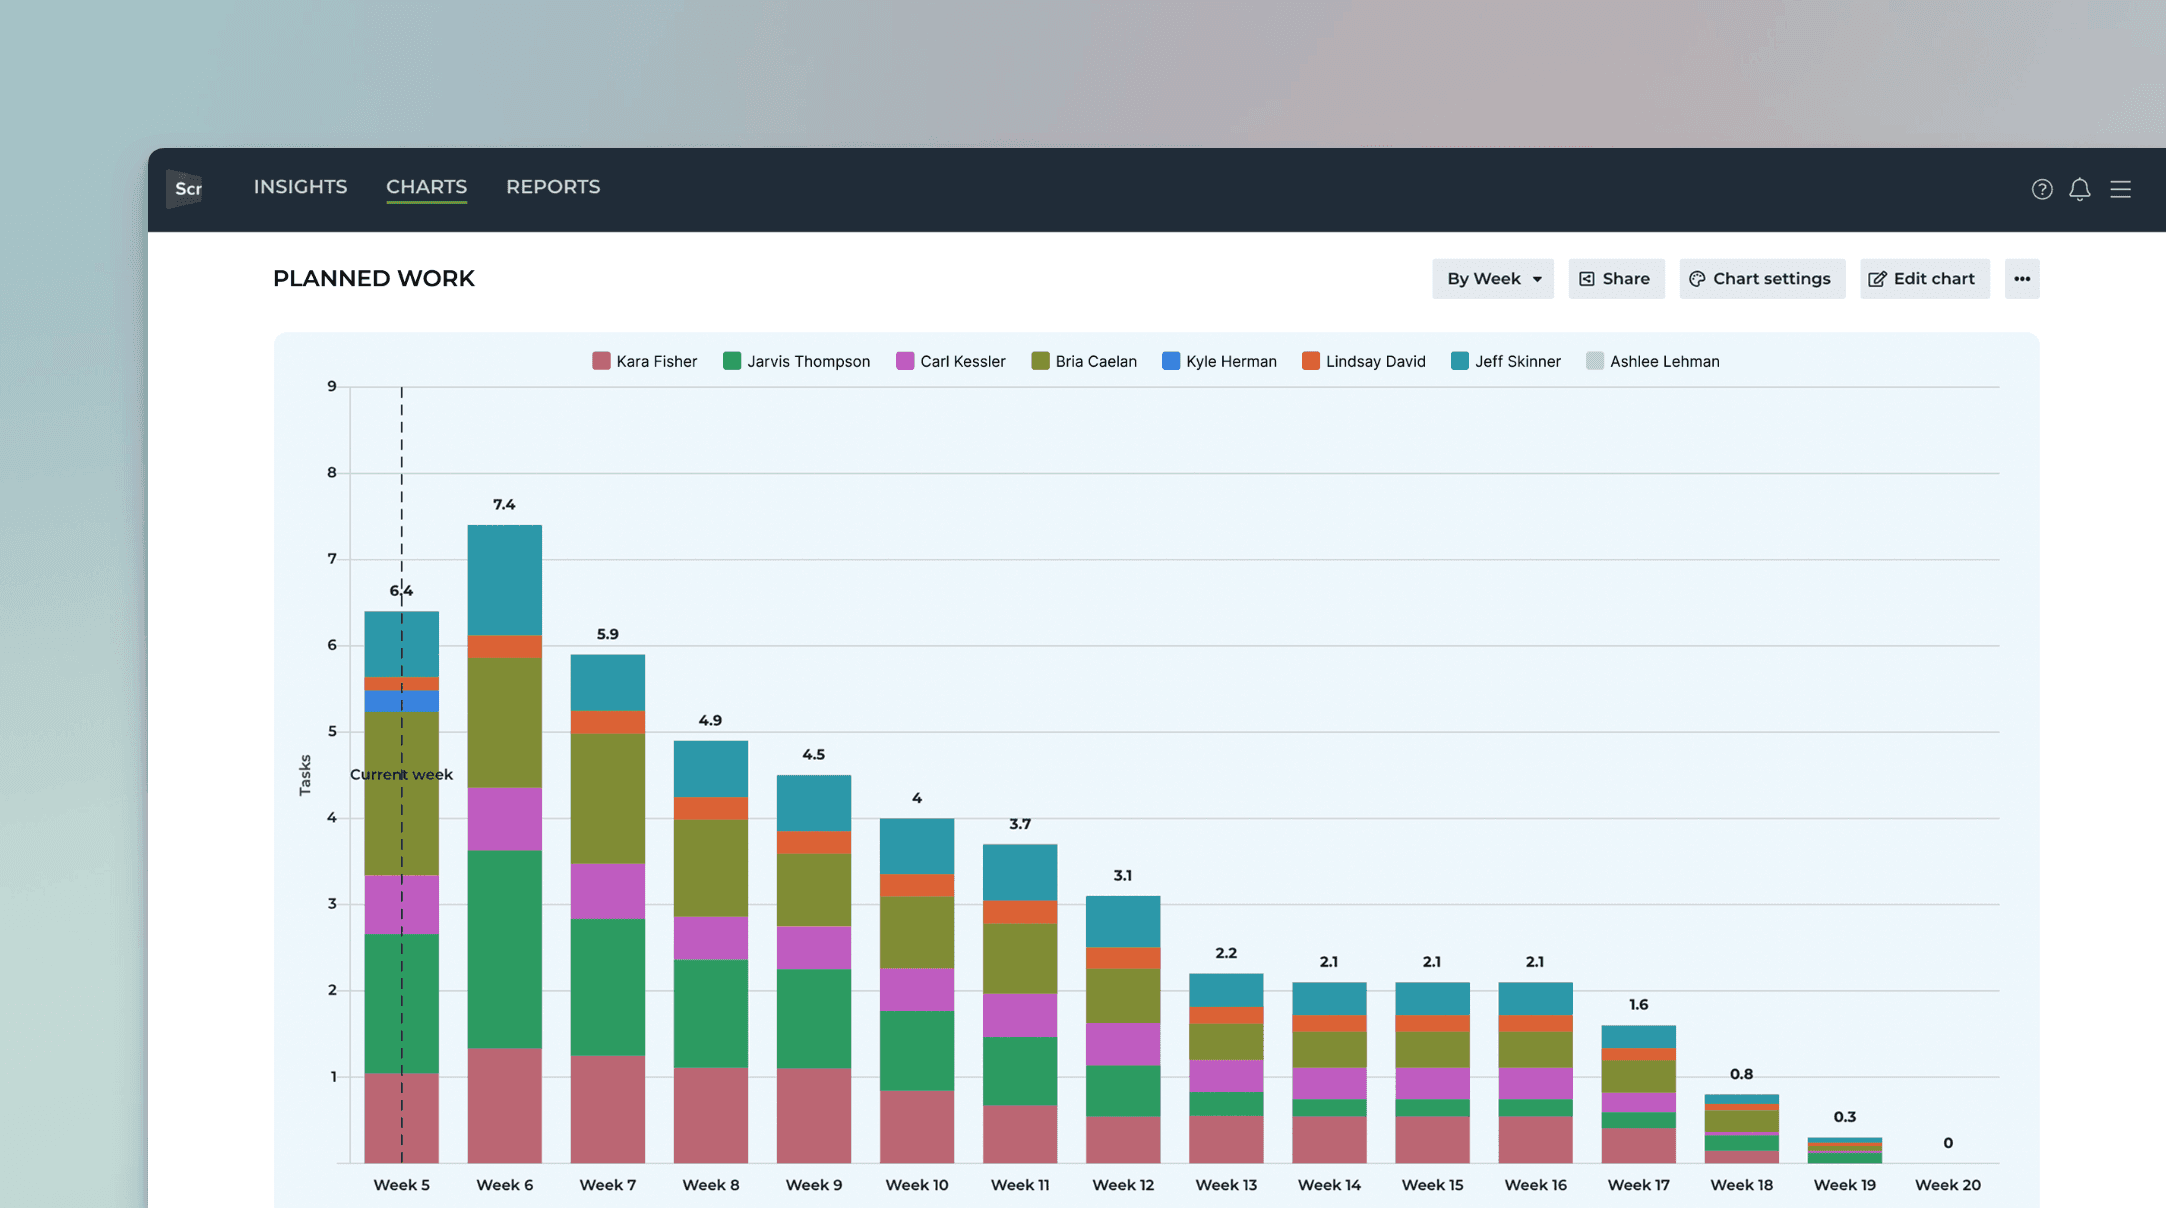
Once you have imported the board as a data source to Screenful, you can go to the Charts tab and create a Planned work chart from the template. Here's an example chart:

In this example, the chart is grouped by Week, and the bar segment is Salesperson. The chart displays the estimated weekly revenue for each salesperson. The leftmost bar is the current week. The bars to the right are the future weeks.
You can aggregate data from multiple boards and segment the chart by any property, such as client, department, or product. The chart will automatically adjust when dates or deal values are updated, always reflecting your current plan.
When you adjust the data in your board, the changes will be reflected in the chart after the next data sync, which runs automatically once per hour. You can trigger the sync manually from the main menu.
Allocate all revenues to the close date or evenly between start and end
There are two options for allocating the revenues. Either they are fully allocated to the close date, or they are allocated evenly between the start and close date. You can choose between these in the chart settings:

If you have selected Allocate all work to the end date, all revenues will be contributed to the single date, the close date. With this selection, you don't need start dates at all.
If you sell work on an hourly basis or your projects are invoiced on a weekly or monthly basis, you can select Allocate work evenly between start and end date. In that case, the deal value is contributed evenly between the start and the end date.
For example, if you have an item with a deal value of $20,000, and there are 10 days between the start date and the close date, $2,000 will be allocated for each day. If the start date is not set, the chart allocates the work from the current date until the close date.
Use any of your number custom field as a unit
You can use any of your number custom fields as the unit. By default, the chart uses the item count as the unit, but you can change it to any of your custom fields from the unit menu.
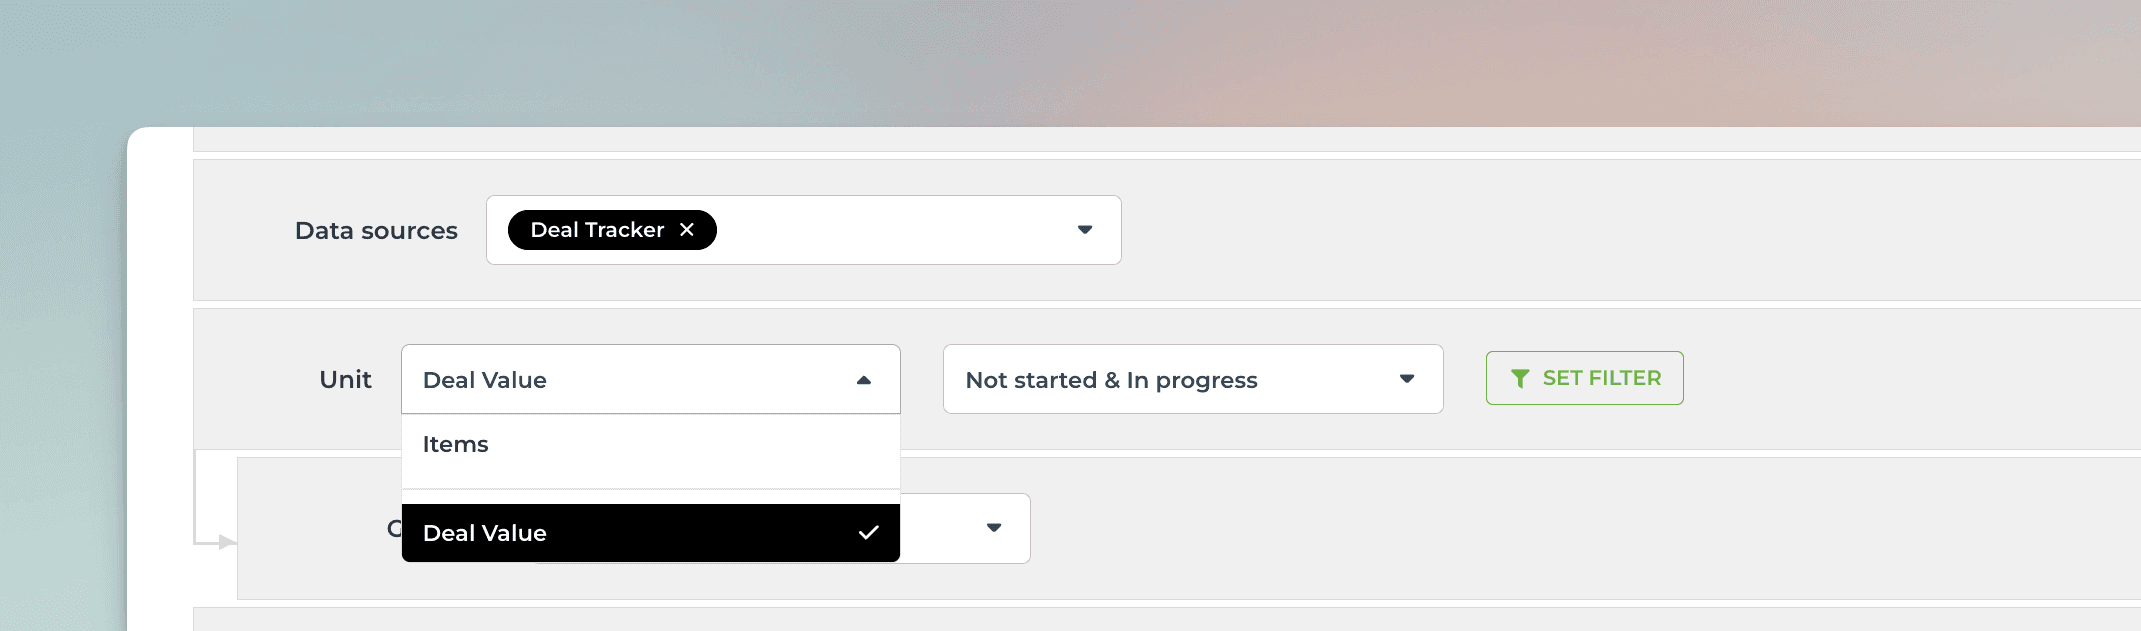
In this example, Deal Value is selected as the unit. In the chart settings, you can specify the currency (e.g. Eur or USD):

Once you save the settings, the chart will display the numbers in the selected currency:
Map your custom Date or Timeline field to the Due date
You can track revenue based on your custom Date or Timeline fields by mapping the field to the Start date and Due date in the custom field mapping. To access the custom field mapping, select Data Mapping from the main menu and navigate to the Custom Fields tab.
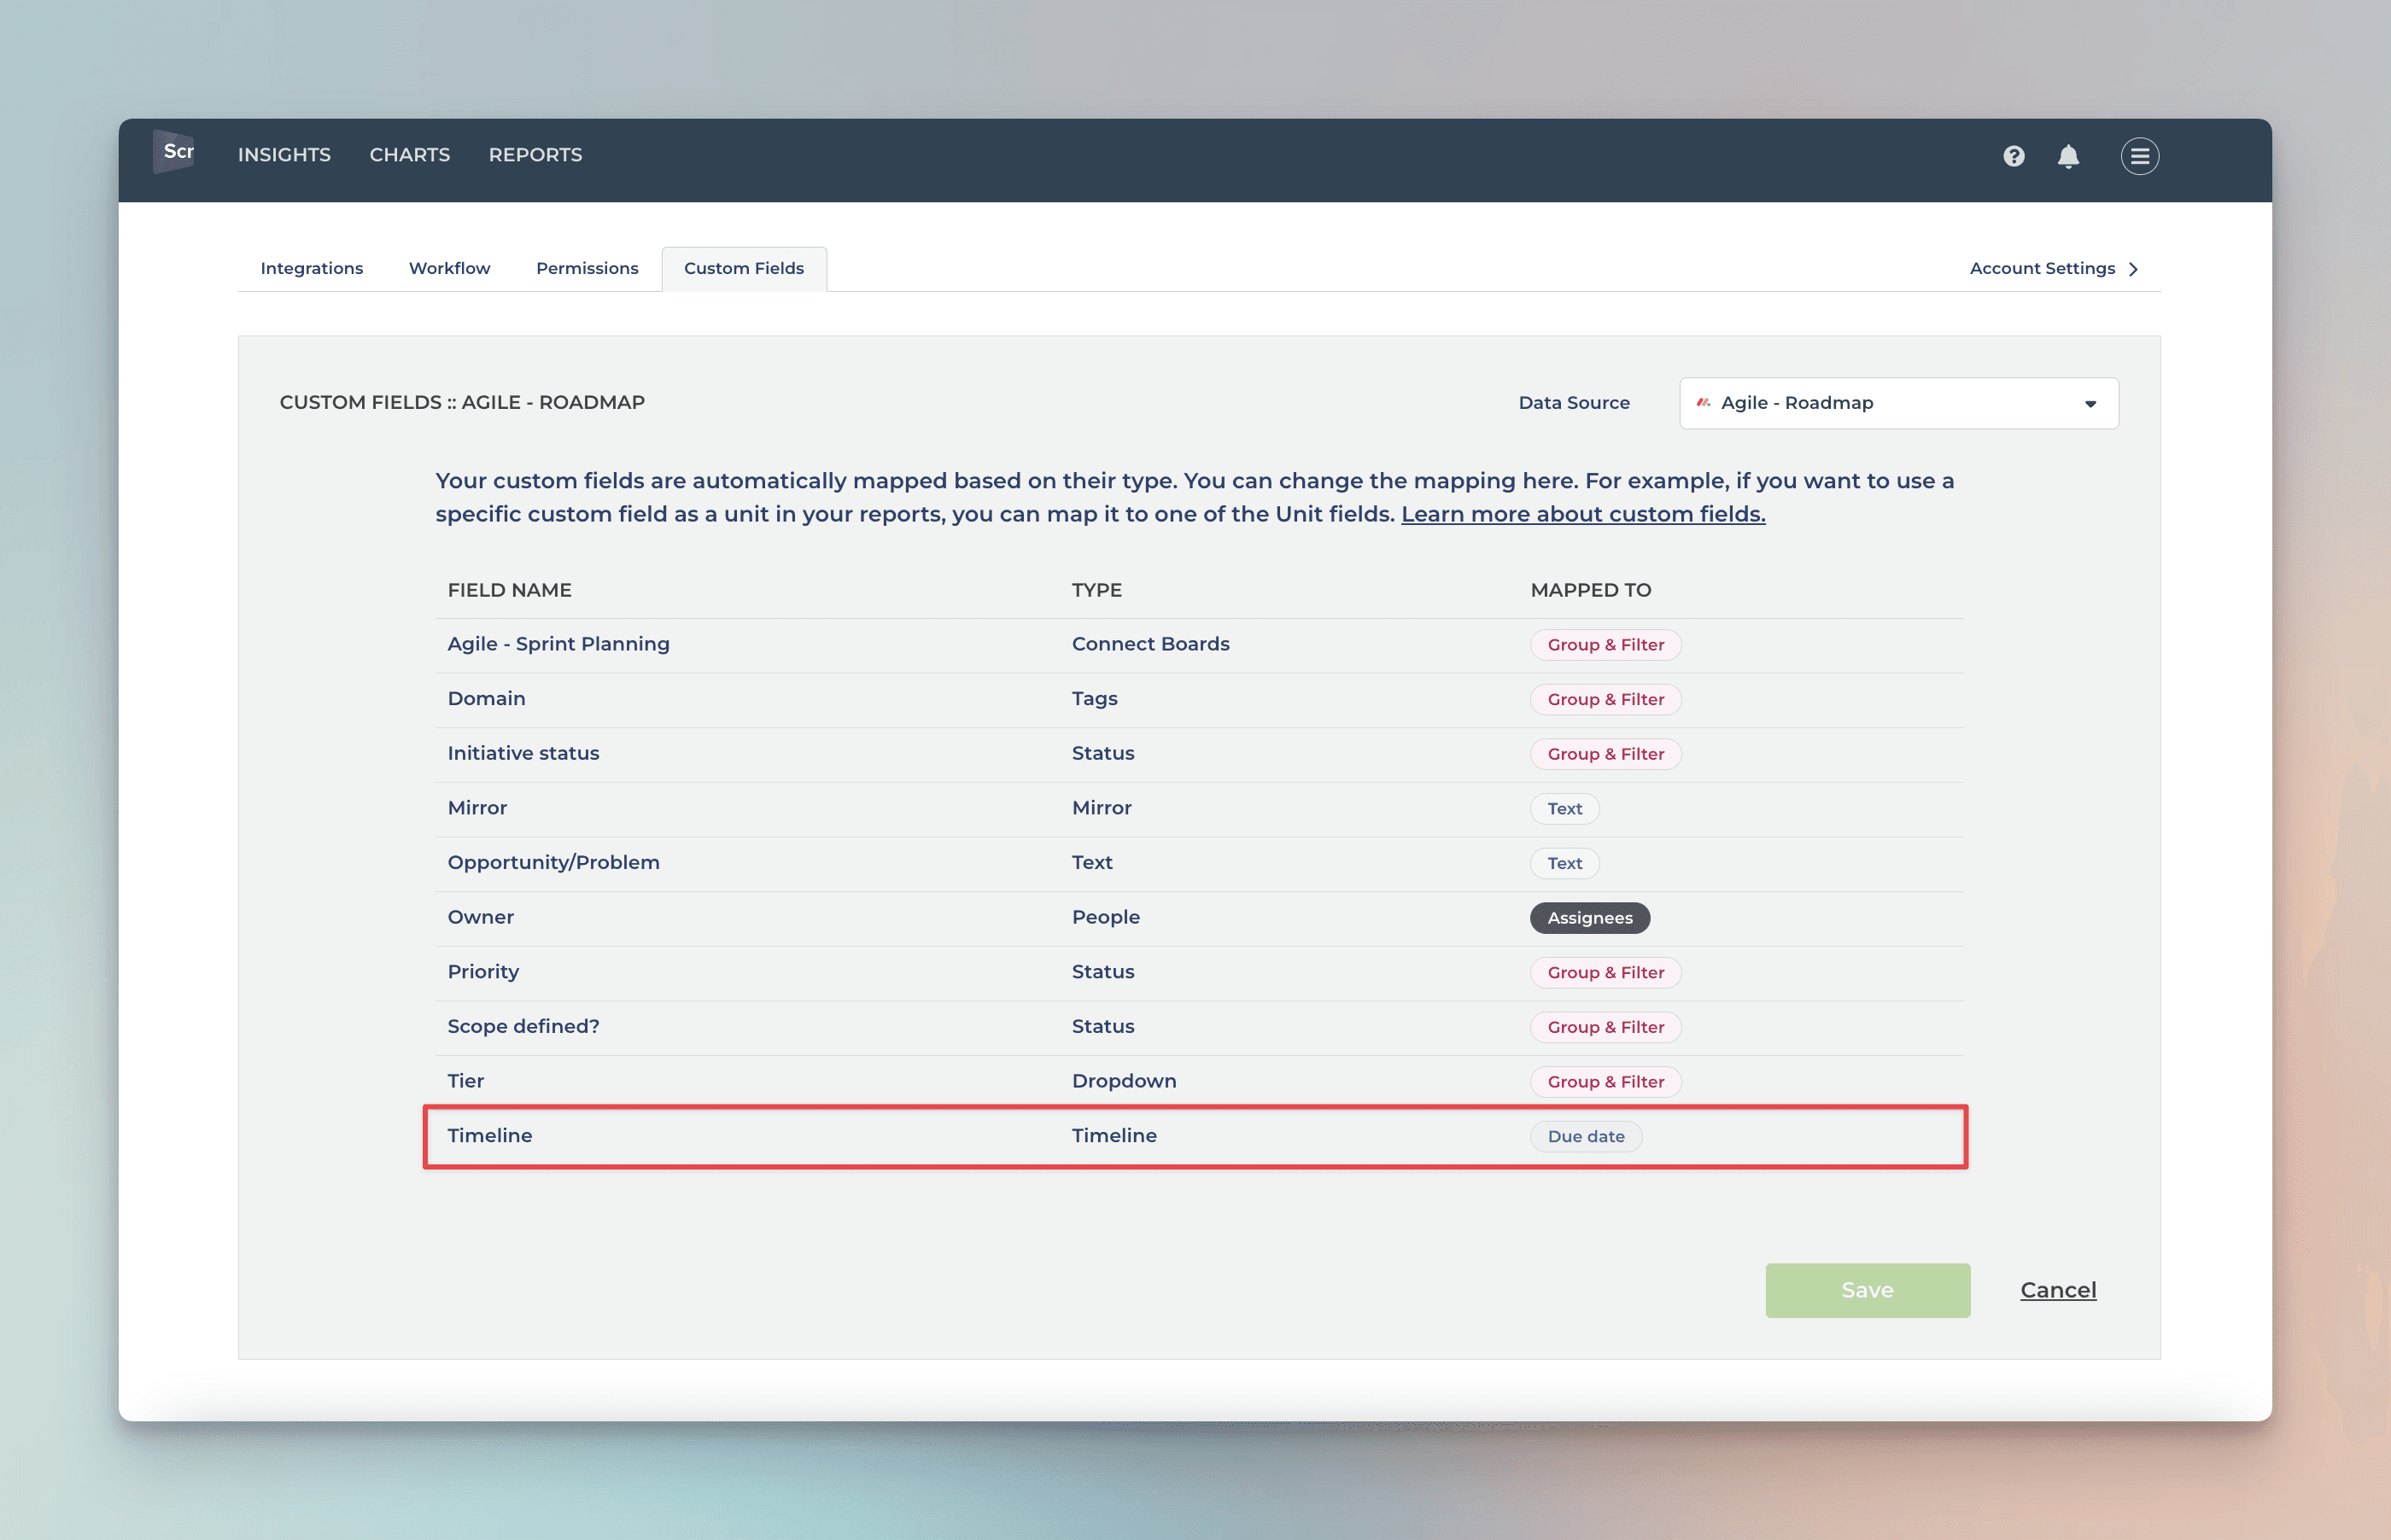
The rightmost column shows the mapping of the column. You can adjust the mapping by clicking the item from the list:
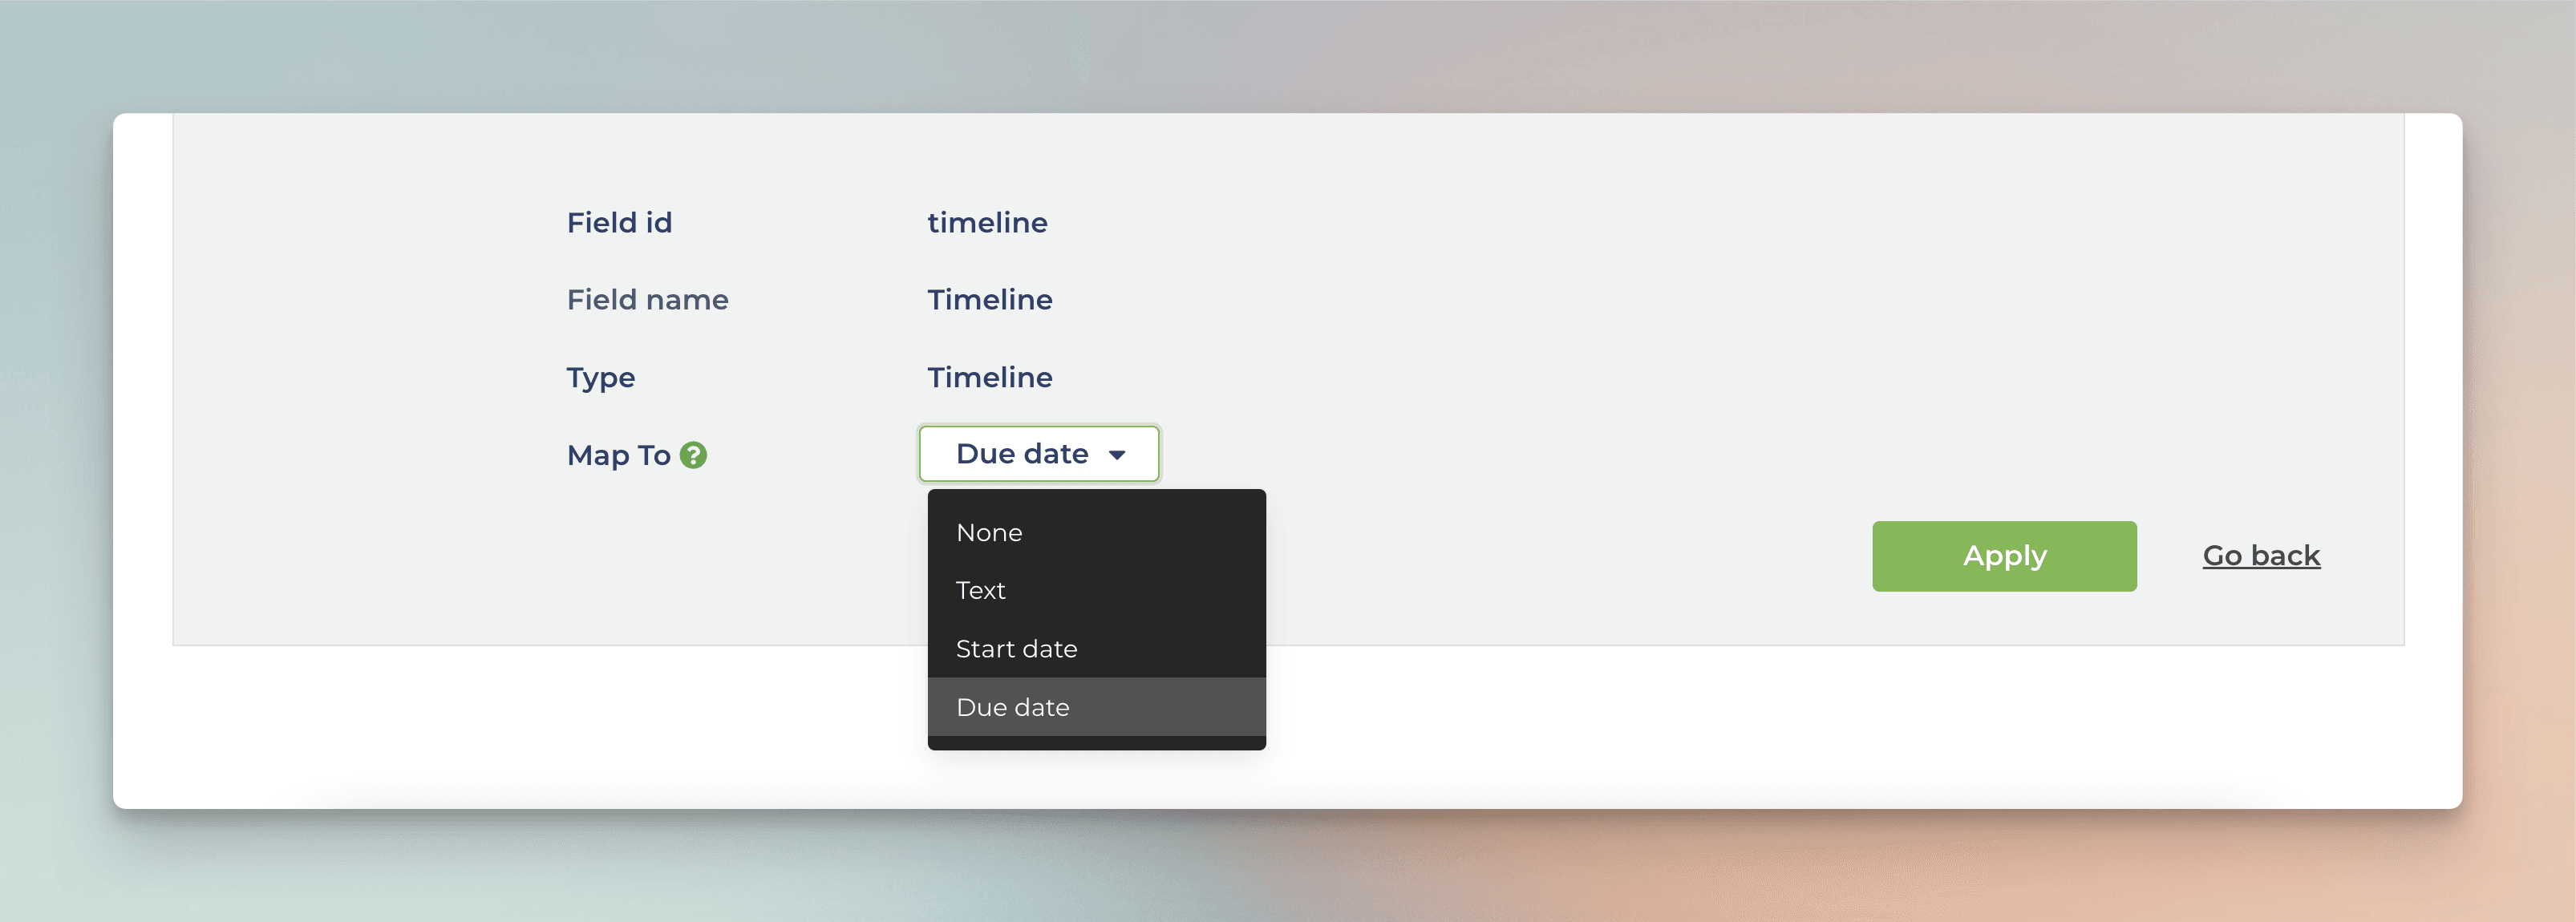
You can map any of your Date fields to either Start date or Due date.
Since a Timeline field contains both start and end dates, you can map it to either a start date or an end date, and the other date is automatically mapped to the same Timeline field.
Creating the Planned Work chart
To create a Planned Work chart, go to the Charts tab and click Add new chart.
A modal is opened with a set of chart templates. Select New blank chart to open the chart editor. Select Planned work as the chart type. In this example, we’ve selected grouping to be by Week, and bar segment to be Assignee.
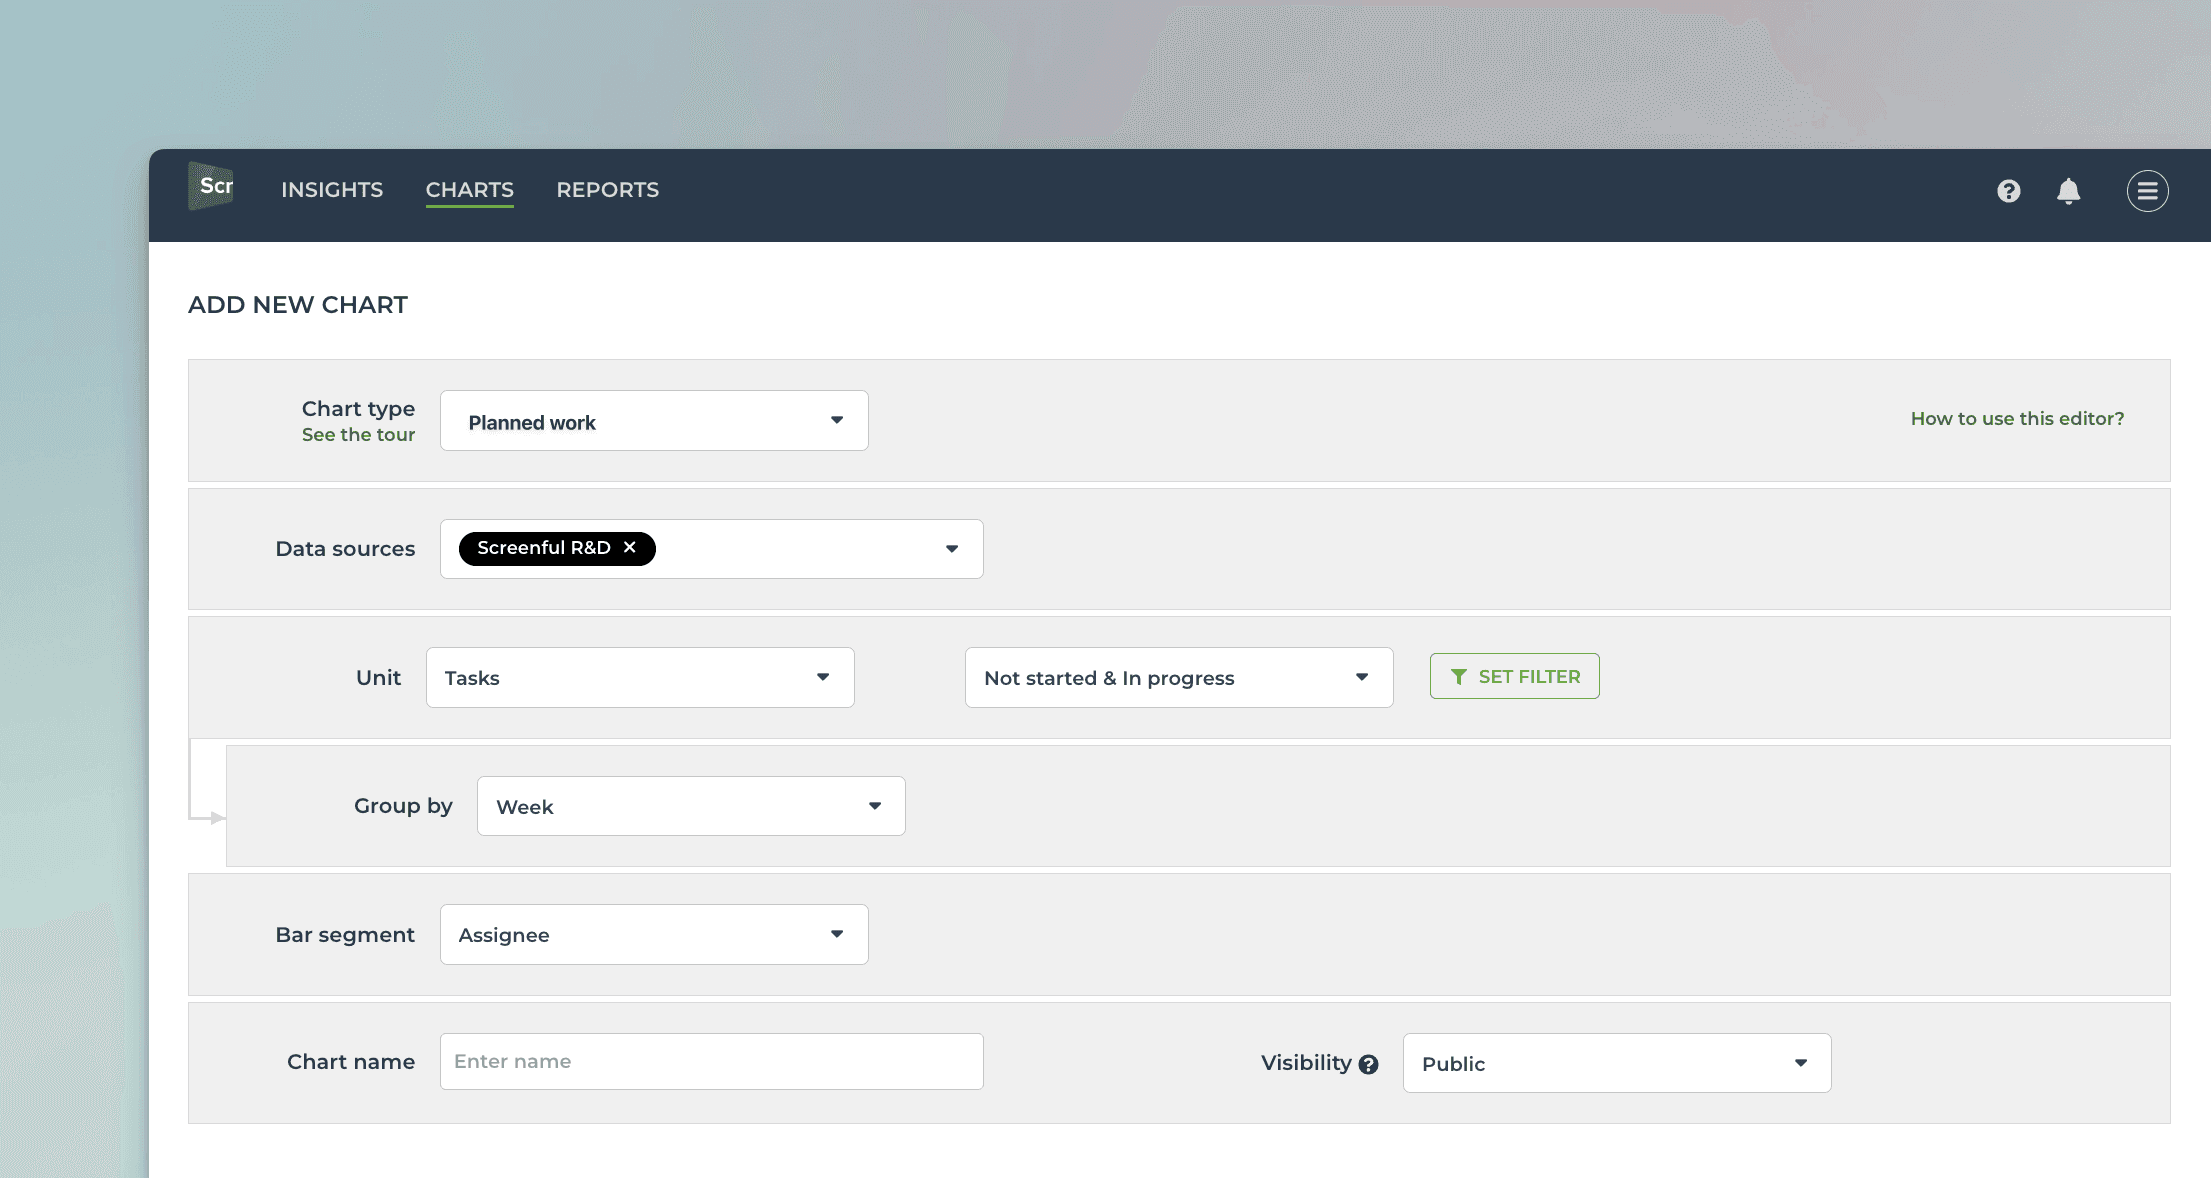
That produces the chart seen at the beginning of this guide:
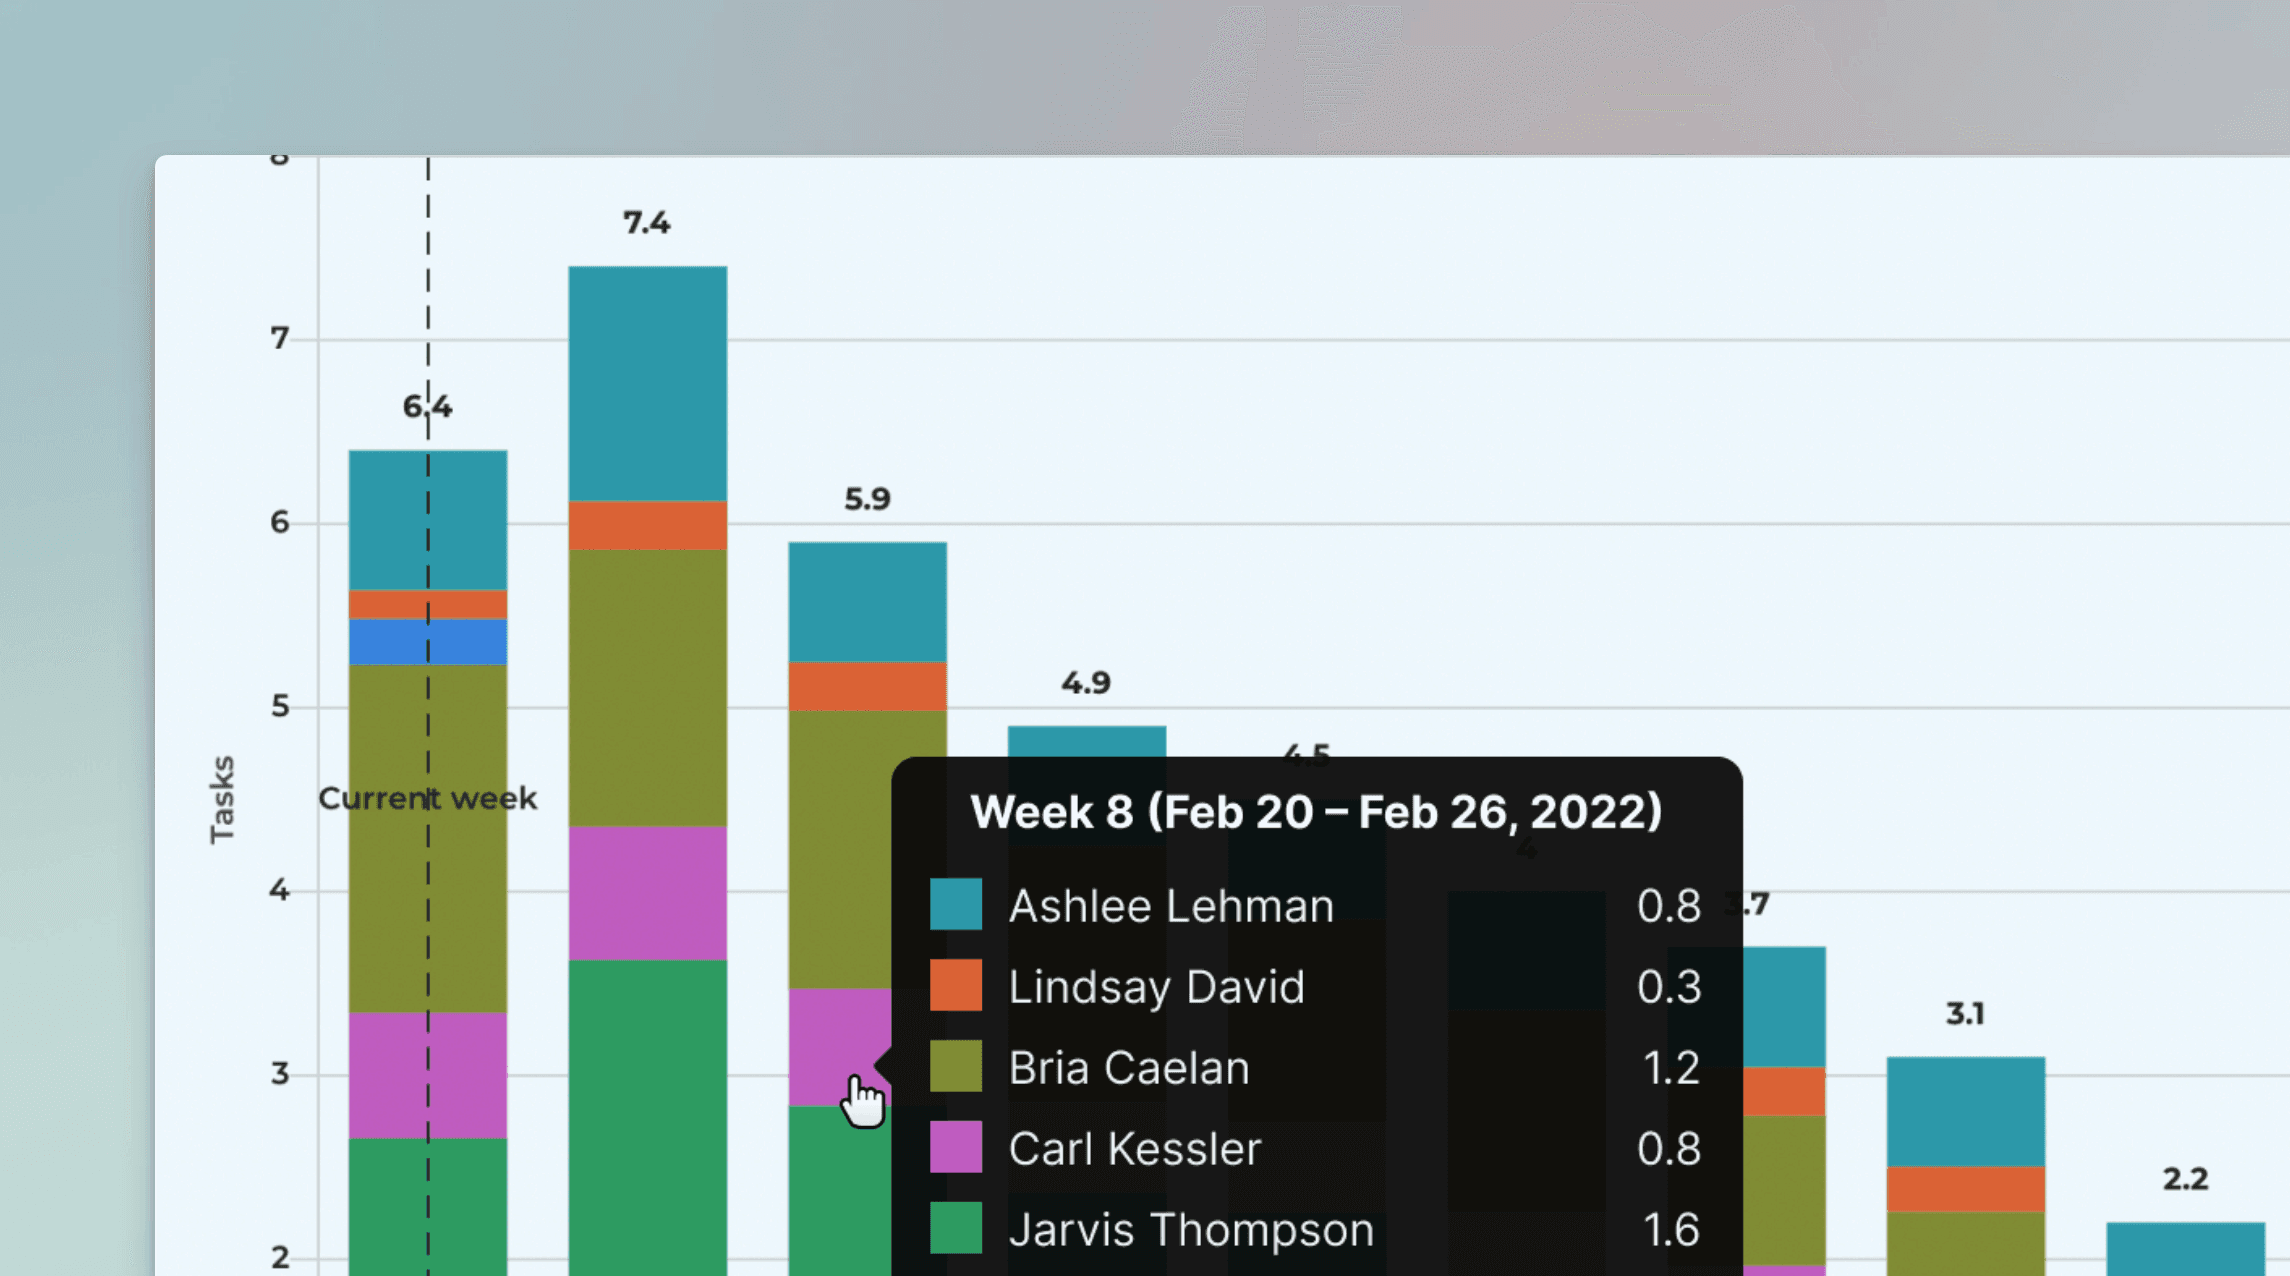
You can mouse-hover the bars to see the work allocated for each individual for each week:
Once you've created the chart, you can place it in a report and schedule it to be sent via email or Slack.
Book a free onboarding call
Need help with setting up your charts and reports? Don't find a metric you are looking for? Book a call with our expert. We'd love to help you supercharge your reporting!


