Creating project reports manually takes up time. Nobody likes the tedious task of copy & pasting data into slides and spreadsheets. With Screenful, you can automate reporting, freeing your time and delighting your stakeholders with real-time updates.
This step-by-step guide shows how to create and automate reports using data from your task management tools (Jira, Trello, Asana, monday.com etc.) with Screenful.
This guide assumes that you have signed up for a free trial and imported at least one data source.
Step 1: Create the charts you want to share
The first step is to create the chart you want to share with others. You can either create a new chart from scratch or pick one of the predefined charts from the templates. Once a chart is created, it shows up under the Charts tab.

Repeat this step until you have created all the charts you want to share.
✨ Creating a chart
✨ Adjusting the chart appearance
Step 2: Add your charts to a report
Once you have created your charts, you can add them to a report by going to the Reports tab and clicking Add new report. The report editor is opened, and you can start adding charts to the report.

You can add charts you previously created under the Charts tab or create new charts directly within the report editor. You can re-order the charts using drag & drop.
We recommend adding descriptions to charts so the receiver can correctly read the chart. You can type the description below the chart:

You can also add separate commentary blocks by selecting Add a new text from the menu that appears on a hover state.

You can add as many text blocks as you want and reorder them via drag & drop.
✨ Creating a report
✨ Adding charts to a report
Step 3: Share and collect feedback
So you compiled a report and are ready to show it to others - great! The next step is to send it to the others for feedback. To trigger one-time sending, click the three dots next to the report in the list and select Schedule from the menu. The scheduling view is opened, allowing you to choose the recipients from the list.

Once you click Send to selected users, the report is emailed to the selected recipients.
Step 4: Automate the report sending
To schedule a report, click the three dots next to any of the reports in the list and select Schedule from the menu. The scheduling view is opened, which allows you to choose the frequency and the time of day when the report will be sent.
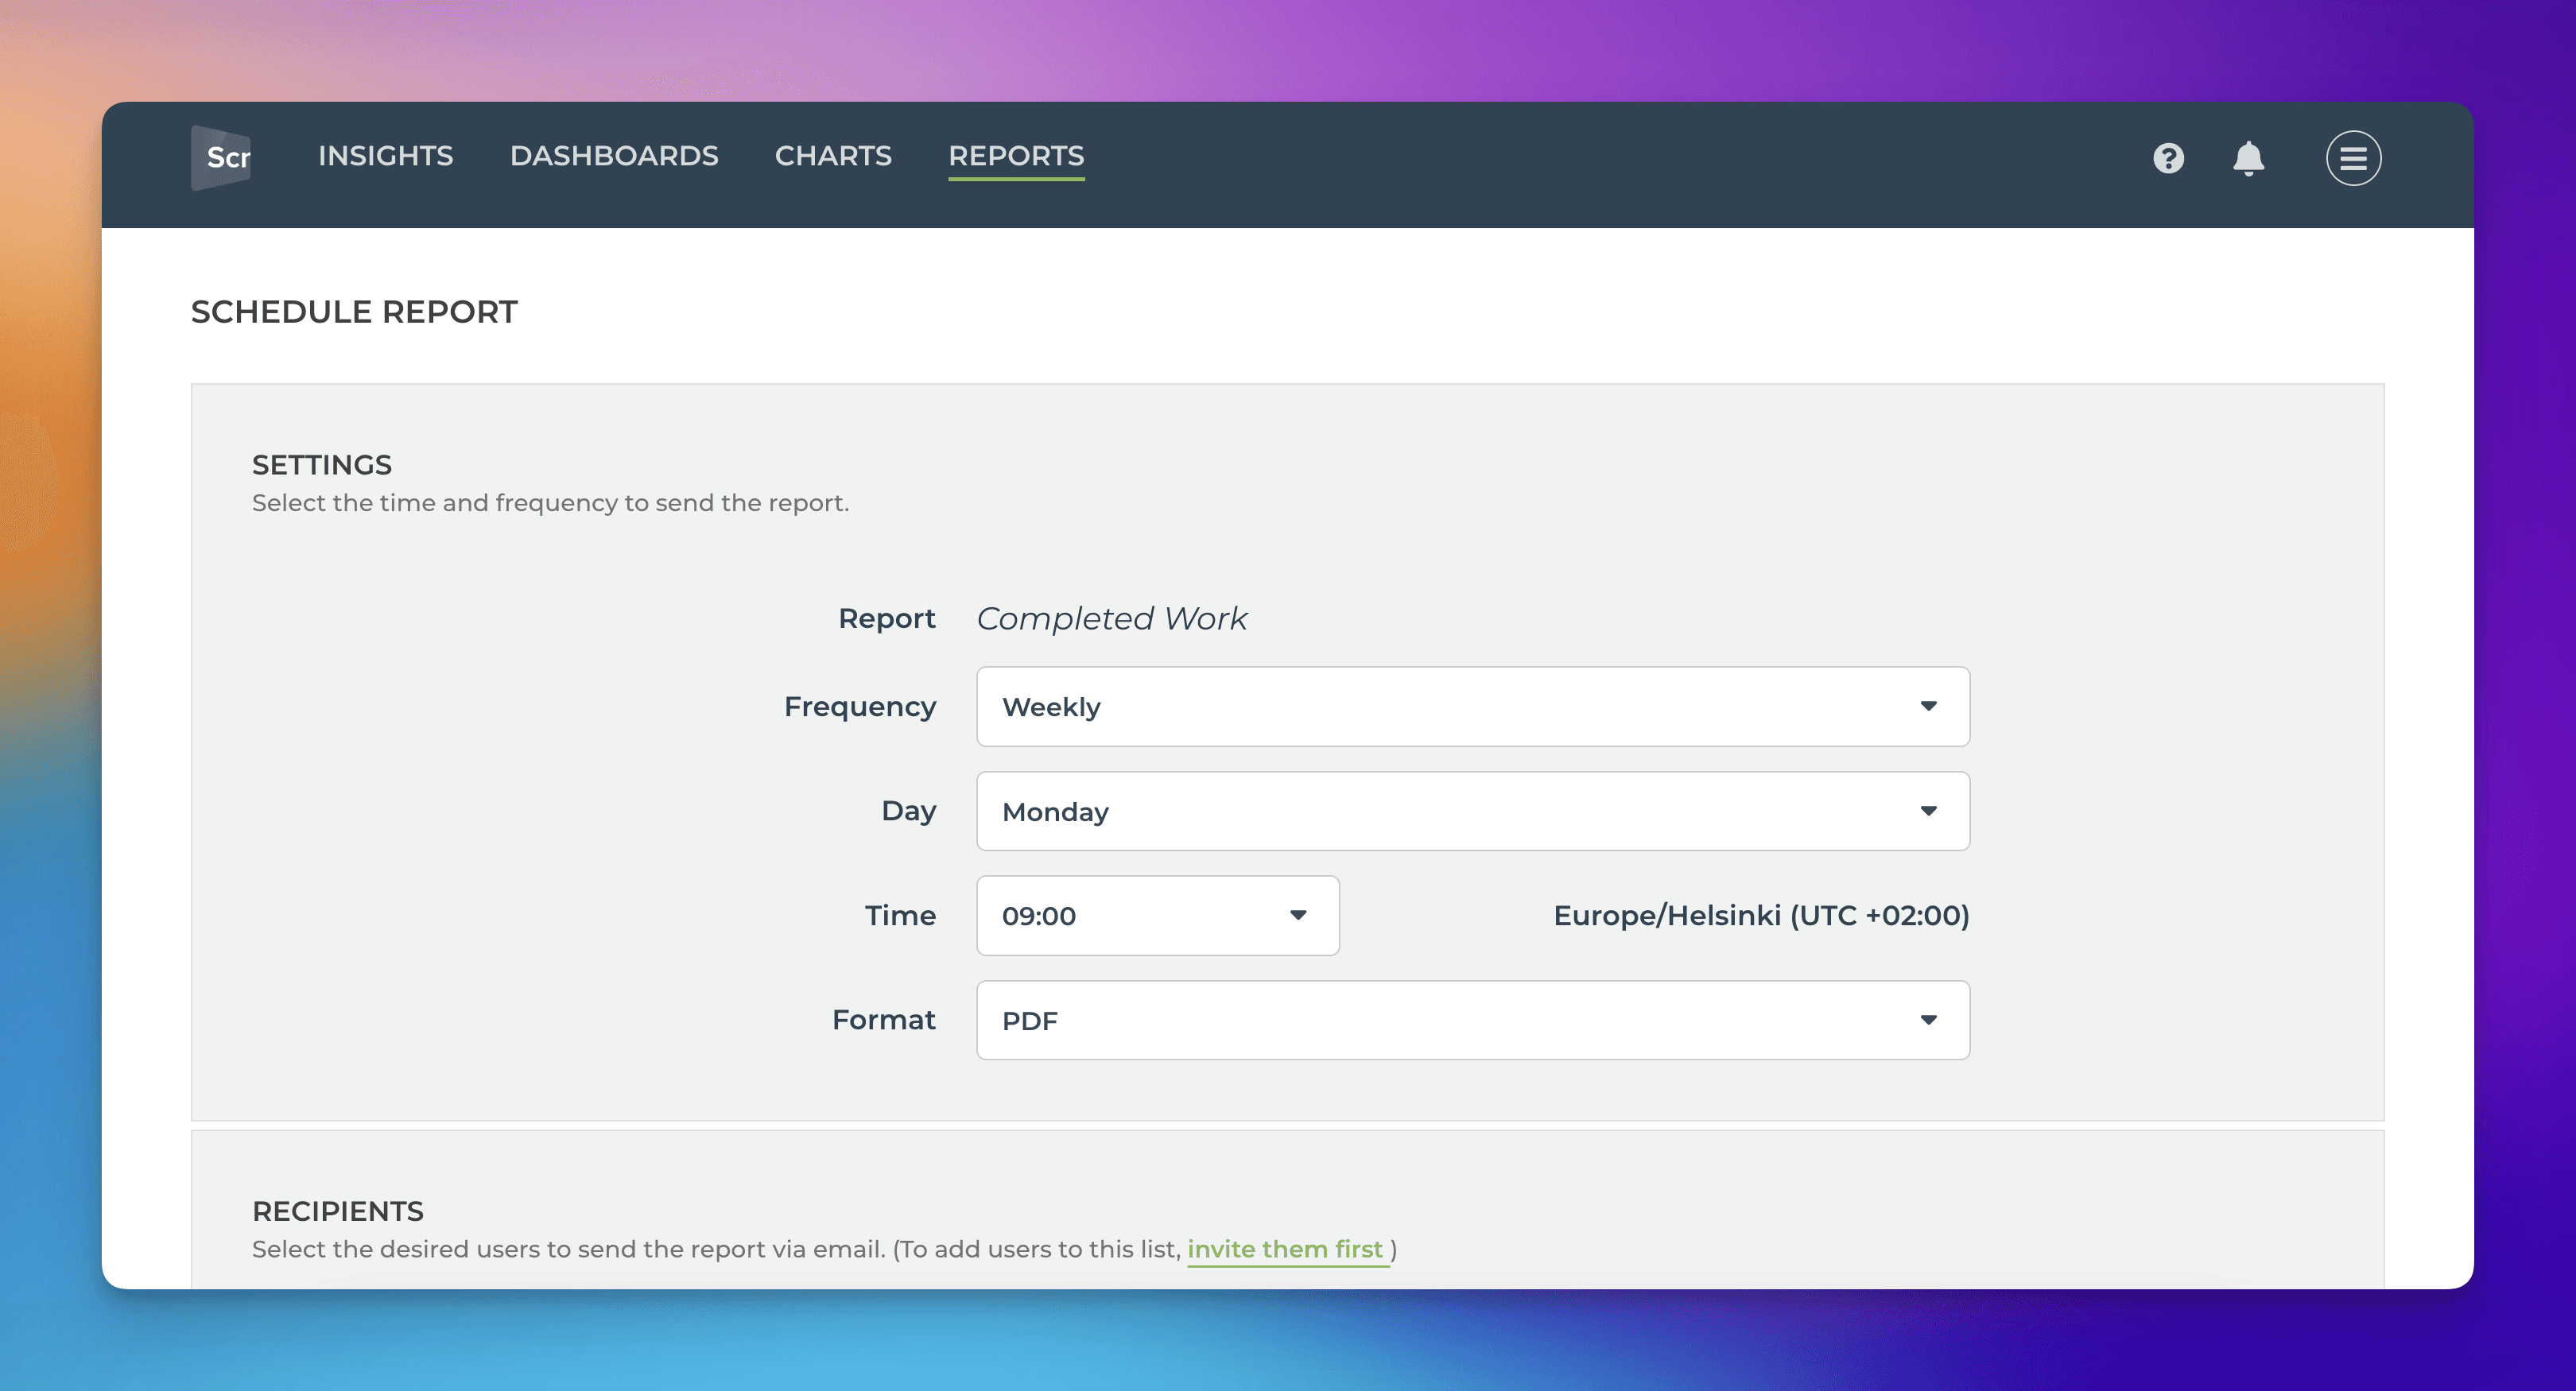
The email contains a link to the live report online and a PDF export as an attachment.
✨ Scheduling a report to be sent via email
✨ Scheduling a report to be sent to Slack
Once a report is scheduled, each one is saved in the archive so that you can review any previous state of your project. You can find the archive by selecting View previous reports from the same three-dot menu.